Nevada Investment Properties for Sale
Browse homes for sale and investment properties in Nevada. Refine your search by price, property type, or more.
Best cash flowing properties in Nevada

Active
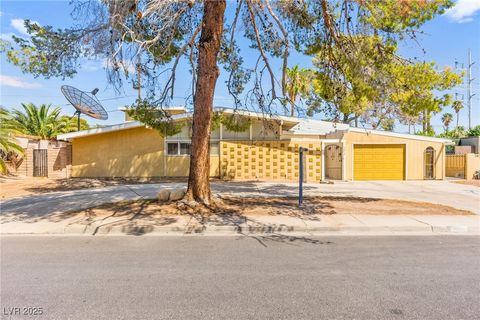
$141,000
3
bds
|
2
ba
|
1,194
sqft
|
built
1988
2060 Mesquite Ln, Laughlin, NV 89029
$-49
Cash flow
-1.8%
Cash-on-Cash Return
5.3%
Cap rate
1.0%
Rent to Value Ratio
Active
$396,000
4
bds
|
2
ba
|
2,829
sqft
|
built
1963
3368 Nahatan Way, Las Vegas, NV 89169
$-269
Cash flow
-3.5%
Cash-on-Cash Return
4.9%
Cap rate
0.6%
Rent to Value Ratio
5,257 out of 5,497 properties for sale in Nevada
Limited Results Shown
Create a free account, or log in to reveal all property listings and enjoy the complete experience.
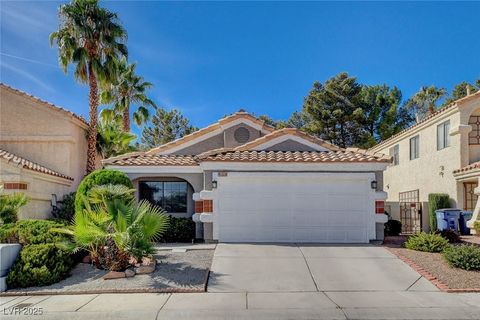
Active
$515,000
4
bds
|
2
ba
|
1,484
sqft
|
built
1988
2837 Autumn Haze Ln, Las Vegas, NV 89117
$-1,113
Cash flow
-11.3%
Cash-on-Cash Return
3.1%
Cap rate
0.4%
Rent to Value Ratio

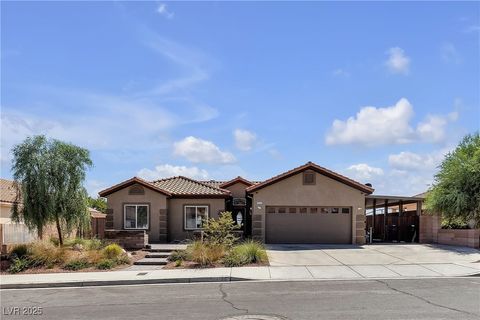
Active
$552,000
4
bds
|
3
ba
|
1,911
sqft
|
built
2011
7869 Barntucket Ave, Las Vegas, NV 89147
$-1,445
Cash flow
-13.7%
Cash-on-Cash Return
2.5%
Cap rate
0.4%
Rent to Value Ratio

Active
$436,000
3
bds
|
3
ba
|
1,985
sqft
|
built
2013
10612 Capitol Peak Ave, Las Vegas, NV 89166
$-730
Cash flow
-8.7%
Cash-on-Cash Return
3.7%
Cap rate
0.6%
Rent to Value Ratio

Active
$930,000
5
bds
|
4
ba
|
3,602
sqft
|
built
2019
20 Crooked Putter Dr, Las Vegas, NV 89148
$-2,282
Cash flow
-12.8%
Cash-on-Cash Return
2.7%
Cap rate
0.4%
Rent to Value Ratio

Active
$245,000
3
bds
|
2
ba
|
1,237
sqft
|
built
1988
2451 N Rainbow Blvd, Las Vegas, NV 89108
$-632
Cash flow
-13.5%
Cash-on-Cash Return
2.6%
Cap rate
0.6%
Rent to Value Ratio

Active
$379,999
2
bds
|
2
ba
|
1,138
sqft
|
built
2002
9901 Trailwood Dr, Las Vegas, NV 89134
$-792
Cash flow
-10.9%
Cash-on-Cash Return
3.2%
Cap rate
0.5%
Rent to Value Ratio

Active
$157,000
1
bds
|
1
ba
|
480
sqft
|
built
1963
3720 Royal Crest St, Las Vegas, NV 89119
$-447
Cash flow
-14.9%
Cash-on-Cash Return
2.3%
Cap rate
0.5%
Rent to Value Ratio
Active
$272,000
2
bds
|
2
ba
|
1,149
sqft
|
built
1994
3320 S Fort Apache Rd, Las Vegas, NV 89117
$-607
Cash flow
-11.6%
Cash-on-Cash Return
3.0%
Cap rate
0.5%
Rent to Value Ratio

Active
$390,000
3
bds
|
2
ba
|
1,703
sqft
|
built
2006
56 E Serene Ave, Las Vegas, NV 89123
$-948
Cash flow
-12.7%
Cash-on-Cash Return
2.8%
Cap rate
0.6%
Rent to Value Ratio

Active
$530,000
4
bds
|
3
ba
|
2,290
sqft
|
built
2015
9432 Logan Ridge Ct, Las Vegas, NV 89139
$-1,107
Cash flow
-10.9%
Cash-on-Cash Return
3.2%
Cap rate
0.5%
Rent to Value Ratio

Active
$404,999
3
bds
|
3
ba
|
2,036
sqft
|
built
2019
5276 Steptoe St, Las Vegas, NV 89122
$-862
Cash flow
-11.1%
Cash-on-Cash Return
3.1%
Cap rate
0.5%
Rent to Value Ratio

Active
$1,650,000
4
bds
|
4
ba
|
3,564
sqft
|
built
2021
11248 Rebel Dome Ct, Las Vegas, NV 89141
$-5,994
Cash flow
-19.0%
Cash-on-Cash Return
1.3%
Cap rate
0.2%
Rent to Value Ratio

Active
$715,000
3
bds
|
2
ba
|
2,297
sqft
|
built
2022
6479 Corsari Ridge St, Las Vegas, NV 89166
$-2,114
Cash flow
-15.4%
Cash-on-Cash Return
2.1%
Cap rate
0.4%
Rent to Value Ratio
Active
$824,990
5
bds
|
5
ba
|
3,634
sqft
|
built
2000
1115 Endora Way, Boulder City, NV 89005
$-1,813
Cash flow
-11.5%
Cash-on-Cash Return
3.0%
Cap rate
0.4%
Rent to Value Ratio
Active
$1,275,000
5
bds
|
4
ba
|
3,452
sqft
|
built
2022
1505 Carlsbad St, Boulder City, NV 89005
$-3,895
Cash flow
-15.9%
Cash-on-Cash Return
2.0%
Cap rate
0.3%
Rent to Value Ratio
Active
$339,000
2
bds
|
2
ba
|
1,194
sqft
|
built
1995
6131 Pumpkin Patch Ave, Las Vegas, NV 89142
$-516
Cash flow
-7.9%
Cash-on-Cash Return
3.9%
Cap rate
0.5%
Rent to Value Ratio

Active
$365,000
3
bds
|
2
ba
|
1,125
sqft
|
built
2000
648 Carlos Julio Ave, North Las Vegas, NV 89031
$-673
Cash flow
-9.6%
Cash-on-Cash Return
3.5%
Cap rate
0.5%
Rent to Value Ratio

Active
$1,849,999
5
bds
|
5
ba
|
4,224
sqft
|
built
2006
636 Chervil Valley Dr, Las Vegas, NV 89138
$-5,266
Cash flow
-14.9%
Cash-on-Cash Return
2.3%
Cap rate
0.3%
Rent to Value Ratio

Active
$499,999
4
bds
|
3
ba
|
2,097
sqft
|
built
1996
4723 Roby Grey Way, North Las Vegas, NV 89081
$-918
Cash flow
-9.6%
Cash-on-Cash Return
3.5%
Cap rate
0.5%
Rent to Value Ratio
Active
$439,000
3
bds
|
3
ba
|
2,065
sqft
|
built
2005
5905 Addy Ln, North Las Vegas, NV 89081
$-817
Cash flow
-9.7%
Cash-on-Cash Return
3.4%
Cap rate
0.5%
Rent to Value Ratio

Active
$724,900
4
bds
|
3
ba
|
2,620
sqft
|
built
2018
5144 Maverick St, Las Vegas, NV 89130
$-1,940
Cash flow
-14.0%
Cash-on-Cash Return
2.5%
Cap rate
0.4%
Rent to Value Ratio
Active
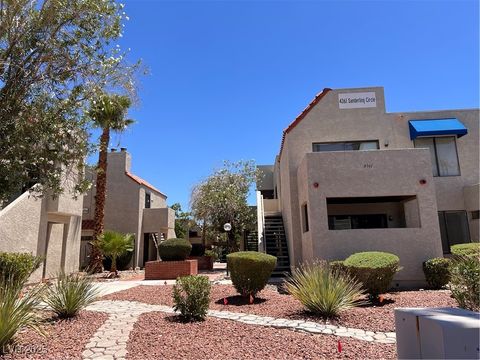
$185,000
1
bds
|
1
ba
|
514
sqft
|
built
1980
4361 Sanderling Cir, Las Vegas, NV 89103
$-495
Cash flow
-14.0%
Cash-on-Cash Return
2.5%
Cap rate
0.5%
Rent to Value Ratio

Active
$345,000
2
bds
|
2
ba
|
968
sqft
|
built
2003
8020 Copperhead Creek St, Las Vegas, NV 89143
$-552
Cash flow
-8.3%
Cash-on-Cash Return
3.8%
Cap rate
0.5%
Rent to Value Ratio

Active
$345,000
3
bds
|
3
ba
|
1,331
sqft
|
built
1994
7736 Allerton Ave, Las Vegas, NV 89128
$-326
Cash flow
-4.9%
Cash-on-Cash Return
4.5%
Cap rate
0.7%
Rent to Value Ratio
Active
$399,000
3
bds
|
3
ba
|
1,503
sqft
|
built
2014
7704 Classy Cashmere Ct, Las Vegas, NV 89149
$-774
Cash flow
-10.1%
Cash-on-Cash Return
3.4%
Cap rate
0.5%
Rent to Value Ratio

Active
$185,000
2
bds
|
1
ba
|
998
sqft
|
built
1994
3550 Bay Sands Dr, Laughlin, NV 89029
$-422
Cash flow
-11.9%
Cash-on-Cash Return
2.9%
Cap rate
0.6%
Rent to Value Ratio

Active
$390,000
3
bds
|
2
ba
|
1,952
sqft
|
built
2003
3597 Cottage Wood St, Laughlin, NV 89029
$-839
Cash flow
-11.2%
Cash-on-Cash Return
3.1%
Cap rate
0.5%
Rent to Value Ratio

Active
$133,000
1
bds
|
1
ba
|
724
sqft
|
built
1984
3720 Desert Marina Dr, Laughlin, NV 89029
$-303
Cash flow
-11.9%
Cash-on-Cash Return
2.9%
Cap rate
0.8%
Rent to Value Ratio

Active
$169,000
2
bds
|
2
ba
|
1,023
sqft
|
built
1987
1940 Las Palmas Ln, Laughlin, NV 89029
$-328
Cash flow
-10.1%
Cash-on-Cash Return
3.4%
Cap rate
0.8%
Rent to Value Ratio
Active
$589,000
3
bds
|
3
ba
|
1,687
sqft
|
built
1990
371 W Nopah Vista Ave, Pahrump, NV 89060
$-1,584
Cash flow
-14.0%
Cash-on-Cash Return
2.5%
Cap rate
0.3%
Rent to Value Ratio

Active
$350,000
3
bds
|
2
ba
|
1,584
sqft
|
built
1997
1791 S Highland Ave, Pahrump, NV 89048
$-505
Cash flow
-7.5%
Cash-on-Cash Return
3.9%
Cap rate
0.5%
Rent to Value Ratio
Active
$488,888
3
bds
|
2
ba
|
1,477
sqft
|
built
1996
2420 Tough Boy Rd, Pahrump, NV 89060
$-1,126
Cash flow
-12.0%
Cash-on-Cash Return
2.9%
Cap rate
0.4%
Rent to Value Ratio

Active
$289,900
2
bds
|
2
ba
|
989
sqft
|
built
1967
870 Second St, Pahrump, NV 89048
$-514
Cash flow
-9.3%
Cash-on-Cash Return
3.6%
Cap rate
0.4%
Rent to Value Ratio

Active
$315,000
3
bds
|
2
ba
|
1,857
sqft
|
built
2000
3251 Pheasant Hills Way, Laughlin, NV 89029
$-693
Cash flow
-11.5%
Cash-on-Cash Return
3.0%
Cap rate
0.6%
Rent to Value Ratio

Active
$315,000
1
bds
|
1
ba
|
1,001
sqft
|
built
2024
3090 Ness St, Pahrump, NV 89048
$-701
Cash flow
-11.6%
Cash-on-Cash Return
3.0%
Cap rate
0.4%
Rent to Value Ratio
Active
$375,000
3
bds
|
2
ba
|
1,609
sqft
|
built
1997
451 W Leffner Dr, Pahrump, NV 89060
$-542
Cash flow
-7.5%
Cash-on-Cash Return
3.9%
Cap rate
0.5%
Rent to Value Ratio

Active
$349,900
3
bds
|
2
ba
|
1,681
sqft
|
built
2002
5776 E Badlands Ln, Pahrump, NV 89061
$-495
Cash flow
-7.4%
Cash-on-Cash Return
4.0%
Cap rate
0.6%
Rent to Value Ratio

Active
$414,900
3
bds
|
2
ba
|
1,779
sqft
|
built
2003
5060 Wheatland Dr, Pahrump, NV 89061
$-606
Cash flow
-7.6%
Cash-on-Cash Return
3.9%
Cap rate
0.5%
Rent to Value Ratio