Ocean Isle Beach, NC Investment Properties for Sale
Browse homes for sale and investment properties in Ocean Isle Beach, NC. Refine your search by price, property type, or more.
Best cash flowing properties in Ocean Isle Beach, NC
Active
$425,000
2
bds
|
2
ba
|
1,303
sqft
|
built
2002
1871 Ocean View Dr SW, Ocean Isle Beach, NC 28469
$0
Cash flow
n/a
Cash-on-Cash Return
n/a
Cap rate
n/a
Rent to Value Ratio
Active
$358,000
3
bds
|
1
ba
|
1,550
sqft
|
built
1973
4735 Cedar Ln SW, Ocean Isle Beach, NC 28469
$-176
Cash flow
-2.6%
Cash-on-Cash Return
5.1%
Cap rate
0.6%
Rent to Value Ratio
51 out of 132 properties for sale in Ocean Isle Beach, NC
Limited Results Shown
Create a free account, or log in to reveal all property listings and enjoy the complete experience.
Active
$419,000
3
bds
|
3
ba
|
1,542
sqft
|
built
2005
1616 Pierce St SW, Ocean Isle Beach, NC 28469
$-396
Cash flow
-4.9%
Cash-on-Cash Return
4.5%
Cap rate
0.5%
Rent to Value Ratio
Active
$1,825,000
4
bds
|
4
ba
|
1,454
sqft
|
built
1979
455 E Third St, Ocean Isle Beach, NC 28469
$-6,348
Cash flow
-18.1%
Cash-on-Cash Return
1.5%
Cap rate
0.2%
Rent to Value Ratio
Active
$879,900
6
bds
|
3
ba
|
3,949
sqft
|
built
2016
1567 Colonist Sq SW, Ocean Isle Beach, NC 28469
$-1,818
Cash flow
-10.8%
Cash-on-Cash Return
3.2%
Cap rate
0.4%
Rent to Value Ratio
Active
$789,000
3
bds
|
3
ba
|
1,620
sqft
|
built
1987
63 Ocean Isle West Blvd, Ocean Isle Beach, NC 28469
$-2,462
Cash flow
-16.3%
Cash-on-Cash Return
1.9%
Cap rate
0.4%
Rent to Value Ratio

Active
$1,075,000
4
bds
|
4
ba
|
2,559
sqft
|
built
2004
114 E Second St, Ocean Isle Beach, NC 28469
$-2,971
Cash flow
-14.4%
Cash-on-Cash Return
2.4%
Cap rate
0.3%
Rent to Value Ratio
Active
$799,900
3
bds
|
3
ba
|
2,173
sqft
|
built
2018
6514 Anchors Bend Dr, Ocean Isle Beach, NC 28469
$-1,821
Cash flow
-11.9%
Cash-on-Cash Return
2.9%
Cap rate
0.4%
Rent to Value Ratio
Active
$949,000
4
bds
|
3
ba
|
1,624
sqft
|
built
2018
25 Atlantic Way, Ocean Isle Beach, NC 28469
$-2,658
Cash flow
-14.6%
Cash-on-Cash Return
2.3%
Cap rate
0.3%
Rent to Value Ratio

Active
$319,750
2
bds
|
2
ba
|
1,157
sqft
|
built
1988
1714 Deerfield Dr SW, Ocean Isle Beach, NC 28469
$-713
Cash flow
-11.6%
Cash-on-Cash Return
3.0%
Cap rate
0.6%
Rent to Value Ratio
Active
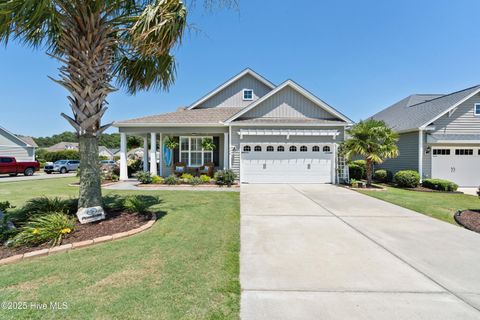
$419,000
3
bds
|
2
ba
|
1,544
sqft
|
built
2014
7000 Gracieuse Ln SW, Ocean Isle Beach, NC 28469
$-677
Cash flow
-8.4%
Cash-on-Cash Return
3.7%
Cap rate
0.5%
Rent to Value Ratio
Active
$825,000
3
bds
|
3
ba
|
3,119
sqft
|
built
2007
6574 Spencer Pl SW, Ocean Isle Beach, NC 28469
$-2,136
Cash flow
-13.5%
Cash-on-Cash Return
2.6%
Cap rate
0.4%
Rent to Value Ratio
Active
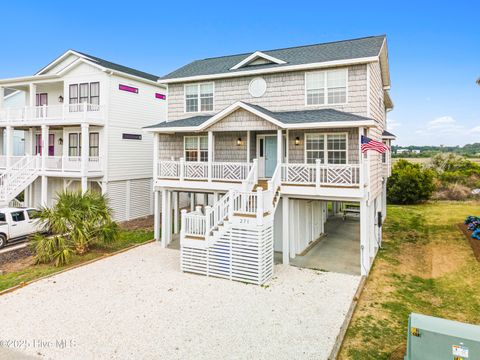
$1,214,000
5
bds
|
4
ba
|
2,199
sqft
|
built
1997
271 E Second St, Ocean Isle Beach, NC 28469
$-2,916
Cash flow
-12.5%
Cash-on-Cash Return
2.8%
Cap rate
0.3%
Rent to Value Ratio
Active
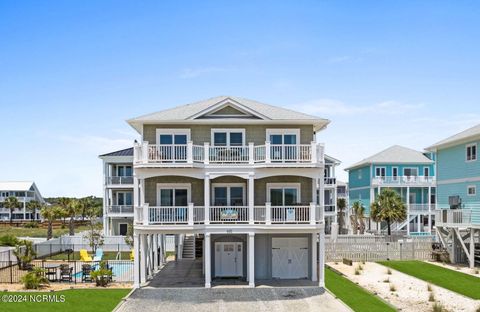
$1,599,900
4
bds
|
5
ba
|
1,980
sqft
|
built
2020
445 E Third St, Ocean Isle Beach, NC 28469
$-4,705
Cash flow
-15.3%
Cash-on-Cash Return
2.1%
Cap rate
0.3%
Rent to Value Ratio

Active
$845,000
4
bds
|
3
ba
|
3,740
sqft
|
built
1999
79 Windsor Cir SW, Ocean Isle Beach, NC 28469
$-1,350
Cash flow
-8.3%
Cash-on-Cash Return
3.8%
Cap rate
0.5%
Rent to Value Ratio

Active
$530,000
3
bds
|
2
ba
|
2,284
sqft
|
built
1999
154 Windsor Cir SW, Ocean Isle Beach, NC 28469
$-952
Cash flow
-9.4%
Cash-on-Cash Return
3.5%
Cap rate
0.5%
Rent to Value Ratio
Active
$999,000
3
bds
|
3
ba
|
1,900
sqft
|
built
1983
140 E Second St, Ocean Isle Beach, NC 28469
$-3,064
Cash flow
-16.0%
Cash-on-Cash Return
2.0%
Cap rate
0.3%
Rent to Value Ratio
Active
$590,000
3
bds
|
3
ba
|
2,349
sqft
|
built
2017
1398 Arot Ct SW, Ocean Isle Beach, NC 28469
$-949
Cash flow
-8.4%
Cash-on-Cash Return
3.7%
Cap rate
0.5%
Rent to Value Ratio
Active
$342,000
3
bds
|
2
ba
|
1,448
sqft
|
built
2018
934 Brewster Ct SW, Ocean Isle Beach, NC 28469
$-358
Cash flow
-5.5%
Cash-on-Cash Return
4.4%
Cap rate
0.6%
Rent to Value Ratio

Active
$720,000
4
bds
|
3
ba
|
2,303
sqft
|
built
2014
6439 Stopper Ln SW, Ocean Isle Beach, NC 28469
$-1,857
Cash flow
-13.5%
Cash-on-Cash Return
2.6%
Cap rate
0.4%
Rent to Value Ratio
Active
$514,900
2
bds
|
3
ba
|
2,019
sqft
|
built
2016
6460 Carrick Bend Trl SW, Ocean Isle Beach, NC 28469
$-1,322
Cash flow
-13.4%
Cash-on-Cash Return
2.6%
Cap rate
0.4%
Rent to Value Ratio

Active
$509,000
2
bds
|
2
ba
|
1,423
sqft
|
built
2014
6445 Figure Eight Dr SW, Ocean Isle Beach, NC 28469
$-1,083
Cash flow
-11.1%
Cash-on-Cash Return
3.1%
Cap rate
0.5%
Rent to Value Ratio
Active
$416,000
3
bds
|
2
ba
|
1,511
sqft
|
built
1987
1931 Wonderland St SW, Ocean Isle Beach, NC 28469
$-462
Cash flow
-5.8%
Cash-on-Cash Return
4.3%
Cap rate
0.5%
Rent to Value Ratio
Active
$526,900
2
bds
|
2
ba
|
1,903
sqft
|
built
2003
7035 Bloomsbury Ct SW, Ocean Isle Beach, NC 28469
$-1,257
Cash flow
-12.4%
Cash-on-Cash Return
2.8%
Cap rate
0.4%
Rent to Value Ratio
Active
$379,900
2
bds
|
2
ba
|
1,604
sqft
|
built
1966
6274 Culpepper Rd SW, Ocean Isle Beach, NC 28469
$-280
Cash flow
-3.8%
Cash-on-Cash Return
4.8%
Cap rate
0.6%
Rent to Value Ratio

Active
$1,700,000
5
bds
|
6
ba
|
2,506
sqft
|
built
2022
352 E Fourth St, Ocean Isle Beach, NC 28469
$-6,108
Cash flow
-18.7%
Cash-on-Cash Return
1.4%
Cap rate
0.2%
Rent to Value Ratio
Active
$549,000
2
bds
|
2
ba
|
1,905
sqft
|
built
1968
1990 Harbor Dr SW, Ocean Isle Beach, NC 28469
$-1,022
Cash flow
-9.7%
Cash-on-Cash Return
3.4%
Cap rate
0.5%
Rent to Value Ratio
Active
$340,000
3
bds
|
2
ba
|
1,365
sqft
|
built
2021
936 Bourne Dr, Ocean Isle Beach, NC 28469
$-312
Cash flow
-4.8%
Cash-on-Cash Return
4.6%
Cap rate
0.6%
Rent to Value Ratio
Active
$3,500,000
6
bds
|
6
ba
|
3,608
sqft
|
built
2000
349 W First St, Ocean Isle Beach, NC 28469
$-13,736
Cash flow
-20.5%
Cash-on-Cash Return
1.0%
Cap rate
0.2%
Rent to Value Ratio
Active
$1,775,000
4
bds
|
5
ba
|
2,277
sqft
|
built
2021
10 Via Dolorosa Dr, Ocean Isle Beach, NC 28469
$-5,632
Cash flow
-16.6%
Cash-on-Cash Return
1.9%
Cap rate
0.3%
Rent to Value Ratio
Active
$869,000
3
bds
|
3
ba
|
1,392
sqft
|
built
1967
2 Monroe St, Ocean Isle Beach, NC 28469
$-1,973
Cash flow
-11.8%
Cash-on-Cash Return
3.0%
Cap rate
0.4%
Rent to Value Ratio
Active
$1,225,000
5
bds
|
6
ba
|
4,329
sqft
|
built
2010
6790 Waterstone Xing SW, Ocean Isle Beach, NC 28469
$-4,110
Cash flow
-17.5%
Cash-on-Cash Return
1.7%
Cap rate
0.3%
Rent to Value Ratio
Active
$398,000
3
bds
|
2
ba
|
1,775
sqft
|
built
2022
6914 English Holly Ct SW, Ocean Isle Beach, NC 28469
$-485
Cash flow
-6.4%
Cash-on-Cash Return
4.2%
Cap rate
0.6%
Rent to Value Ratio

Active
$1,499,000
4
bds
|
3
ba
|
2,500
sqft
|
built
2015
449 E Fourth St, Ocean Isle Beach, NC 28469
$-4,740
Cash flow
-16.5%
Cash-on-Cash Return
1.9%
Cap rate
0.3%
Rent to Value Ratio
Active
$439,000
3
bds
|
2
ba
|
1,513
sqft
|
built
2010
1607 Gate 3 SW, Ocean Isle Beach, NC 28469
$-685
Cash flow
-8.1%
Cash-on-Cash Return
3.8%
Cap rate
0.5%
Rent to Value Ratio
Active
$875,000
4
bds
|
2
ba
|
1,566
sqft
|
built
1984
51 Wilmington St, Ocean Isle Beach, NC 28469
$-2,689
Cash flow
-16.0%
Cash-on-Cash Return
2.0%
Cap rate
0.3%
Rent to Value Ratio
Active
$1,399,000
4
bds
|
3
ba
|
2,312
sqft
|
built
2018
5 Via Dolorosa Dr, Ocean Isle Beach, NC 28469
$-3,904
Cash flow
-14.6%
Cash-on-Cash Return
2.3%
Cap rate
0.3%
Rent to Value Ratio
Active
$499,000
2
bds
|
2
ba
|
1,626
sqft
|
built
2017
1629 Marlin Spike Way SW, Ocean Isle Beach, NC 28469
$-1,175
Cash flow
-12.3%
Cash-on-Cash Return
2.9%
Cap rate
0.5%
Rent to Value Ratio

Active
$4,200,000
5
bds
|
5
ba
|
4,167
sqft
|
built
1997
95 Ocean Isle West Blvd, Ocean Isle Beach, NC 28469
$-17,985
Cash flow
-22.3%
Cash-on-Cash Return
0.5%
Cap rate
0.1%
Rent to Value Ratio
Active
$460,000
3
bds
|
2
ba
|
1,078
sqft
|
built
1984
240 W Second St, Ocean Isle Beach, NC 28469
$-1,396
Cash flow
-15.8%
Cash-on-Cash Return
2.0%
Cap rate
0.4%
Rent to Value Ratio