Ocean Springs, MS Investment Properties for Sale
Browse homes for sale and investment properties in Ocean Springs, MS. Refine your search by price, property type, or more.
Best cash flowing properties in Ocean Springs, MS
Active
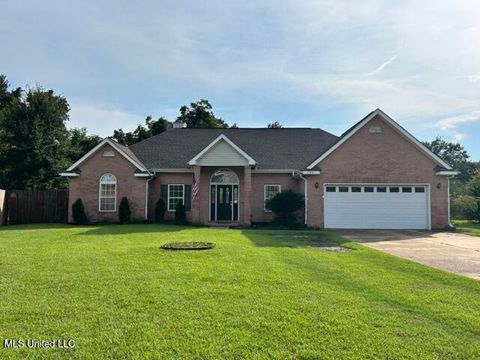
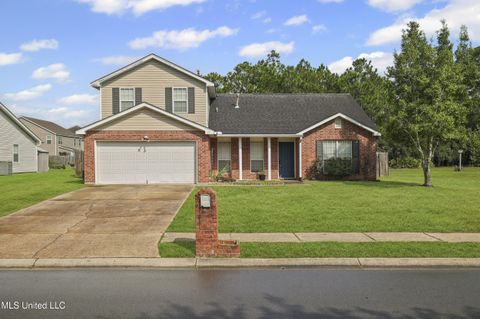
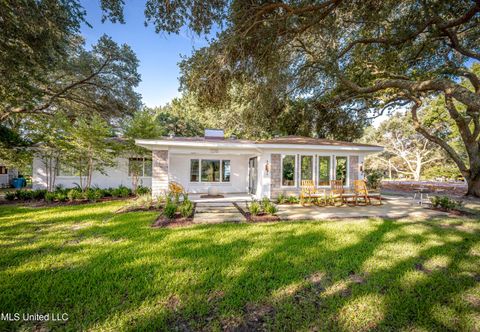
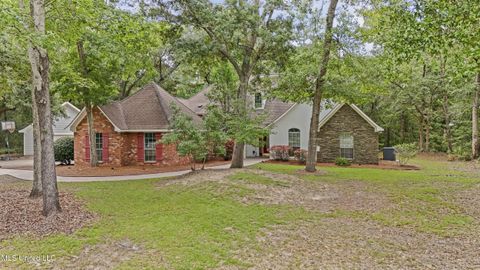
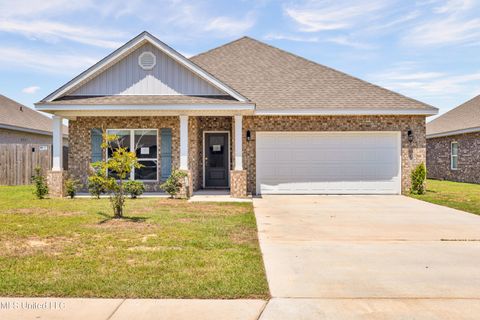
$289,900
4
bds
|
3
ba
|
0
sqft
|
built
2003
7921 Rue Madison, Ocean Springs, MS 39564
$353
Cash flow
6.4%
Cash-on-Cash Return
7.1%
Cap rate
0.9%
Rent to Value Ratio
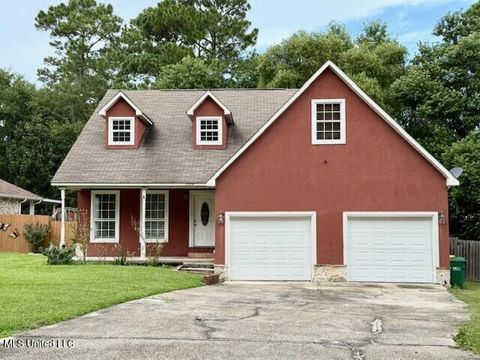
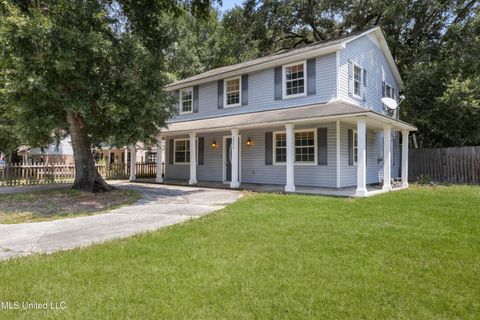
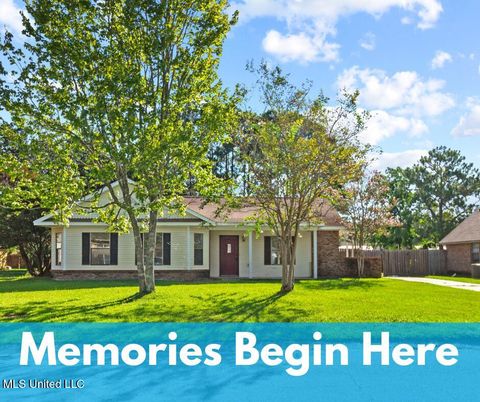
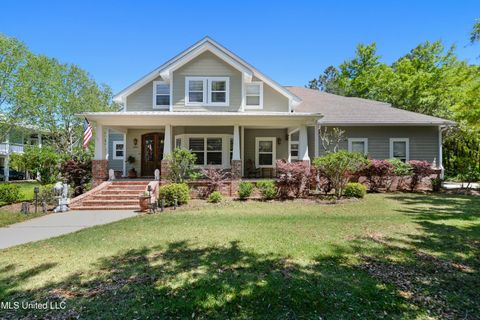
Active
$259,999
5
bds
|
3
ba
|
0
sqft
|
built
2007
2829 Villa Venezia Ct, Ocean Springs, MS 39564
$270
Cash flow
5.4%
Cash-on-Cash Return
6.9%
Cap rate
0.9%
Rent to Value Ratio
181 out of 197 properties for sale in Ocean Springs, MS
Limited Results Shown
Create a free account, or log in to reveal all property listings and enjoy the complete experience.

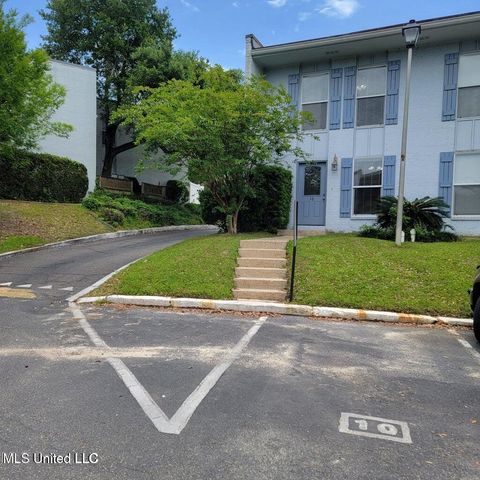
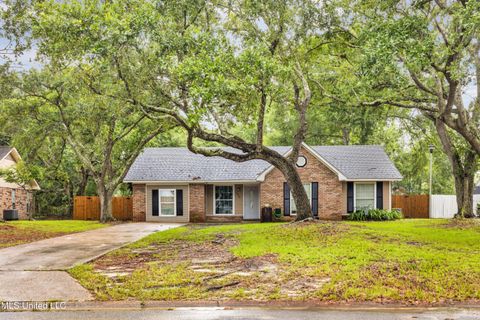
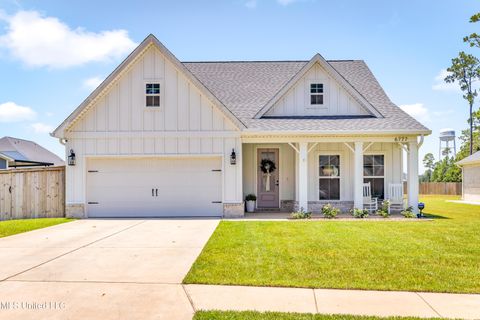
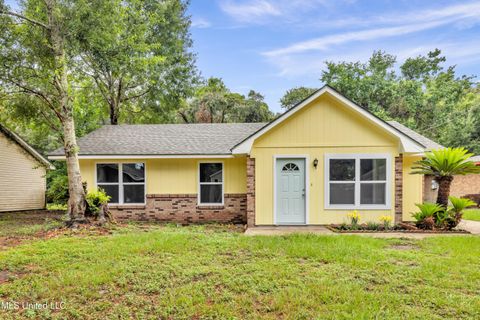
Active
$239,900
3
bds
|
2
ba
|
0
sqft
|
built
1997
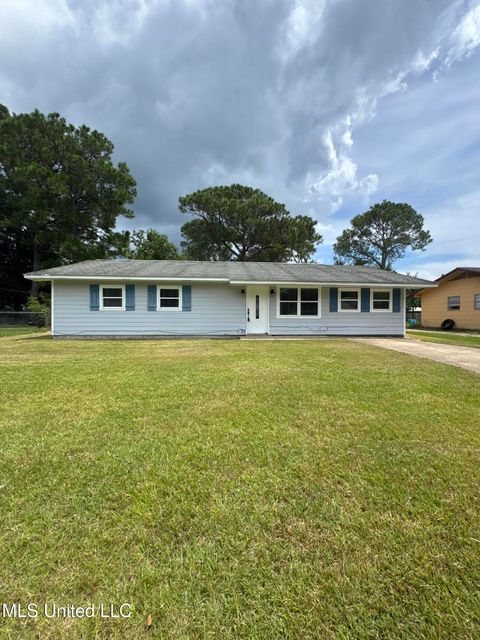
8809 Old Walnut Rd, Ocean Springs, MS 39564
$161
Cash flow
3.5%
Cash-on-Cash Return
6.5%
Cap rate
0.8%
Rent to Value Ratio
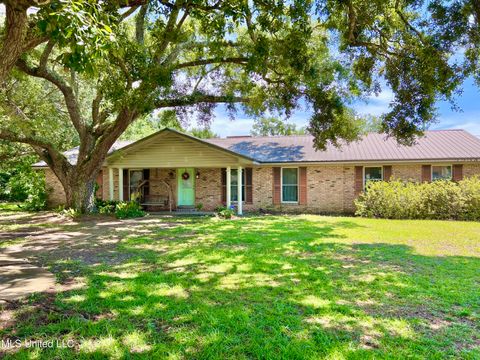
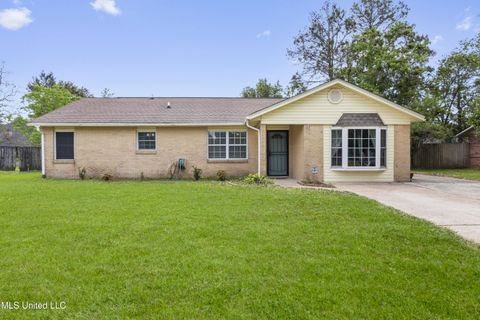
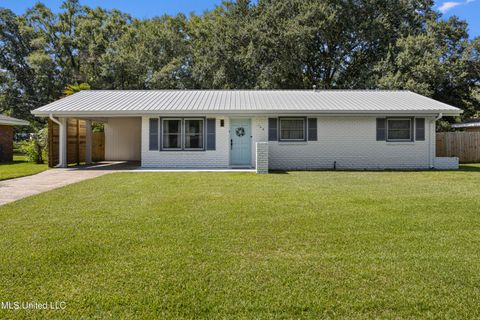
Active
$138,000
2
bds
|
2
ba
|
0
sqft
|
built
1972
3230 Cumberland Rd, Ocean Springs, MS 39564
$190
Cash flow
7.2%
Cash-on-Cash Return
7.3%
Cap rate
1.0%
Rent to Value Ratio

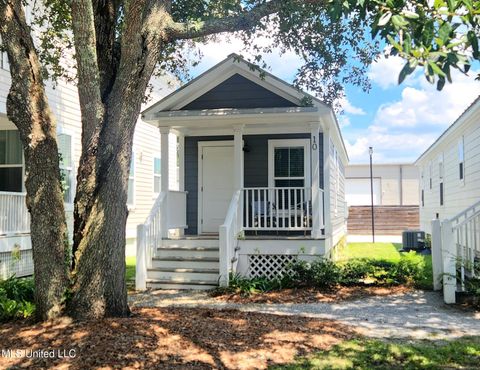
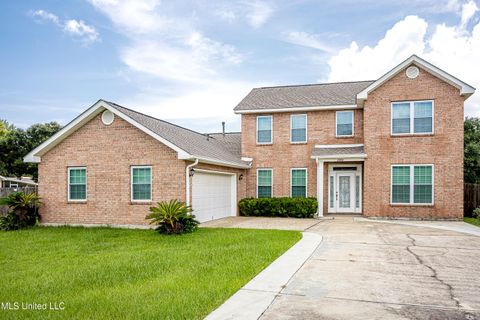
Active
$549,000
1
bds
|
2
ba
|
0
sqft
|
built
1908
1306 Bowen Ave, Ocean Springs, MS 39564
$-851
Cash flow
-8.1%
Cash-on-Cash Return
3.8%
Cap rate
0.5%
Rent to Value Ratio
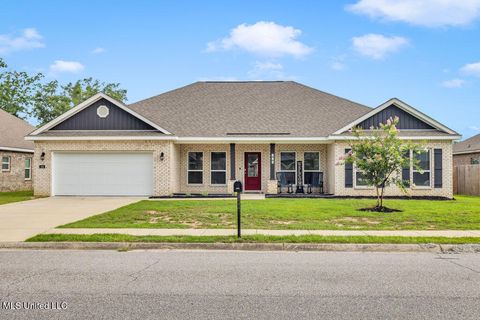
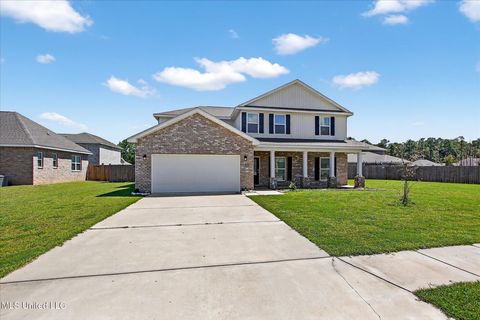
Active
$369,500
4
bds
|
3
ba
|
0
sqft
|
built
2022
124 Oyster Catcher Cv, Ocean Springs, MS 39564
$-77
Cash flow
-1.1%
Cash-on-Cash Return
5.4%
Cap rate
0.8%
Rent to Value Ratio
Active
$435,000
4
bds
|
3
ba
|
0
sqft
|
built
2022
12265 Savannah Cir, Ocean Springs, MS 39564
$-423
Cash flow
-5.1%
Cash-on-Cash Return
4.5%
Cap rate
0.7%
Rent to Value Ratio
Active
$535,000
4
bds
|
4
ba
|
0
sqft
|
built
1994
13809 Plano Rd, Ocean Springs, MS 39564
$-726
Cash flow
-7.1%
Cash-on-Cash Return
4.1%
Cap rate
0.6%
Rent to Value Ratio
Active
$180,000
3
bds
|
2
ba
|
0
sqft
|
built
1997
808 Orange St, Ocean Springs, MS 39564
$131
Cash flow
3.8%
Cash-on-Cash Return
6.6%
Cap rate
0.9%
Rent to Value Ratio
Active
$685,000
4
bds
|
3
ba
|
0
sqft
|
built
1977
110 Simon Blvd, Ocean Springs, MS 39564
$-1,165
Cash flow
-8.9%
Cash-on-Cash Return
3.6%
Cap rate
0.5%
Rent to Value Ratio
Active
$312,500
4
bds
|
3
ba
|
0
sqft
|
built
2002
26 Lakeview Dr, Ocean Springs, MS 39564
$-182
Cash flow
-3.0%
Cash-on-Cash Return
5.0%
Cap rate
0.7%
Rent to Value Ratio

Active
$241,000
4
bds
|
2
ba
|
0
sqft
|
built
2005
1620 Porpoise Dr, Ocean Springs, MS 39564
$181
Cash flow
3.9%
Cash-on-Cash Return
6.6%
Cap rate
0.9%
Rent to Value Ratio
Active
$234,900
1
bds
|
1
ba
|
0
sqft
|
built
2008
2207 Government St, Ocean Springs, MS 39564
$-358
Cash flow
-8.0%
Cash-on-Cash Return
3.9%
Cap rate
0.6%
Rent to Value Ratio
Active
$259,000
4
bds
|
3
ba
|
0
sqft
|
built
1993
2804 Beachview Dr, Ocean Springs, MS 39564
$209
Cash flow
4.2%
Cash-on-Cash Return
6.6%
Cap rate
0.8%
Rent to Value Ratio

Active
$269,900
4
bds
|
3
ba
|
0
sqft
|
built
1993
10100 Iroquois Ave, Ocean Springs, MS 39564
$49
Cash flow
0.9%
Cash-on-Cash Return
5.9%
Cap rate
0.7%
Rent to Value Ratio
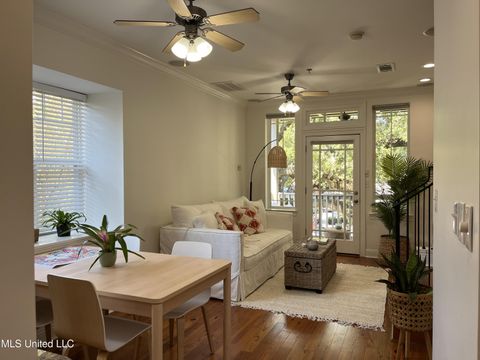
Active
$498,500
2
bds
|
2
ba
|
0
sqft
|
built
2008
922 Porter Ave, Ocean Springs, MS 39564
$-1,720
Cash flow
-18.0%
Cash-on-Cash Return
1.5%
Cap rate
0.5%
Rent to Value Ratio

Active
$479,900
4
bds
|
4
ba
|
0
sqft
|
built
2018
1205 Jean Ln, Ocean Springs, MS 39564
$-750
Cash flow
-8.2%
Cash-on-Cash Return
3.8%
Cap rate
0.5%
Rent to Value Ratio
Active
$989,000
4
bds
|
3
ba
|
0
sqft
|
built
1951
1210 Harbor Rd, Ocean Springs, MS 39564
$-2,076
Cash flow
-11.0%
Cash-on-Cash Return
3.2%
Cap rate
0.5%
Rent to Value Ratio
Active
$225,000
3
bds
|
2
ba
|
0
sqft
|
built
1986
5316 Culeoka Dr, Ocean Springs, MS 39564
$74
Cash flow
1.7%
Cash-on-Cash Return
6.1%
Cap rate
0.8%
Rent to Value Ratio
Active
$195,000
4
bds
|
2
ba
|
0
sqft
|
built
1985
6929 Red Bud Ln, Ocean Springs, MS 39564
$120
Cash flow
3.2%
Cash-on-Cash Return
6.4%
Cap rate
0.8%
Rent to Value Ratio
Active
$235,000
3
bds
|
2
ba
|
0
sqft
|
built
1969
7904 Point Aux Chenes Rd, Ocean Springs, MS 39564
$-591
Cash flow
-13.1%
Cash-on-Cash Return
2.7%
Cap rate
0.9%
Rent to Value Ratio
Active
$185,000
4
bds
|
3
ba
|
0
sqft
|
built
1969
6608 Columbus Cir, Ocean Springs, MS 39564
$114
Cash flow
3.2%
Cash-on-Cash Return
6.4%
Cap rate
0.9%
Rent to Value Ratio
Active
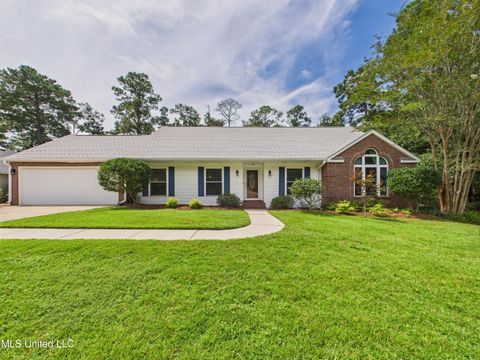
$385,000
4
bds
|
2
ba
|
0
sqft
|
built
1994
3620 Portree Pl, Ocean Springs, MS 39564
$-97
Cash flow
-1.3%
Cash-on-Cash Return
5.4%
Cap rate
0.6%
Rent to Value Ratio
Active
$385,000
5
bds
|
3
ba
|
0
sqft
|
built
2022
12210 Savannah Cir, Ocean Springs, MS 39564
$-302
Cash flow
-4.1%
Cash-on-Cash Return
4.7%
Cap rate
0.7%
Rent to Value Ratio
Active
$719,000
3
bds
|
3
ba
|
0
sqft
|
built
2023
7420 Old Fort Bayou Rd, Ocean Springs, MS 39564
$-2,059
Cash flow
-14.9%
Cash-on-Cash Return
2.2%
Cap rate
0.4%
Rent to Value Ratio

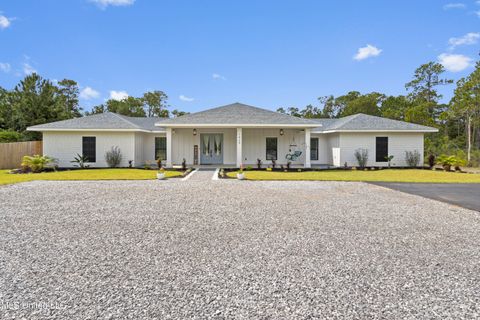
Active
$305,000
4
bds
|
2
ba
|
0
sqft
|
built
2023
84 Saltmeadow Cir, Ocean Springs, MS 39564
$12
Cash flow
0.2%
Cash-on-Cash Return
5.7%
Cap rate
0.8%
Rent to Value Ratio

Active
$239,000
3
bds
|
3
ba
|
0
sqft
|
built
2022
2409 Esplanade St, Ocean Springs, MS 39564
$101
Cash flow
2.2%
Cash-on-Cash Return
6.2%
Cap rate
0.9%
Rent to Value Ratio
Active
$398,500
4
bds
|
2
ba
|
0
sqft
|
built
2003
1400 Mary St, Ocean Springs, MS 39564
$253
Cash flow
3.3%
Cash-on-Cash Return
6.4%
Cap rate
0.8%
Rent to Value Ratio
Active
$725,000
5
bds
|
4
ba
|
0
sqft
|
built
2007
3100 Eagle Point Rd, Ocean Springs, MS 39564
$-1,348
Cash flow
-9.7%
Cash-on-Cash Return
3.4%
Cap rate
0.5%
Rent to Value Ratio
Active
$331,490
3
bds
|
2
ba
|
0
sqft
|
built
2023
6777 Maurepas Cir, Ocean Springs, MS 39564
$-5
Cash flow
-0.1%
Cash-on-Cash Return
5.7%
Cap rate
0.8%
Rent to Value Ratio
Active
$219,000
3
bds
|
2
ba
|
0
sqft
|
built
1979
12509 Ponce De Leon Dr, Ocean Springs, MS 39564
$241
Cash flow
5.7%
Cash-on-Cash Return
7.0%
Cap rate
0.9%
Rent to Value Ratio
Active
$299,000
2
bds
|
1
ba
|
0
sqft
|
built
1950
718 Signal St, Ocean Springs, MS 39564
$-472
Cash flow
-8.2%
Cash-on-Cash Return
3.8%
Cap rate
0.5%
Rent to Value Ratio
Active
$349,900
3
bds
|
2
ba
|
0
sqft
|
built
1966
100 Hunter Dr, Ocean Springs, MS 39564
$92
Cash flow
1.4%
Cash-on-Cash Return
6.0%
Cap rate
0.8%
Rent to Value Ratio
Active
$190,000
3
bds
|
2
ba
|
0
sqft
|
built
1973
4213 Yosemite Dr, Ocean Springs, MS 39564
$265
Cash flow
7.3%
Cash-on-Cash Return
7.4%
Cap rate
0.9%
Rent to Value Ratio
Active
$274,900
3
bds
|
2
ba
|
0
sqft
|
built
2015
74 Tantallon Dr, Ocean Springs, MS 39564
$-76
Cash flow
-1.4%
Cash-on-Cash Return
5.3%
Cap rate
0.7%
Rent to Value Ratio
Active
$271,000
4
bds
|
2
ba
|
0
sqft
|
built
2022
7348 Shearwater Way, Ocean Springs, MS 39564
$166
Cash flow
3.2%
Cash-on-Cash Return
6.4%
Cap rate
0.9%
Rent to Value Ratio
Active
$158,000
3
bds
|
1
ba
|
0
sqft
|
built
1978
1528 S 10th St, Ocean Springs, MS 39564
$256
Cash flow
8.5%
Cash-on-Cash Return
7.6%
Cap rate
1.0%
Rent to Value Ratio
Active
$245,000
3
bds
|
1
ba
|
0
sqft
|
built
1962
108 Sunhaven Dr, Ocean Springs, MS 39564
$-337
Cash flow
-7.2%
Cash-on-Cash Return
4.0%
Cap rate
0.6%
Rent to Value Ratio
Active
$359,900
4
bds
|
3
ba
|
0
sqft
|
built
2004
2204 Shelby Ln, Ocean Springs, MS 39564
$-57
Cash flow
-0.8%
Cash-on-Cash Return
5.5%
Cap rate
0.7%
Rent to Value Ratio
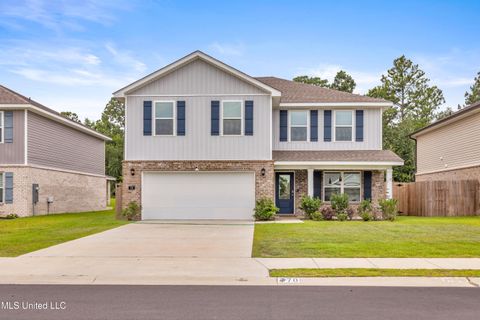
Active
$330,000
4
bds
|
3
ba
|
0
sqft
|
built
2023
70 Saltmeadow Cir, Ocean Springs, MS 39564
$-35
Cash flow
-0.6%
Cash-on-Cash Return
5.6%
Cap rate
0.8%
Rent to Value Ratio