Ocean Springs, MS Investment Properties for Sale
Browse homes for sale and investment properties in Ocean Springs, MS. Refine your search by price, property type, or more.
Best cash flowing properties in Ocean Springs, MS

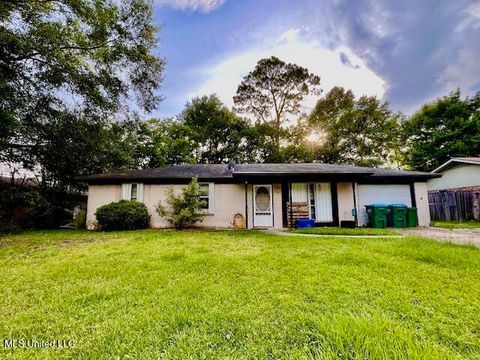
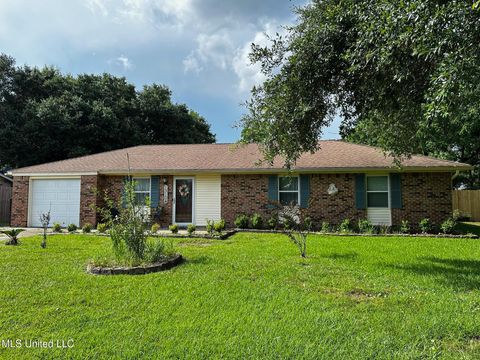
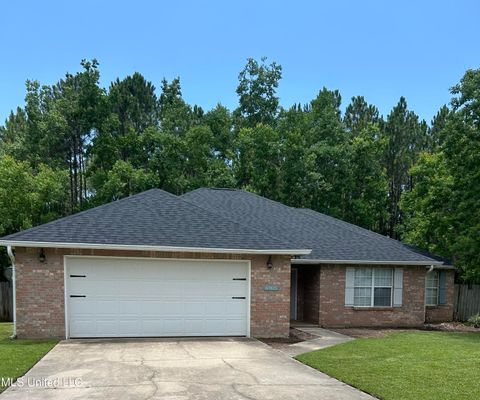
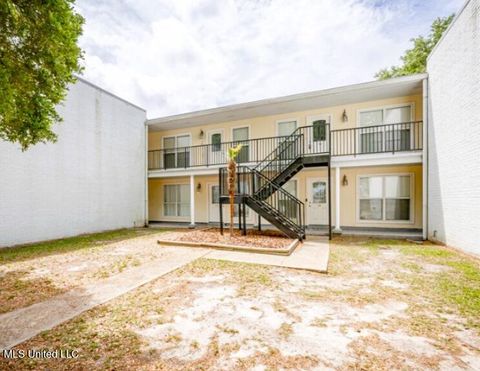
Active
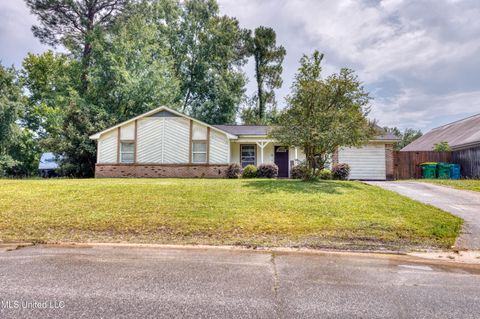
$179,000
3
bds
|
2
ba
|
0
sqft
|
built
2003
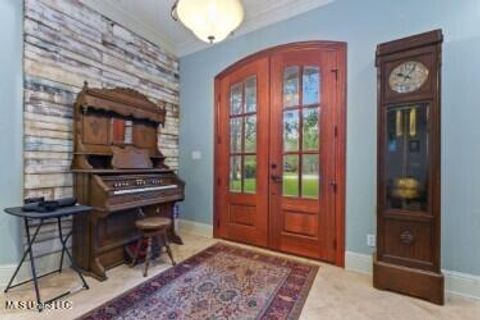
1021 Magnolia St, Ocean Springs, MS 39564
$454
Cash flow
13.2%
Cash-on-Cash Return
8.7%
Cap rate
1.1%
Rent to Value Ratio
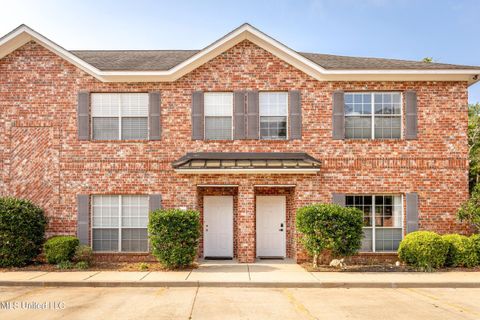
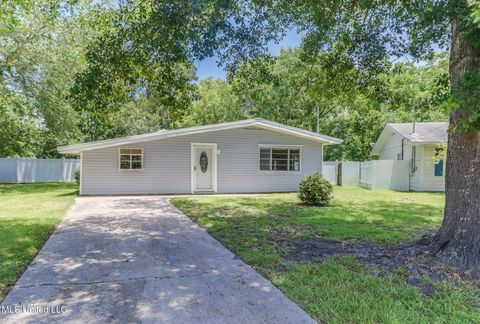
Active
$145,000
3
bds
|
1
ba
|
0
sqft
|
built
1973
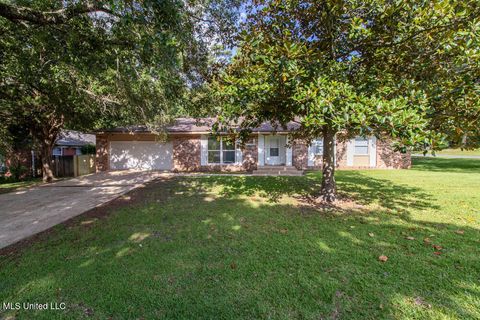
103 Niagara Ave, Ocean Springs, MS 39564
$335
Cash flow
12.1%
Cash-on-Cash Return
8.4%
Cap rate
1.1%
Rent to Value Ratio
183 out of 198 properties for sale in Ocean Springs, MS
Limited Results Shown
Create a free account, or log in to reveal all property listings and enjoy the complete experience.

Active
$310,000
4
bds
|
2
ba
|
0
sqft
|
built
2000
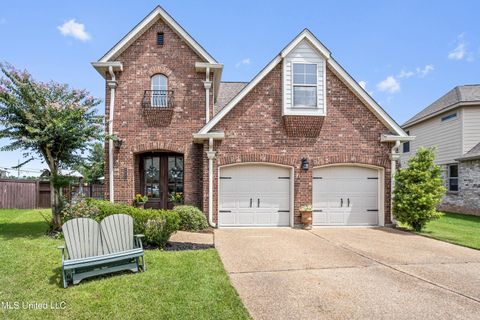
20 Lakeview Dr, Ocean Springs, MS 39564
$-27
Cash flow
-0.5%
Cash-on-Cash Return
5.6%
Cap rate
0.7%
Rent to Value Ratio
Active
$410,000
3
bds
|
3
ba
|
0
sqft
|
built
2019
205 Madison Place Dr, Ocean Springs, MS 39564
$-487
Cash flow
-6.2%
Cash-on-Cash Return
4.8%
Cap rate
0.7%
Rent to Value Ratio
Active
$234,900
1
bds
|
1
ba
|
0
sqft
|
built
2008
2207 Government St, Ocean Springs, MS 39564
$-296
Cash flow
-6.6%
Cash-on-Cash Return
4.2%
Cap rate
0.7%
Rent to Value Ratio

Active
$398,000
3
bds
|
2
ba
|
0
sqft
|
built
2016
9804 Sanctuary Blvd, Ocean Springs, MS 39564
$-507
Cash flow
-6.6%
Cash-on-Cash Return
4.1%
Cap rate
0.6%
Rent to Value Ratio
Active
$215,000
3
bds
|
2
ba
|
0
sqft
|
built
1985
425 Inverness Ct, Ocean Springs, MS 39564
$-2
Cash flow
0.0%
Cash-on-Cash Return
5.7%
Cap rate
0.8%
Rent to Value Ratio

Active
$1,690,000
6
bds
|
4
ba
|
0
sqft
|
built
2008
513 Front Beach Dr, Ocean Springs, MS 39564
$-6,031
Cash flow
-18.6%
Cash-on-Cash Return
1.4%
Cap rate
0.3%
Rent to Value Ratio
Active
$215,000
4
bds
|
2
ba
|
0
sqft
|
built
1987
12513 Canterbury Dr W, Ocean Springs, MS 39564
$71
Cash flow
1.7%
Cash-on-Cash Return
6.1%
Cap rate
0.8%
Rent to Value Ratio

Active
$313,500
4
bds
|
2
ba
|
0
sqft
|
built
2004
2808 Rue Beaux Chenes, Ocean Springs, MS 39564
$-151
Cash flow
-2.5%
Cash-on-Cash Return
5.1%
Cap rate
0.7%
Rent to Value Ratio
Active
$419,900
3
bds
|
2
ba
|
0
sqft
|
built
2022
6828 Enclave Ln, Ocean Springs, MS 39564
$-297
Cash flow
-3.7%
Cash-on-Cash Return
4.8%
Cap rate
0.7%
Rent to Value Ratio
Active
$895,500
3
bds
|
3
ba
|
0
sqft
|
built
1972
14104 W El Bonito Dr, Ocean Springs, MS 39564
$-2,594
Cash flow
-15.1%
Cash-on-Cash Return
2.2%
Cap rate
0.3%
Rent to Value Ratio
Active
$329,900
3
bds
|
2
ba
|
0
sqft
|
built
2004
1602 Heather Ct, Ocean Springs, MS 39564
$-98
Cash flow
-1.5%
Cash-on-Cash Return
5.3%
Cap rate
0.7%
Rent to Value Ratio
Active
$205,000
3
bds
|
2
ba
|
0
sqft
|
built
1984
13104 Sweetbriar St, Ocean Springs, MS 39564
$266
Cash flow
6.8%
Cash-on-Cash Return
7.2%
Cap rate
0.9%
Rent to Value Ratio
Active
$207,500
2
bds
|
3
ba
|
0
sqft
|
built
2009
102 Armand Oaks, Ocean Springs, MS 39564
$4
Cash flow
0.1%
Cash-on-Cash Return
5.7%
Cap rate
0.9%
Rent to Value Ratio

Active
$199,900
3
bds
|
2
ba
|
0
sqft
|
built
1997
1812 Burnt Oak Dr, Ocean Springs, MS 39564
$221
Cash flow
5.8%
Cash-on-Cash Return
7.0%
Cap rate
0.9%
Rent to Value Ratio
Active
$369,000
3
bds
|
2
ba
|
0
sqft
|
built
2006
700 Tantallon Dr, Ocean Springs, MS 39564
$-131
Cash flow
-1.9%
Cash-on-Cash Return
5.3%
Cap rate
0.7%
Rent to Value Ratio
Active
$490,000
4
bds
|
3
ba
|
0
sqft
|
built
1963
6825 Shore Dr, Ocean Springs, MS 39564
$-636
Cash flow
-6.8%
Cash-on-Cash Return
4.1%
Cap rate
0.5%
Rent to Value Ratio
Active
$585,900
4
bds
|
3
ba
|
0
sqft
|
built
2010
3216 Oakleigh Cir, Ocean Springs, MS 39564
$-1,069
Cash flow
-9.5%
Cash-on-Cash Return
3.5%
Cap rate
0.5%
Rent to Value Ratio
Active
$349,900
4
bds
|
2
ba
|
0
sqft
|
built
1965
13128 Hanover Dr, Ocean Springs, MS 39564
$-359
Cash flow
-5.4%
Cash-on-Cash Return
5.0%
Cap rate
0.7%
Rent to Value Ratio
Active
$399,900
3
bds
|
3
ba
|
0
sqft
|
built
2014
3841 Chateau Cv, Ocean Springs, MS 39564
$-502
Cash flow
-6.5%
Cash-on-Cash Return
4.2%
Cap rate
0.6%
Rent to Value Ratio
Active
$137,500
3
bds
|
2
ba
|
0
sqft
|
built
1972
3230 Cumberland Rd, Ocean Springs, MS 39564
$-320
Cash flow
-12.1%
Cash-on-Cash Return
2.9%
Cap rate
1.1%
Rent to Value Ratio

Active
$367,900
4
bds
|
3
ba
|
0
sqft
|
built
2016
6509 Sugarcane Cir, Ocean Springs, MS 39564
$30
Cash flow
0.4%
Cash-on-Cash Return
5.8%
Cap rate
0.7%
Rent to Value Ratio
Active
$235,000
4
bds
|
2
ba
|
0
sqft
|
built
2003
6905 Pinehurst Dr, Ocean Springs, MS 39564
$-53
Cash flow
-1.2%
Cash-on-Cash Return
5.4%
Cap rate
0.8%
Rent to Value Ratio
Active
$379,000
4
bds
|
3
ba
|
0
sqft
|
built
2023
11625 Talla Dr, Ocean Springs, MS 39564
$-442
Cash flow
-6.1%
Cash-on-Cash Return
4.8%
Cap rate
0.7%
Rent to Value Ratio

Active
$369,900
4
bds
|
2
ba
|
0
sqft
|
built
2018
6804 Sweetclover Dr, Ocean Springs, MS 39564
$-149
Cash flow
-2.1%
Cash-on-Cash Return
5.2%
Cap rate
0.7%
Rent to Value Ratio
Active
$249,000
3
bds
|
2
ba
|
0
sqft
|
built
2007
1426 Porpoise Dr, Ocean Springs, MS 39564
$101
Cash flow
2.1%
Cash-on-Cash Return
6.2%
Cap rate
0.8%
Rent to Value Ratio

Active
$289,000
3
bds
|
2
ba
|
0
sqft
|
built
1986
3106 Breezy Hill Ln, Ocean Springs, MS 39564
$-224
Cash flow
-4.0%
Cash-on-Cash Return
4.8%
Cap rate
0.7%
Rent to Value Ratio
Active
$259,000
3
bds
|
2
ba
|
0
sqft
|
built
2019
1516 Cook St, Ocean Springs, MS 39564
$42
Cash flow
0.8%
Cash-on-Cash Return
5.9%
Cap rate
0.8%
Rent to Value Ratio

Active
$169,000
2
bds
|
2
ba
|
0
sqft
|
built
1972
3230 Cumberland Rd, Ocean Springs, MS 39564
$43
Cash flow
1.3%
Cash-on-Cash Return
6.0%
Cap rate
0.8%
Rent to Value Ratio

Active
$129,900
2
bds
|
2
ba
|
0
sqft
|
built
1972
3230 Cumberland Rd, Ocean Springs, MS 39564
$-220
Cash flow
-8.8%
Cash-on-Cash Return
3.6%
Cap rate
1.1%
Rent to Value Ratio
Active
$139,900
3
bds
|
2
ba
|
0
sqft
|
built
1972
3230 Cumberland Rd, Ocean Springs, MS 39564
$-479
Cash flow
-17.9%
Cash-on-Cash Return
2.1%
Cap rate
1.0%
Rent to Value Ratio

Active
$239,900
4
bds
|
2
ba
|
0
sqft
|
built
1965
205 Walnut Dr, Ocean Springs, MS 39564
$-41
Cash flow
-0.9%
Cash-on-Cash Return
5.5%
Cap rate
0.8%
Rent to Value Ratio
Active
$278,000
3
bds
|
2
ba
|
0
sqft
|
built
1959
311 Teringo Cir, Ocean Springs, MS 39564
$-234
Cash flow
-4.4%
Cash-on-Cash Return
4.7%
Cap rate
0.6%
Rent to Value Ratio
Active
$349,900
3
bds
|
2
ba
|
0
sqft
|
built
1978
105 Leigh Cir, Ocean Springs, MS 39564
$-226
Cash flow
-3.4%
Cash-on-Cash Return
4.9%
Cap rate
0.7%
Rent to Value Ratio

Active
$725,000
15
bds
|
10
ba
|
0
sqft
|
built
2007
9529 Smith Ave, Ocean Springs, MS 39565
$-2,960
Cash flow
-21.3%
Cash-on-Cash Return
0.8%
Cap rate
0.2%
Rent to Value Ratio

Active
$240,000
3
bds
|
2
ba
|
0
sqft
|
built
1982
110 Reynolds Cir, Ocean Springs, MS 39564
$125
Cash flow
2.7%
Cash-on-Cash Return
6.3%
Cap rate
0.8%
Rent to Value Ratio
Active
$619,000
5
bds
|
3
ba
|
0
sqft
|
built
2022
9379 Taylor Pl, Ocean Springs, MS 39564
$-1,156
Cash flow
-9.7%
Cash-on-Cash Return
3.4%
Cap rate
0.5%
Rent to Value Ratio

Active
$319,900
3
bds
|
2
ba
|
0
sqft
|
built
1969
272 Holcomb Blvd, Ocean Springs, MS 39564
$-237
Cash flow
-3.9%
Cash-on-Cash Return
4.8%
Cap rate
0.6%
Rent to Value Ratio

Active
$620,000
12
bds
|
8
ba
|
0
sqft
|
built
2007
9620 Nevada Ave, Ocean Springs, MS 39565
$-2,134
Cash flow
-18.0%
Cash-on-Cash Return
1.5%
Cap rate
0.3%
Rent to Value Ratio