Orange, CT Investment Properties for Sale
Browse homes for sale and investment properties in Orange, CT. Refine your search by price, property type, or more.
Best cash flowing properties in Orange, CT
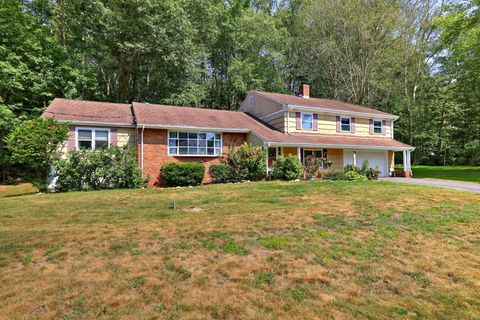
Active
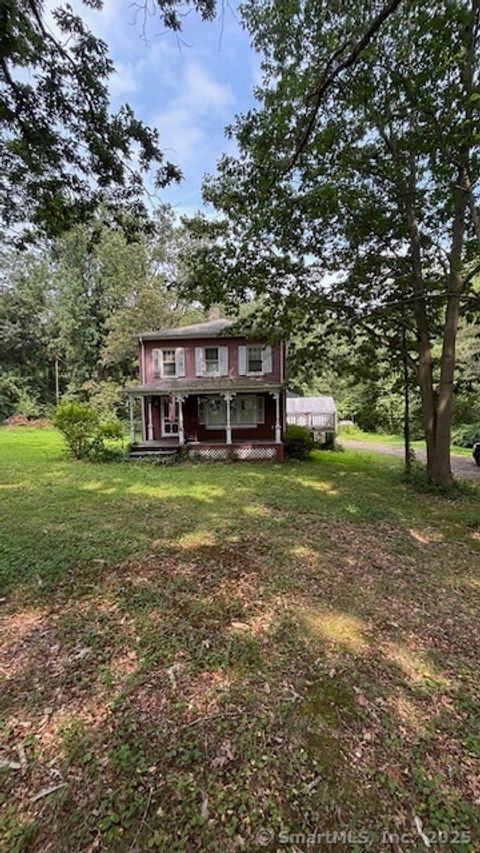
$399,900
4
bds
|
2
ba
|
2,554
sqft
|
built
1949
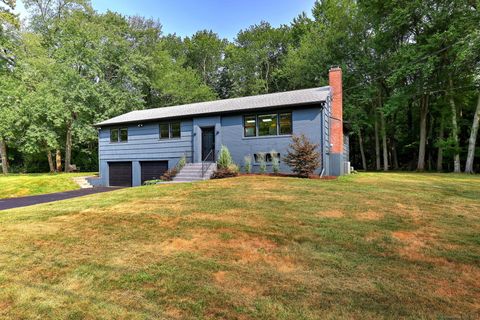
122 Derby Ave, Orange, CT 06477
$-97
Cash flow
-1.3%
Cash-on-Cash Return
5.4%
Cap rate
0.9%
Rent to Value Ratio
Active
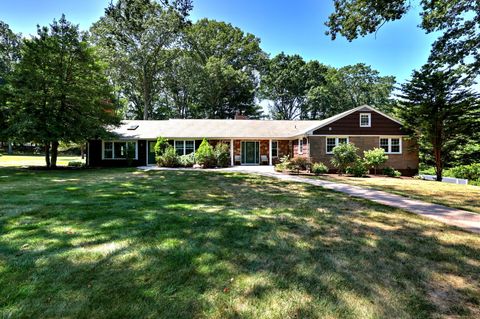
$399,900
2
bds
|
2
ba
|
1,920
sqft
|
built
1949
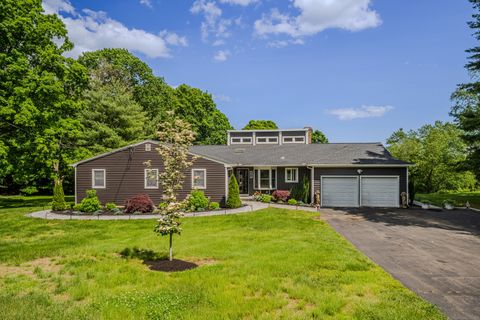
330 Dogburn Ln, Orange, CT 06477
$-192
Cash flow
-2.5%
Cash-on-Cash Return
5.1%
Cap rate
0.8%
Rent to Value Ratio
16 out of 17 properties for sale in Orange, CT
Limited Results Shown
Create a free account, or log in to reveal all property listings and enjoy the complete experience.
Active
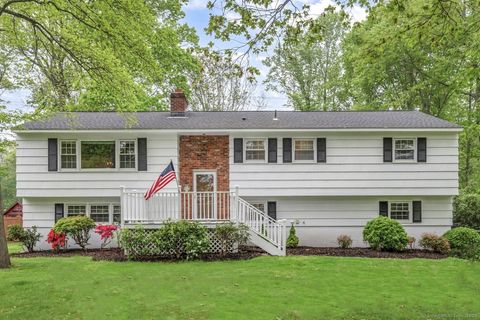
$899,000
6
bds
|
3
ba
|
2,996
sqft
|
built
1957
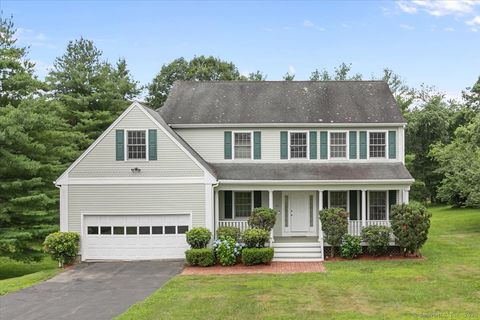
691 Buttonball Rd, Orange, CT 06477
$-1,917
Cash flow
-11.1%
Cash-on-Cash Return
3.1%
Cap rate
0.6%
Rent to Value Ratio
Active
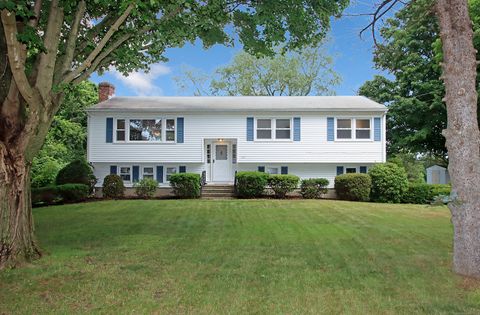
$550,000
2
bds
|
2
ba
|
1,957
sqft
|
built
1956
847 Glenbrook Rd, Orange, CT 06477
$-772
Cash flow
-7.3%
Cash-on-Cash Return
4.0%
Cap rate
0.7%
Rent to Value Ratio
Active
$749,000
5
bds
|
4
ba
|
2,266
sqft
|
built
1970
997 Rainbow Trl, Orange, CT 06477
$-1,910
Cash flow
-13.3%
Cash-on-Cash Return
2.6%
Cap rate
0.5%
Rent to Value Ratio
Active
$669,900
3
bds
|
3
ba
|
1,846
sqft
|
built
1965
811 Indian Hill Rd, Orange, CT 06477
$-1,470
Cash flow
-11.4%
Cash-on-Cash Return
3.0%
Cap rate
0.5%
Rent to Value Ratio
Active
$559,900
3
bds
|
3
ba
|
1,392
sqft
|
built
1973
598 High Ridge Rd, Orange, CT 06477
$-1,199
Cash flow
-11.2%
Cash-on-Cash Return
3.1%
Cap rate
0.6%
Rent to Value Ratio
Active
$1,369,000
5
bds
|
5
ba
|
4,493
sqft
|
built
1950
424 Racebrook Rd, Orange, CT 06477
$-5,034
Cash flow
-19.2%
Cash-on-Cash Return
1.3%
Cap rate
0.3%
Rent to Value Ratio
Active
$399,000
2
bds
|
1
ba
|
1,344
sqft
|
built
1930
493 Halliwell Ave, Orange, CT 06477
$-857
Cash flow
-11.2%
Cash-on-Cash Return
3.1%
Cap rate
0.6%
Rent to Value Ratio
Active
$784,900
4
bds
|
4
ba
|
2,894
sqft
|
built
1960
700 Royal Ln, Orange, CT 06477
$-1,903
Cash flow
-12.6%
Cash-on-Cash Return
2.8%
Cap rate
0.5%
Rent to Value Ratio
Active
$649,000
3
bds
|
3
ba
|
1,610
sqft
|
built
1965
325 Pine Tree Dr, Orange, CT 06477
$-1,409
Cash flow
-11.3%
Cash-on-Cash Return
3.1%
Cap rate
0.5%
Rent to Value Ratio
Active
$625,000
4
bds
|
2
ba
|
1,288
sqft
|
built
1964
523 Treat Ln, Orange, CT 06477
$-1,435
Cash flow
-12.0%
Cash-on-Cash Return
2.9%
Cap rate
0.5%
Rent to Value Ratio
Active
$625,000
3
bds
|
2
ba
|
1,802
sqft
|
built
1957
136 Cummings Dr, Orange, CT 06477
$-1,278
Cash flow
-10.7%
Cash-on-Cash Return
3.2%
Cap rate
0.6%
Rent to Value Ratio
Active
$839,900
3
bds
|
4
ba
|
2,759
sqft
|
built
1966
620 S Greenbrier Dr, Orange, CT 06477
$-2,019
Cash flow
-12.5%
Cash-on-Cash Return
2.8%
Cap rate
0.5%
Rent to Value Ratio

Active
$1,545,000
4
bds
|
4
ba
|
3,994
sqft
|
built
1998
24 Brierwood Dr, Orange, CT 06477
$-4,296
Cash flow
-14.5%
Cash-on-Cash Return
2.3%
Cap rate
0.5%
Rent to Value Ratio
Active
$949,900
3
bds
|
3
ba
|
2,970
sqft
|
built
1997
92 Tyler City Rd, Orange, CT 06477
$-2,523
Cash flow
-13.9%
Cash-on-Cash Return
2.5%
Cap rate
0.5%
Rent to Value Ratio