Orange Park, FL Investment Properties for Sale
Browse homes for sale and investment properties in Orange Park, FL. Refine your search by price, property type, or more.
Best cash flowing properties in Orange Park, FL

Active
$225,000
3
bds
|
3
ba
|
1,500
sqft
|
built
2013
2754 Hollybrook Ln, Orange Park, FL 32073
$-253
Cash flow
-5.9%
Cash-on-Cash Return
4.8%
Cap rate
0.8%
Rent to Value Ratio
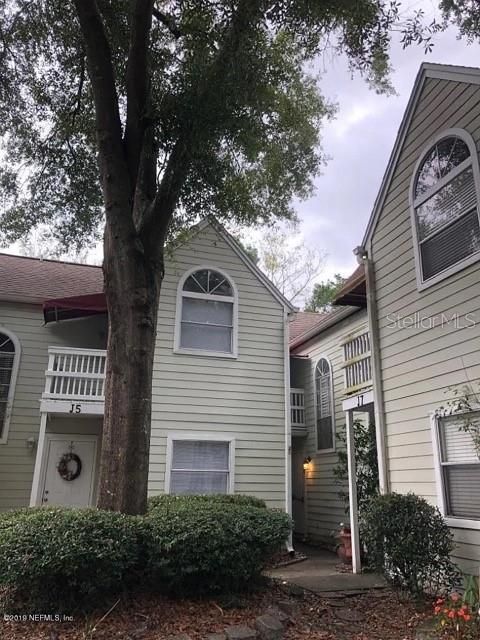
Active
$169,900
2
bds
|
2
ba
|
1,104
sqft
|
built
1988
2300 Twelve Oaks Dr, Orange Park, FL 32065
$-303
Cash flow
-9.3%
Cash-on-Cash Return
4.0%
Cap rate
0.8%
Rent to Value Ratio
19 out of 278 properties for sale in Orange Park, FL
Limited Results Shown
Create a free account, or log in to reveal all property listings and enjoy the complete experience.
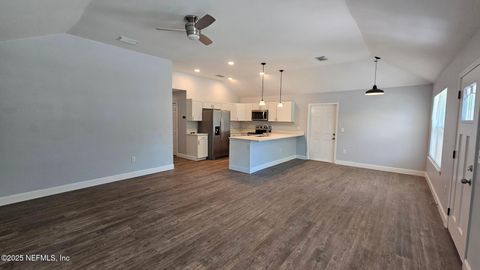
Active
$339,500
3
bds
|
2
ba
|
1,587
sqft
|
built
2022
1978 Solomon St, Orange Park, FL 32073
$-684
Cash flow
-10.5%
Cash-on-Cash Return
3.7%
Cap rate
0.6%
Rent to Value Ratio

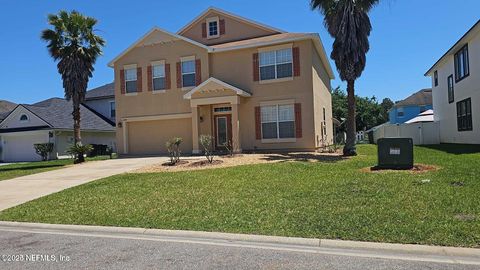
Active
$376,900
4
bds
|
3
ba
|
2,566
sqft
|
built
2003
222 Dover Bluff Dr, Orange Park, FL 32073
$-418
Cash flow
-5.8%
Cash-on-Cash Return
4.8%
Cap rate
0.7%
Rent to Value Ratio
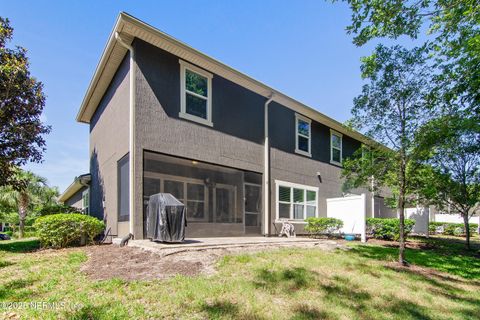
Active
$387,000
5
bds
|
3
ba
|
2,766
sqft
|
built
2007
2727 Wood Stork Trl, Orange Park, FL 32073
$-724
Cash flow
-9.8%
Cash-on-Cash Return
3.9%
Cap rate
0.6%
Rent to Value Ratio
Active
$279,000
3
bds
|
3
ba
|
1,634
sqft
|
built
2017
3268 Chestnut Ridge Way, Orange Park, FL 32065
$-599
Cash flow
-11.2%
Cash-on-Cash Return
3.6%
Cap rate
0.7%
Rent to Value Ratio

Active
$335,000
3
bds
|
2
ba
|
1,757
sqft
|
built
1985
2396 Stonebridge Dr, Orange Park, FL 32065
$-362
Cash flow
-5.6%
Cash-on-Cash Return
4.9%
Cap rate
0.7%
Rent to Value Ratio
Active
$483,900
4
bds
|
4
ba
|
2,550
sqft
|
built
1987
668 Fingal Dr, Orange Park, FL 32073
$-1,503
Cash flow
-16.2%
Cash-on-Cash Return
2.4%
Cap rate
0.5%
Rent to Value Ratio

Active
$465,000
5
bds
|
5
ba
|
3,352
sqft
|
built
2005
529 Amberwood Ct, Orange Park, FL 32065
$-857
Cash flow
-9.6%
Cash-on-Cash Return
3.9%
Cap rate
0.6%
Rent to Value Ratio

Active
$174,900
3
bds
|
3
ba
|
1,343
sqft
|
built
1982
503 Kettering Way, Orange Park, FL 32073
$-386
Cash flow
-11.5%
Cash-on-Cash Return
3.5%
Cap rate
0.9%
Rent to Value Ratio
Active
$498,200
5
bds
|
3
ba
|
3,622
sqft
|
built
2005
2622 Kermit Ct, Orange Park, FL 32065
$-680
Cash flow
-7.1%
Cash-on-Cash Return
4.5%
Cap rate
0.6%
Rent to Value Ratio
Active
$495,000
3
bds
|
3
ba
|
1,950
sqft
|
built
1973
2199 Astor St, Orange Park, FL 32073
$-2,274
Cash flow
-24.0%
Cash-on-Cash Return
0.6%
Cap rate
0.5%
Rent to Value Ratio
Active
$459,900
4
bds
|
4
ba
|
3,003
sqft
|
built
2003
854 Wilmington Ln, Orange Park, FL 32065
$-1,086
Cash flow
-12.3%
Cash-on-Cash Return
3.3%
Cap rate
0.6%
Rent to Value Ratio

Active
$329,999
4
bds
|
2
ba
|
1,998
sqft
|
built
1973
2807 Paces Ferry Rd S, Orange Park, FL 32073
$-460
Cash flow
-7.3%
Cash-on-Cash Return
4.5%
Cap rate
0.7%
Rent to Value Ratio

Active
$539,900
5
bds
|
4
ba
|
3,231
sqft
|
built
2012
4484 Gray Hawk St, Orange Park, FL 32065
$-860
Cash flow
-8.3%
Cash-on-Cash Return
4.2%
Cap rate
0.6%
Rent to Value Ratio
Active
$339,900
5
bds
|
3
ba
|
2,159
sqft
|
built
2015
499 Deercroft Ln, Orange Park, FL 32065
$-630
Cash flow
-9.7%
Cash-on-Cash Return
3.9%
Cap rate
0.7%
Rent to Value Ratio
Active
$199,500
4
bds
|
2
ba
|
1,690
sqft
|
built
2006
785 Oakleaf Plantation Pkwy, Orange Park, FL 32065
$-615
Cash flow
-16.1%
Cash-on-Cash Return
2.4%
Cap rate
0.9%
Rent to Value Ratio
Active
$625,000
4
bds
|
4
ba
|
3,391
sqft
|
built
2016
4411 Vista Point Ln, Orange Park, FL 32065
$-793
Cash flow
-6.6%
Cash-on-Cash Return
4.6%
Cap rate
0.6%
Rent to Value Ratio
Active
$475,000
5
bds
|
3
ba
|
3,601
sqft
|
built
2003
3117 Hearthstone Ln, Orange Park, FL 32065
$-616
Cash flow
-6.8%
Cash-on-Cash Return
4.6%
Cap rate
0.7%
Rent to Value Ratio