Oriental, NC Investment Properties for Sale
Browse homes for sale and investment properties in Oriental, NC. Refine your search by price, property type, or more.
Best cash flowing properties in Oriental, NC
Active
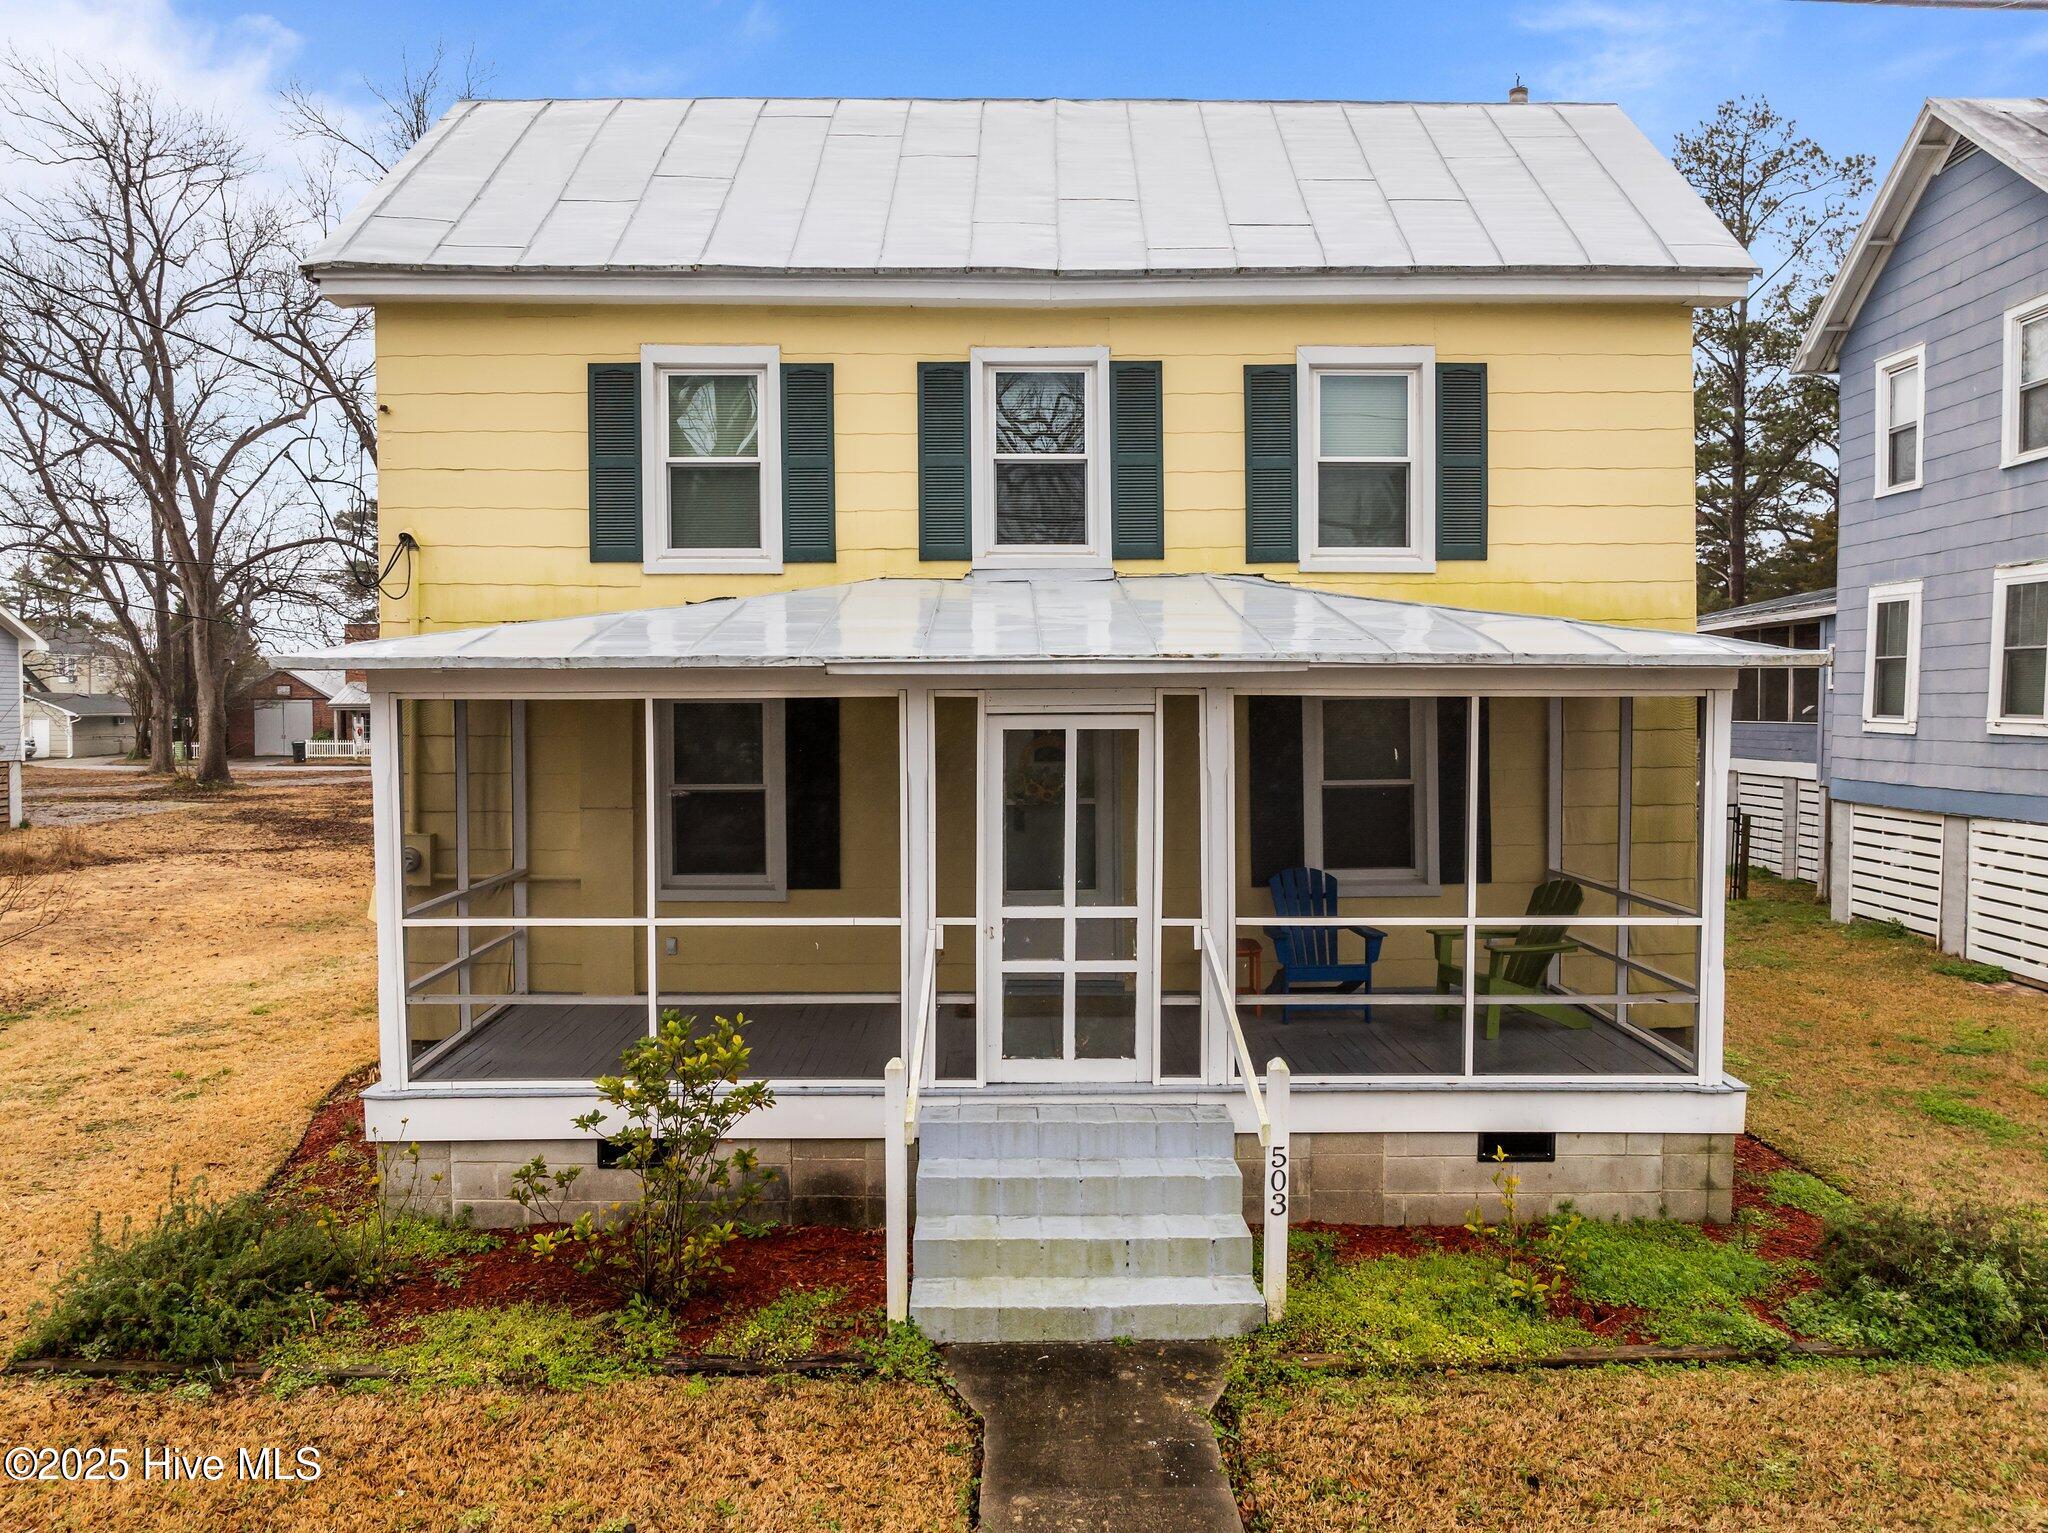
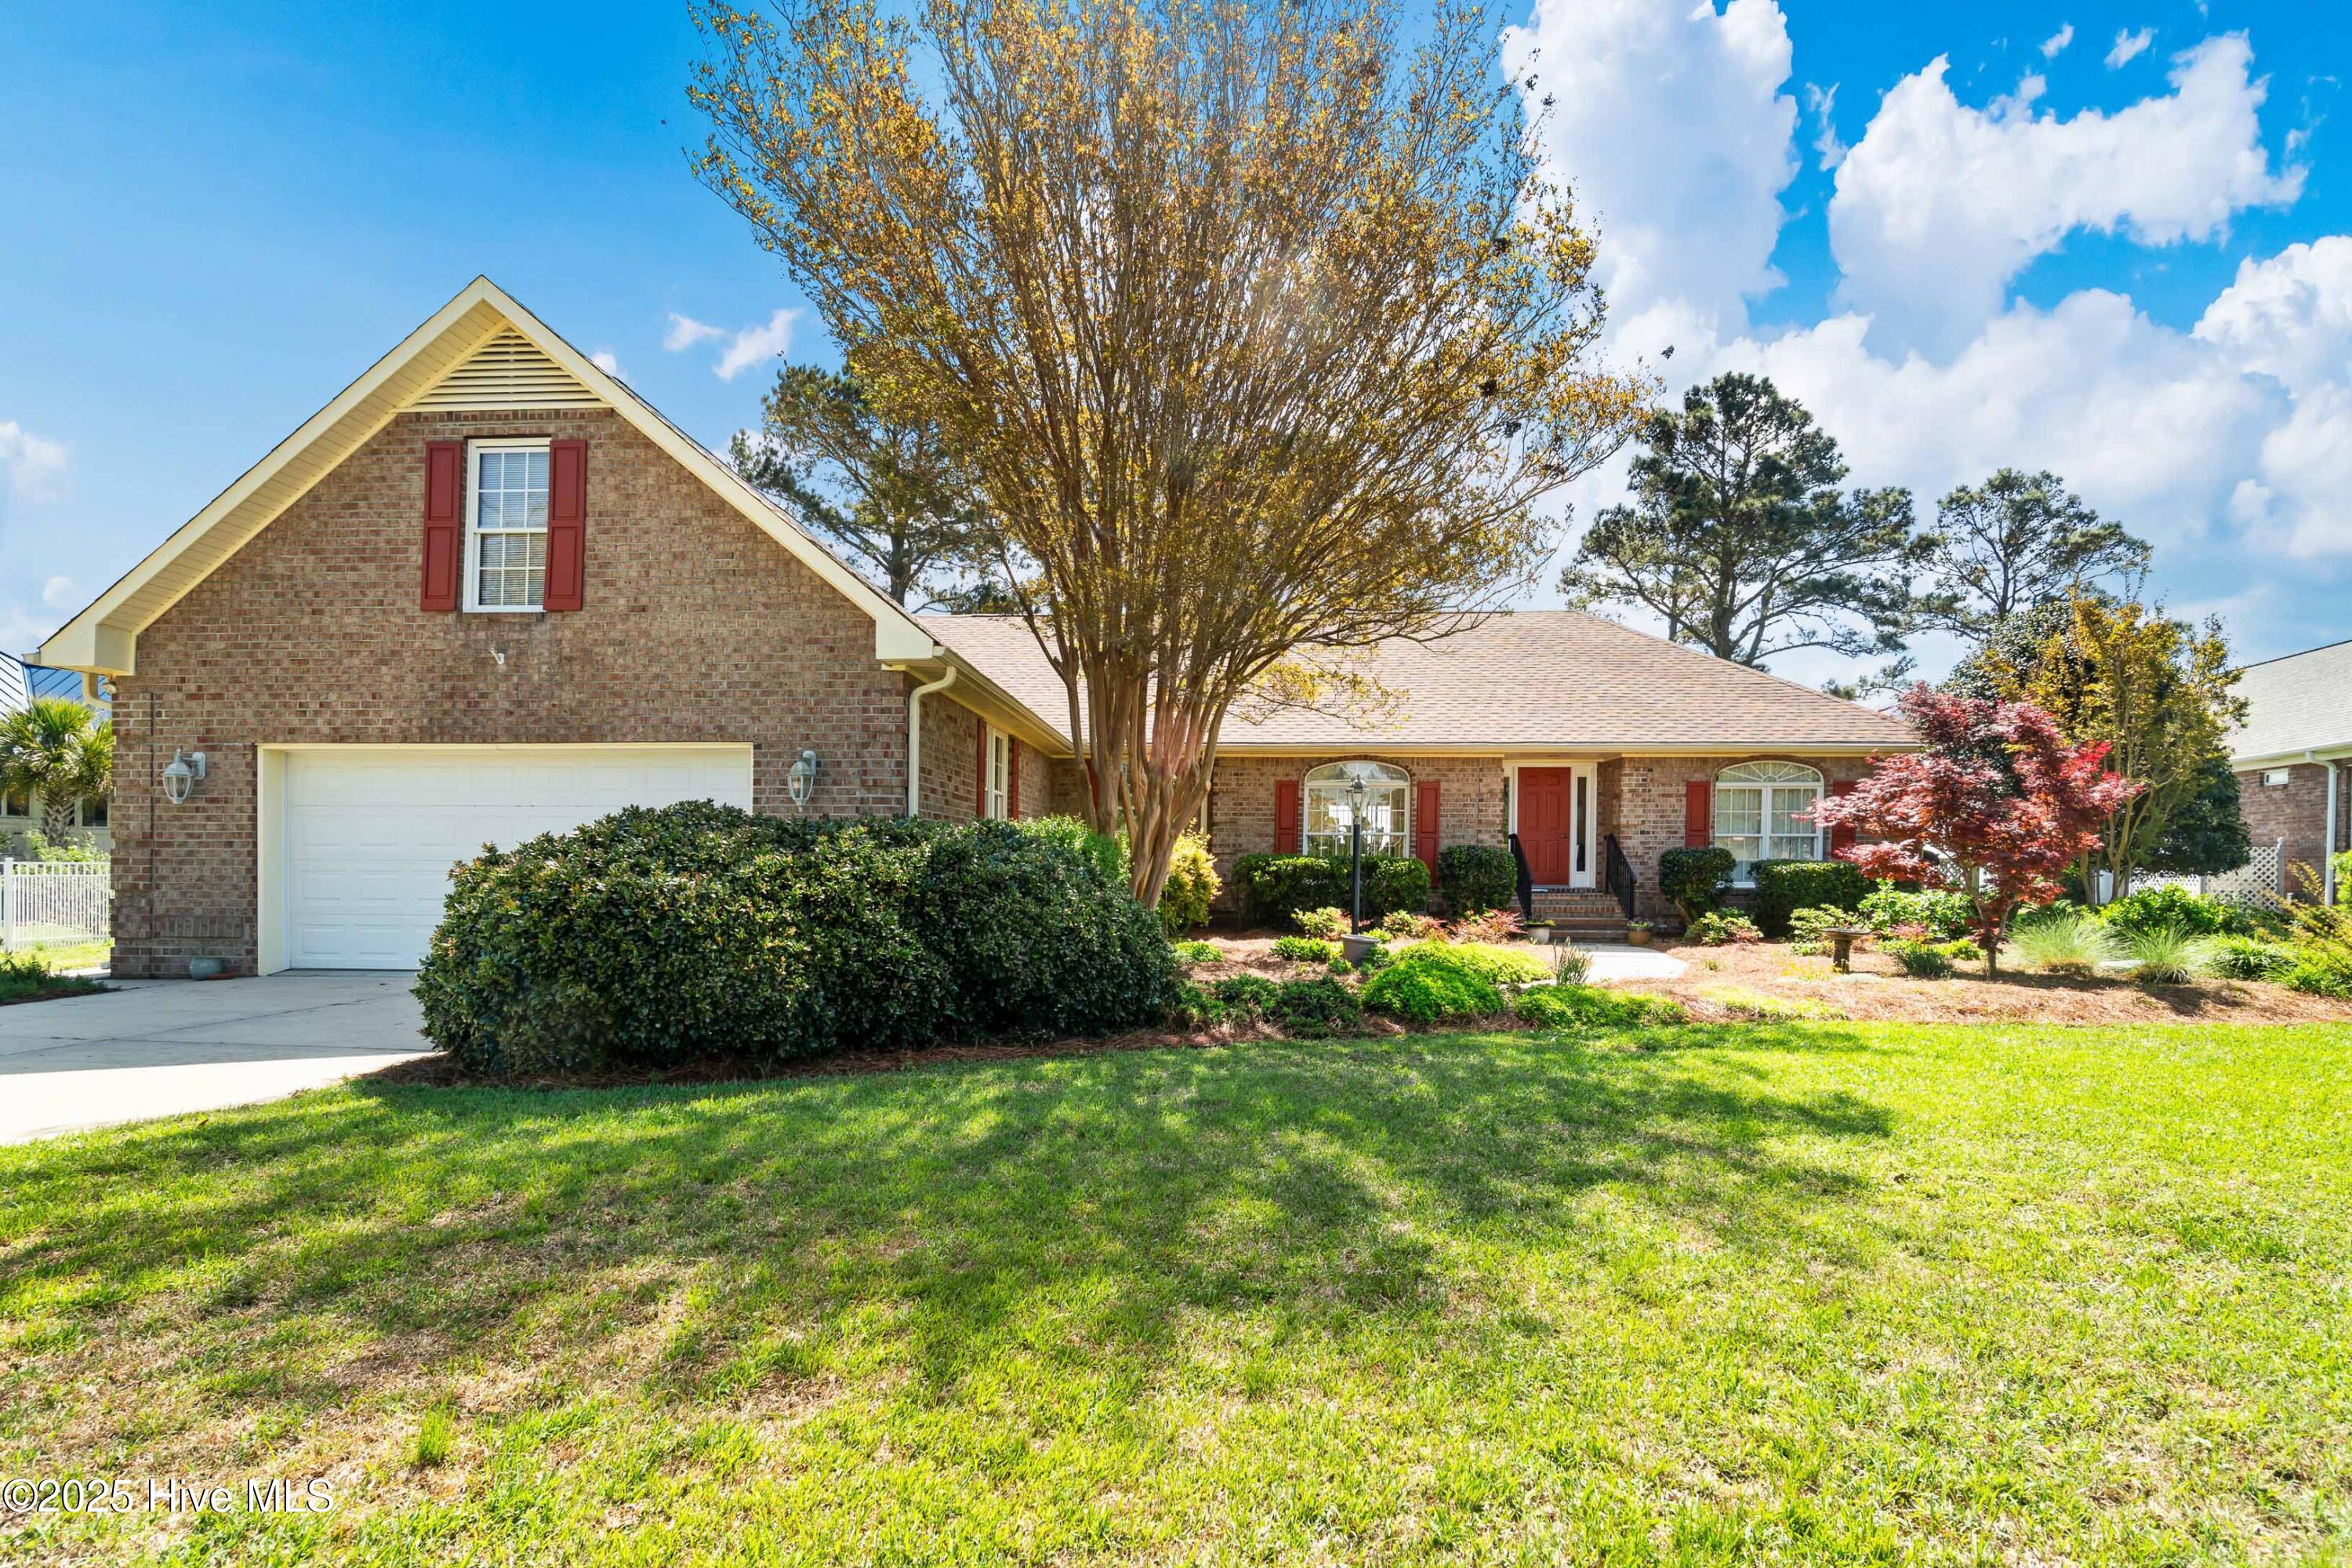
$275,000
3
bds
|
1
ba
|
1,171
sqft
|
built
1904
503 Hodges St, Oriental, NC 28571
$-292
Cash flow
-5.5%
Cash-on-Cash Return
5.0%
Cap rate
0.7%
Rent to Value Ratio

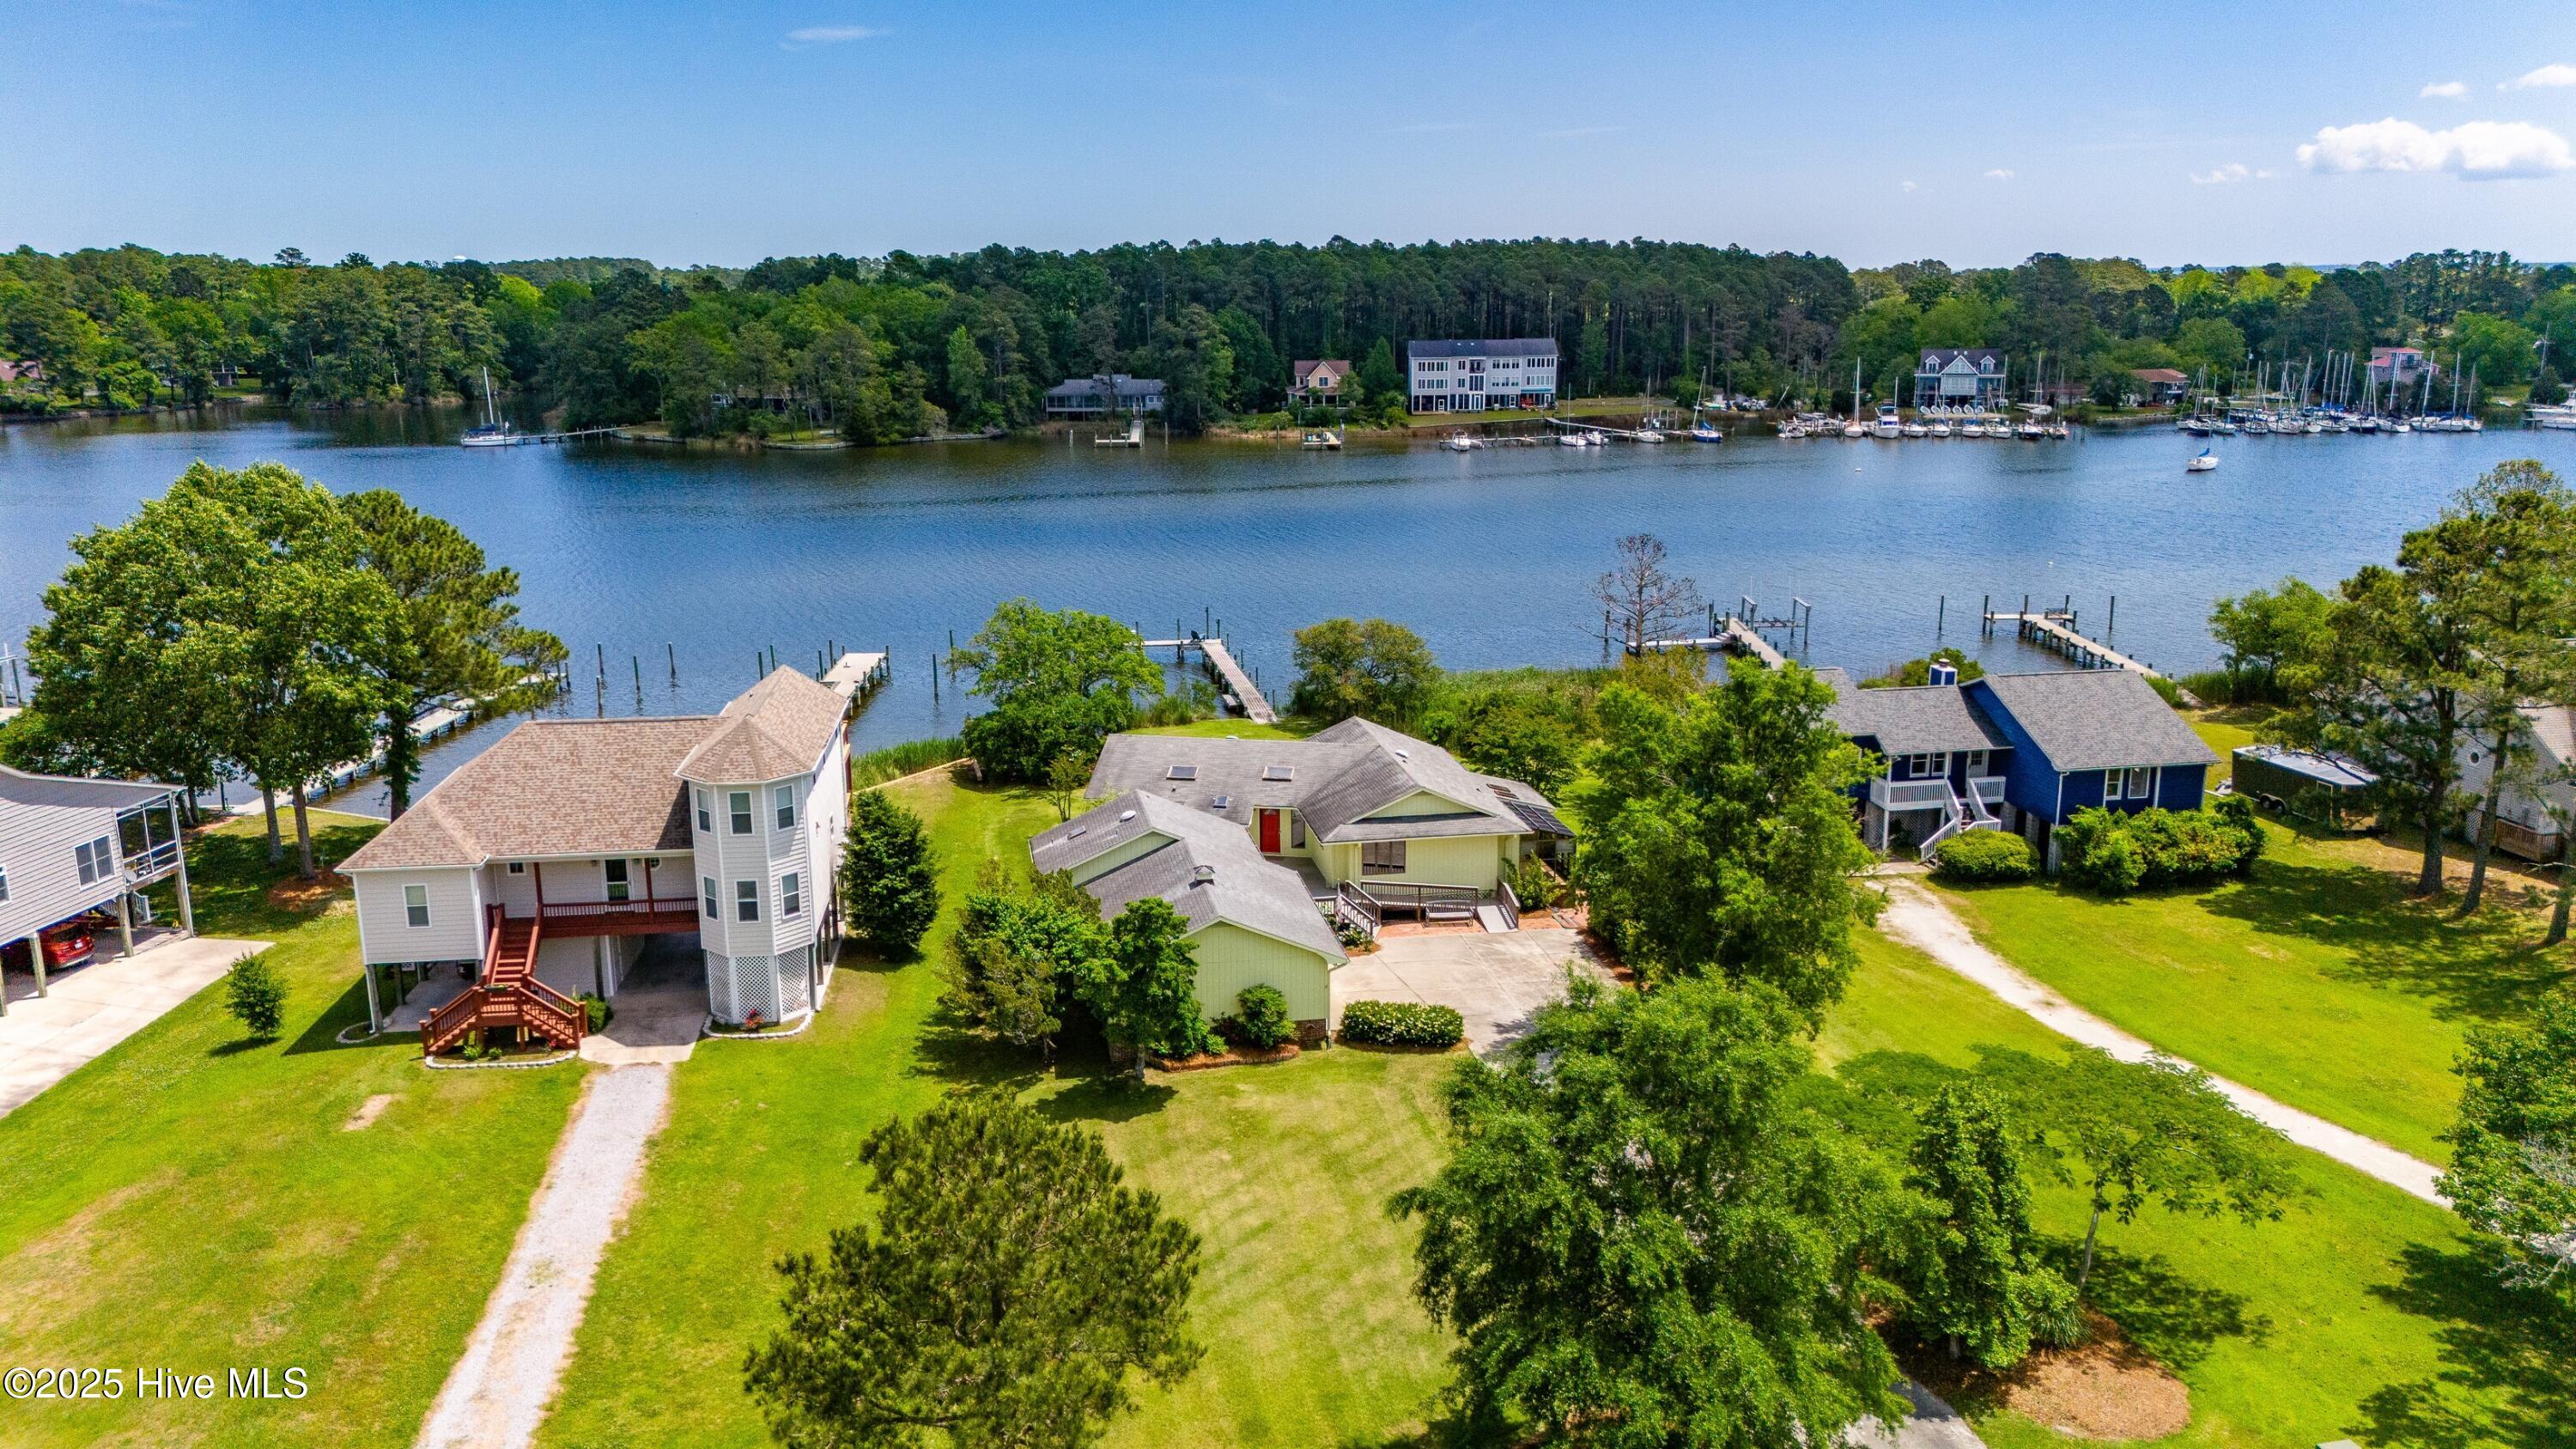
Active
$395,000
3
bds
|
2
ba
|
1,842
sqft
|
built
2023
615 Windward Dr, Oriental, NC 28571
$-415
Cash flow
-5.5%
Cash-on-Cash Return
5.0%
Cap rate
0.6%
Rent to Value Ratio
30 out of 52 properties for sale in Oriental, NC
Limited Results Shown
Create a free account, or log in to reveal all property listings and enjoy the complete experience.
Active
$525,000
2
bds
|
3
ba
|
2,120
sqft
|
built
1983
9203 Hornigold Ave, Oriental, NC 28571
$-975
Cash flow
-9.7%
Cash-on-Cash Return
4.1%
Cap rate
0.5%
Rent to Value Ratio
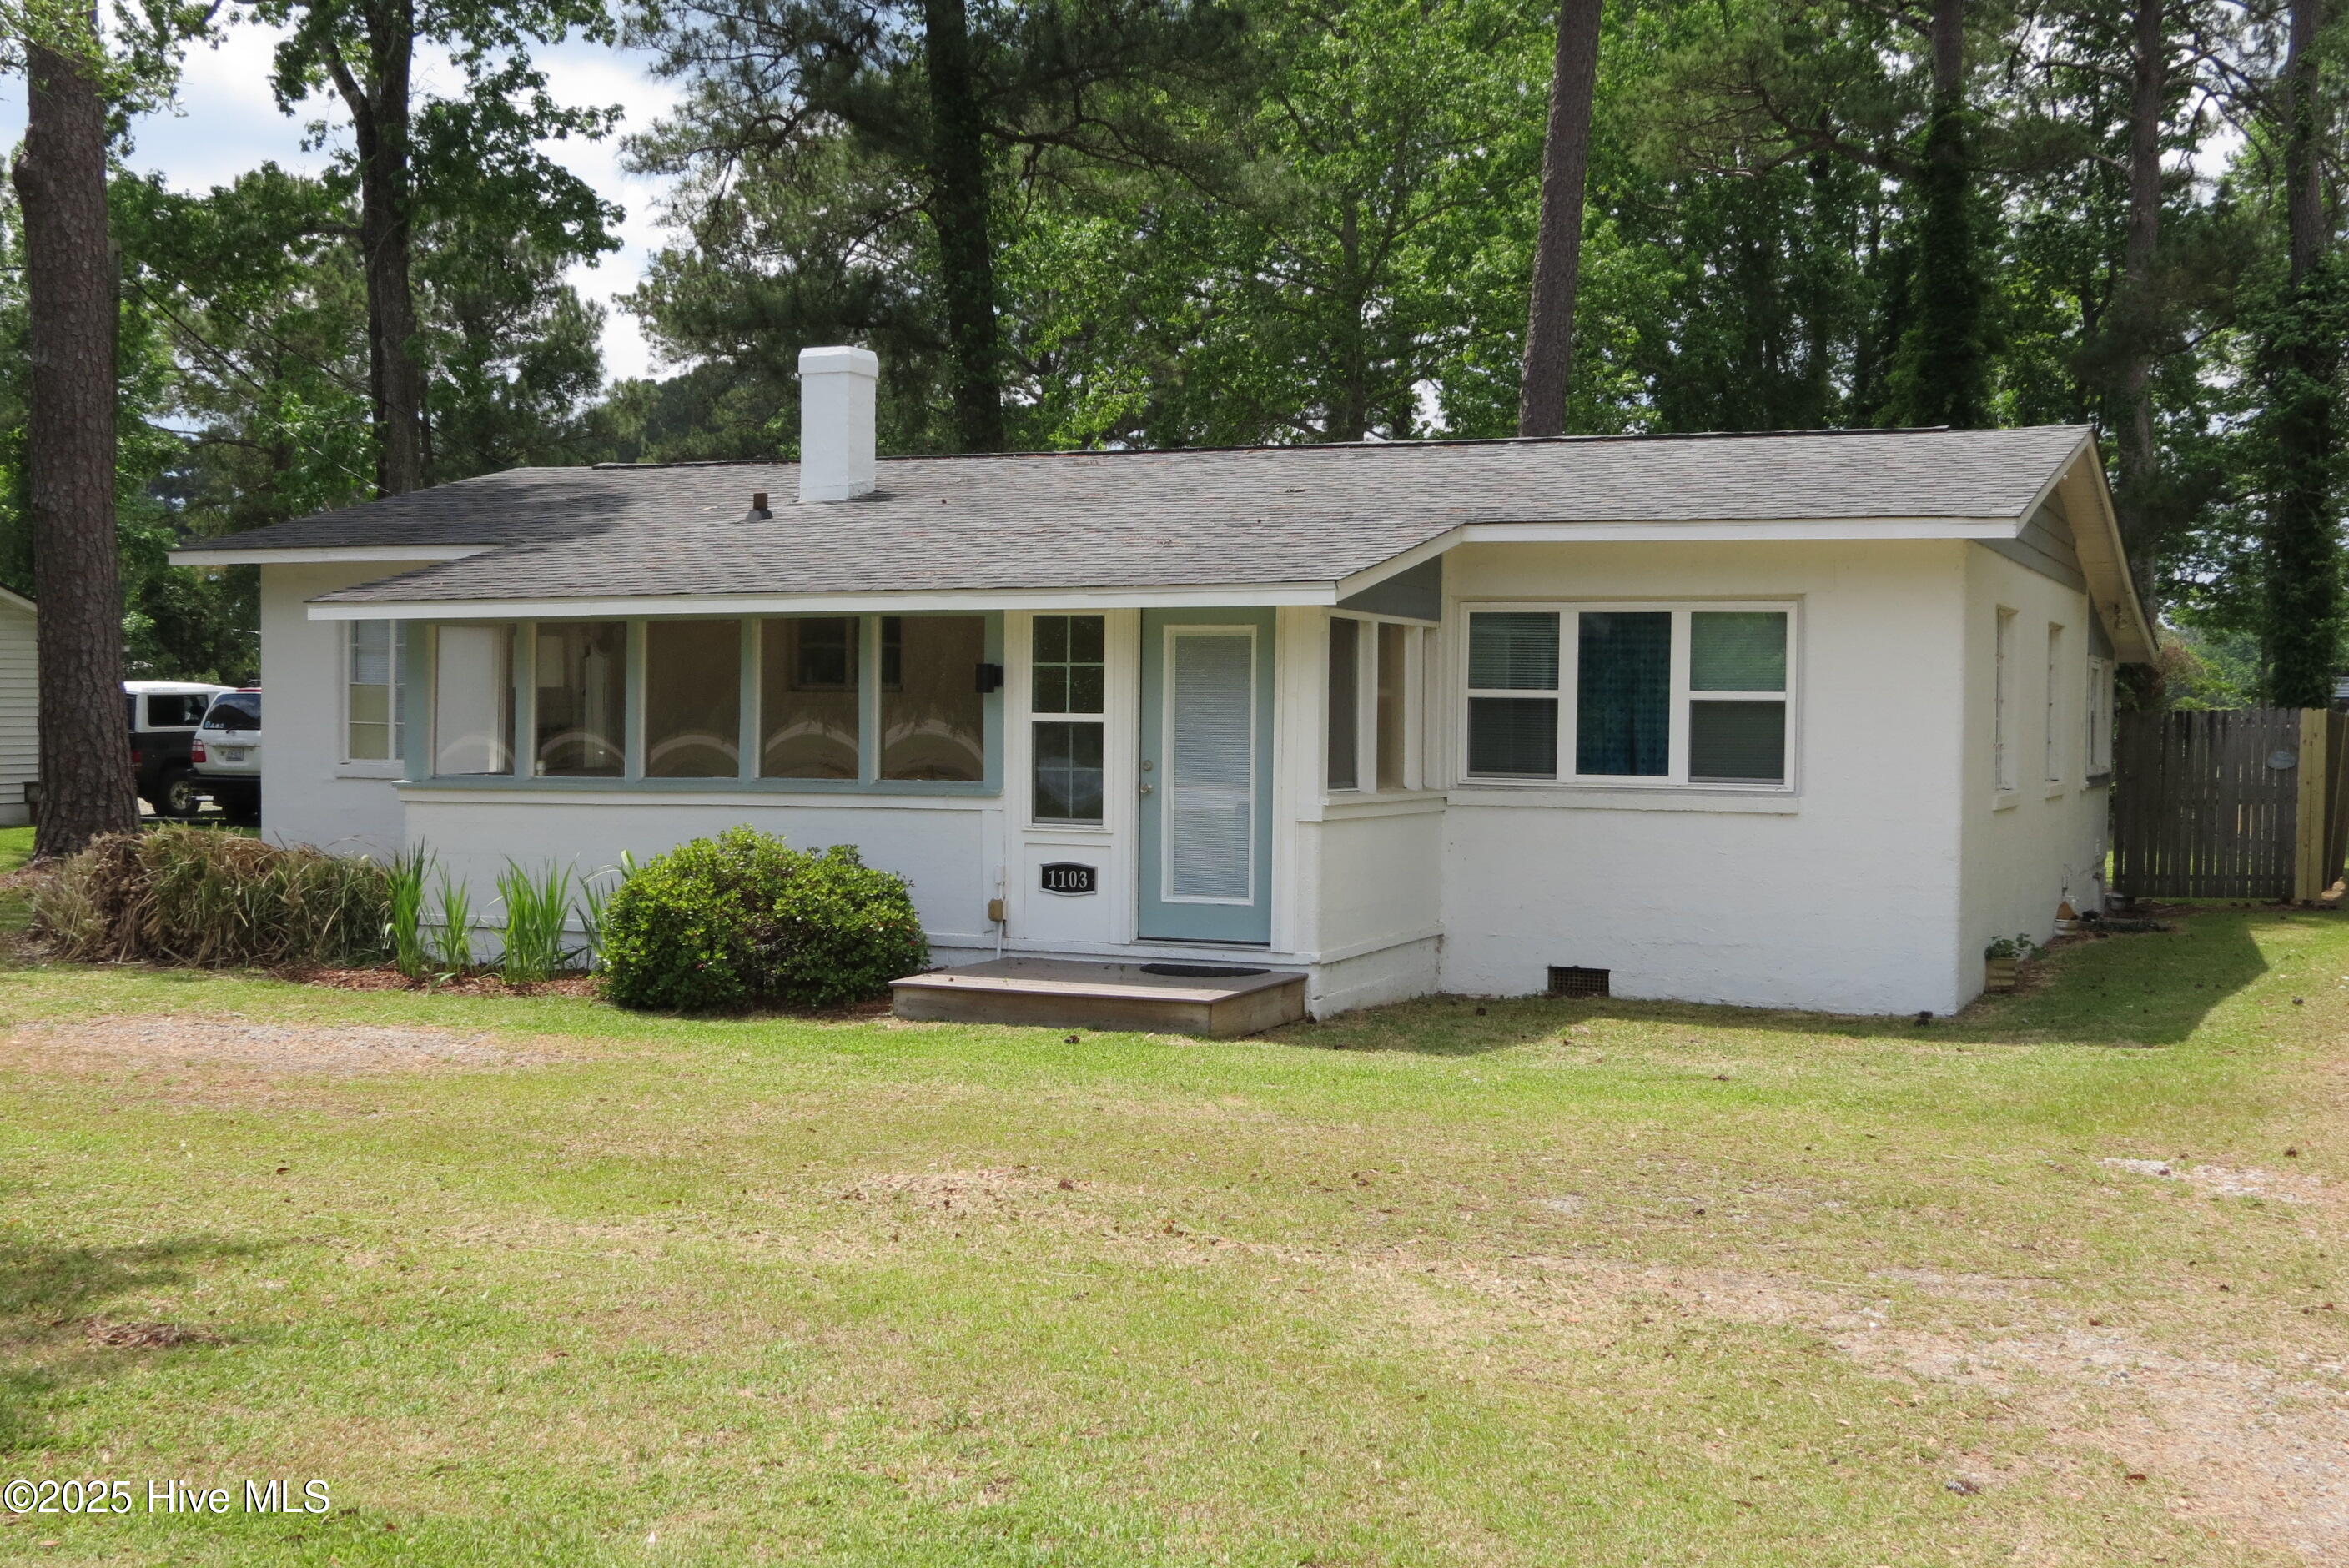
Active
$325,000
3
bds
|
1
ba
|
1,331
sqft
|
built
1954
1103 Broad Street Ext, Oriental, NC 28571
$-802
Cash flow
-12.9%
Cash-on-Cash Return
3.3%
Cap rate
0.4%
Rent to Value Ratio
Pending
$640,000
2
bds
|
2
ba
|
1,519
sqft
|
built
1994
610 Windward Dr, Oriental, NC 28571
$-1,630
Cash flow
-13.3%
Cash-on-Cash Return
3.2%
Cap rate
0.4%
Rent to Value Ratio
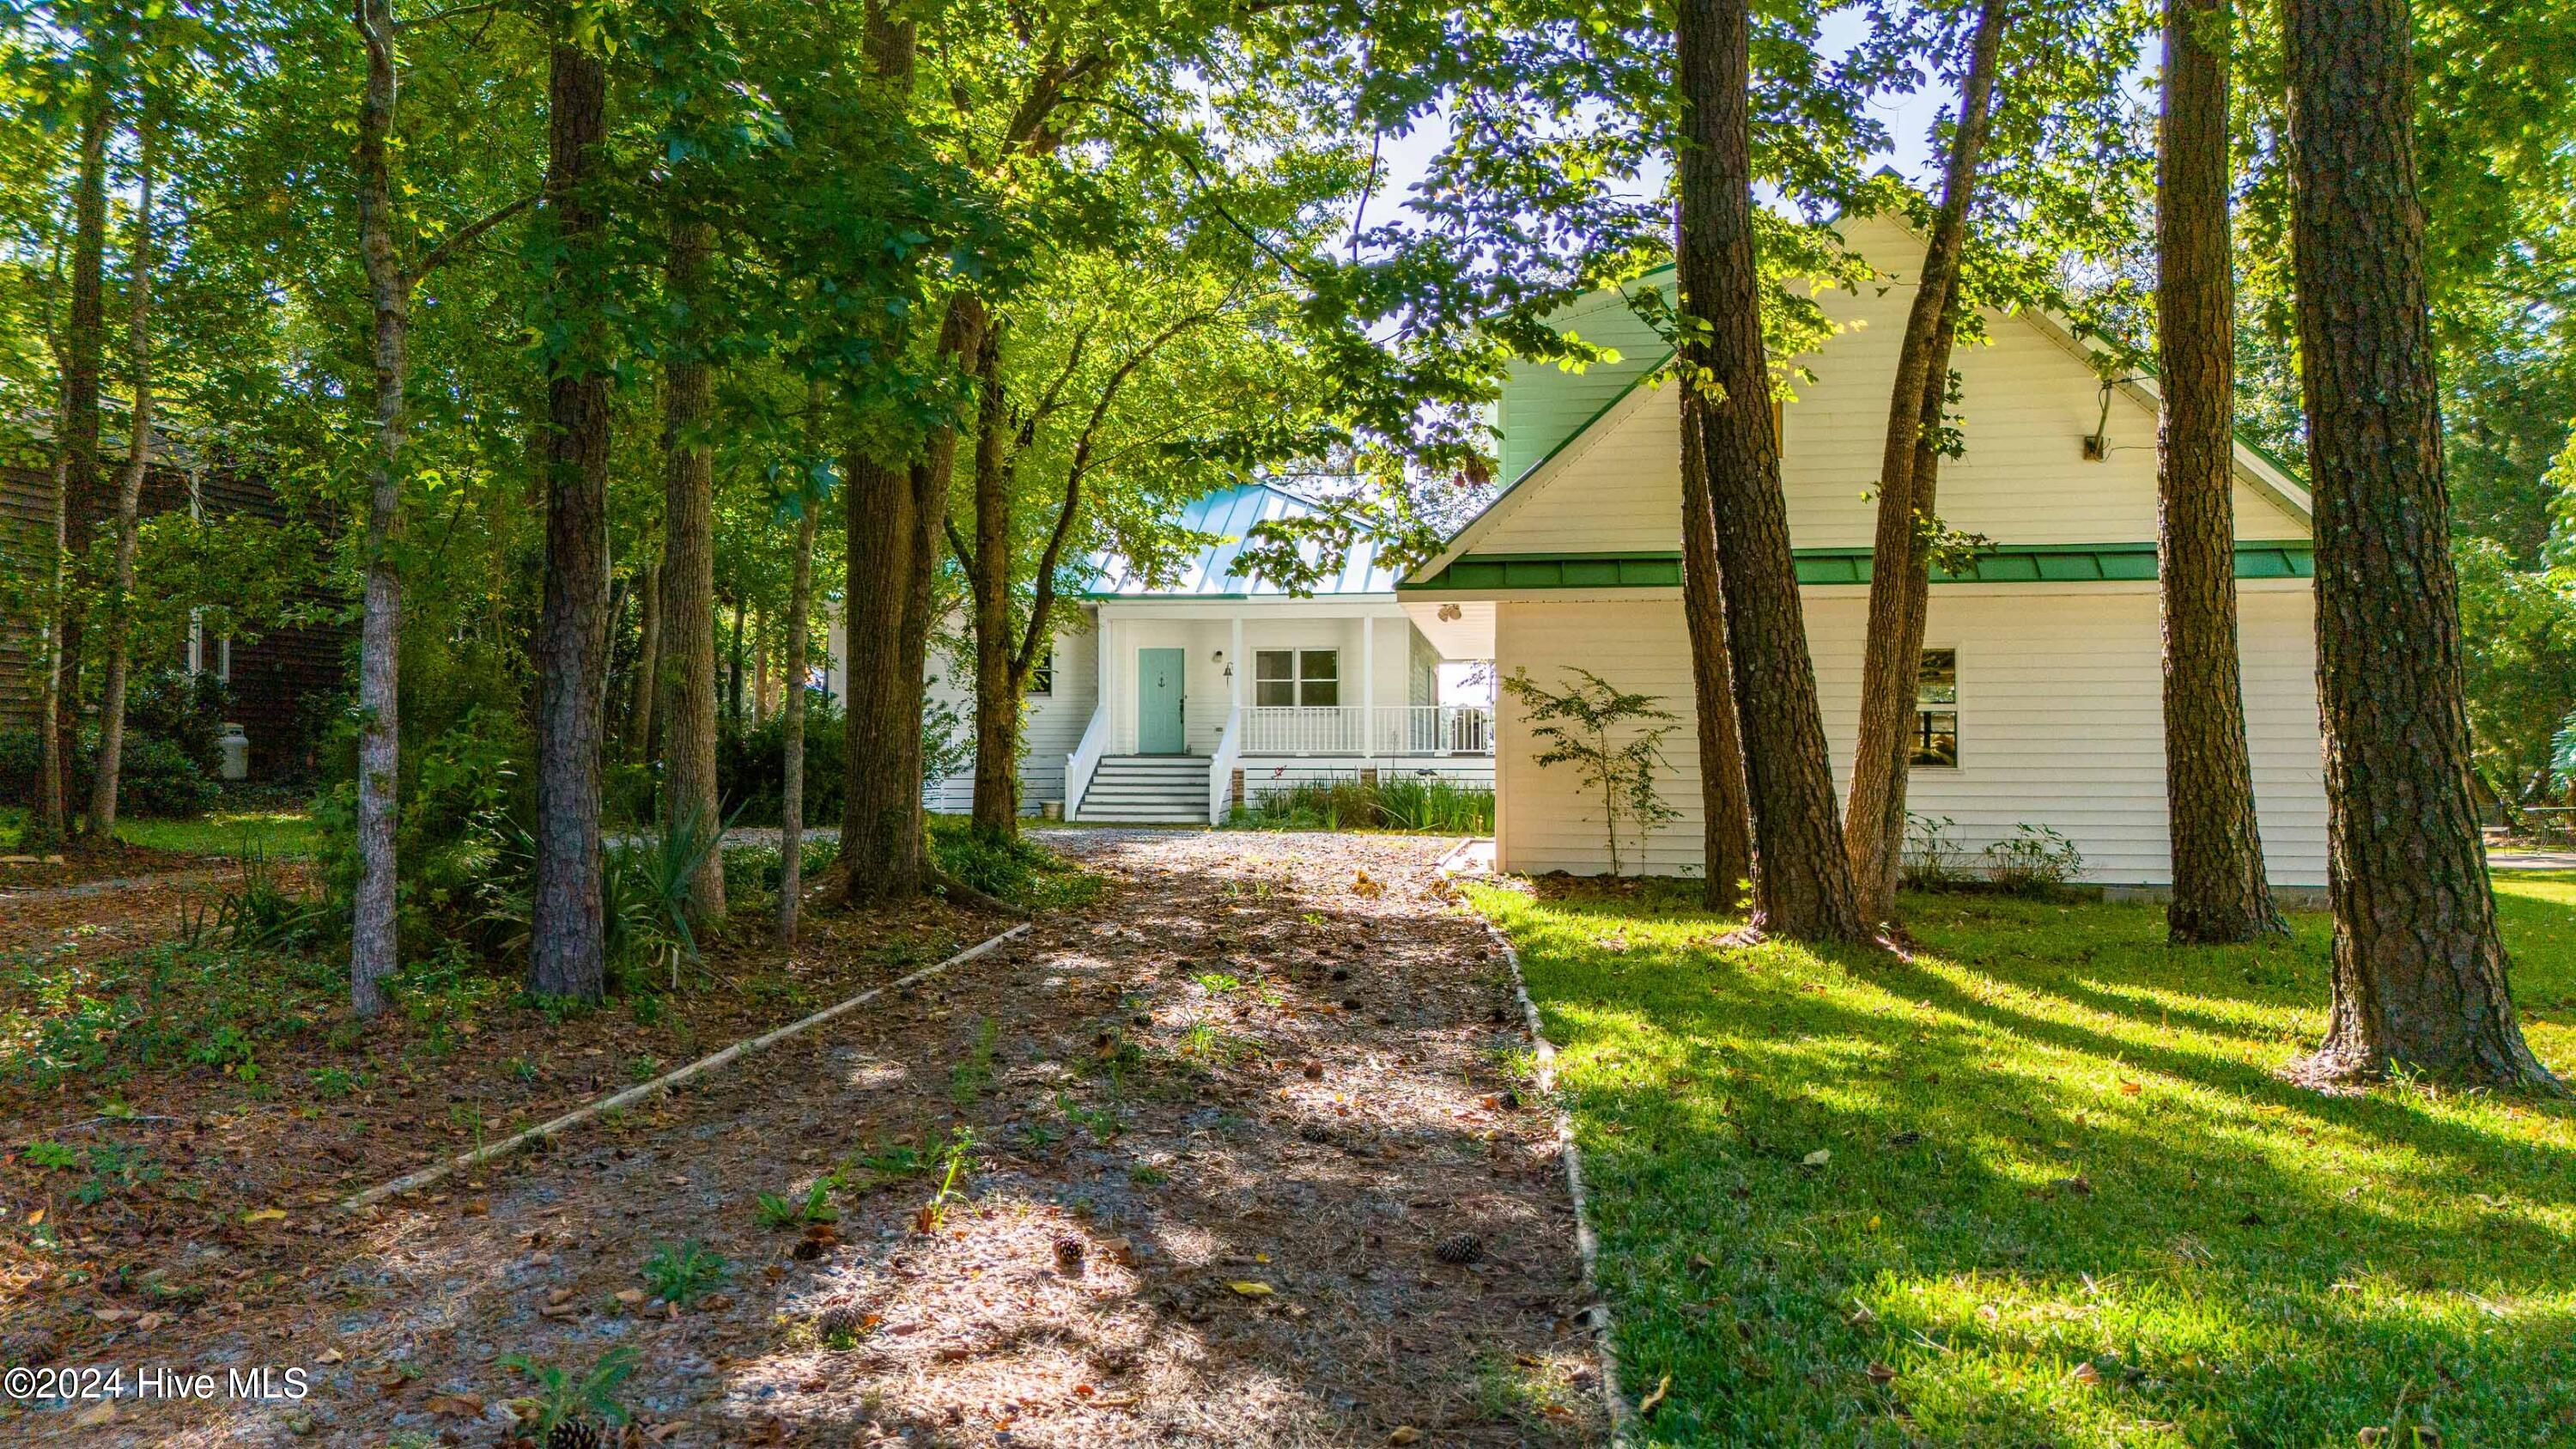
Active
$625,000
3
bds
|
3
ba
|
1,831
sqft
|
built
2016
61 Spinnaker Point Rd, Oriental, NC 28571
$-1,568
Cash flow
-13.1%
Cash-on-Cash Return
3.3%
Cap rate
0.4%
Rent to Value Ratio
Active
$1,750,000
3
bds
|
5
ba
|
2,834
sqft
|
built
2023
628 E Harborside Rd, Oriental, NC 28571
$-6,919
Cash flow
-20.6%
Cash-on-Cash Return
1.5%
Cap rate
0.2%
Rent to Value Ratio
Active
$1,599,900
4
bds
|
4
ba
|
3,676
sqft
|
built
2022
400 South Ave, Oriental, NC 28571
$-6,593
Cash flow
-21.5%
Cash-on-Cash Return
1.3%
Cap rate
0.2%
Rent to Value Ratio
Active
$415,000
3
bds
|
2
ba
|
2,006
sqft
|
built
2007
7208 Brigantine Blvd, Oriental, NC 28571
$-715
Cash flow
-9.0%
Cash-on-Cash Return
4.2%
Cap rate
0.6%
Rent to Value Ratio
Active
$449,000
2
bds
|
3
ba
|
1,684
sqft
|
built
2023
82 Back Cove Cir, Oriental, NC 28571
$-1,372
Cash flow
-15.9%
Cash-on-Cash Return
2.6%
Cap rate
0.4%
Rent to Value Ratio
Active
$961,000
4
bds
|
3
ba
|
2,649
sqft
|
built
2010
3009 Maritime Dr, Oriental, NC 28571
$-3,231
Cash flow
-17.5%
Cash-on-Cash Return
2.3%
Cap rate
0.3%
Rent to Value Ratio
Active
$730,000
3
bds
|
2
ba
|
2,710
sqft
|
built
1997
52 Shore Dr E, Oriental, NC 28571
$-1,923
Cash flow
-13.7%
Cash-on-Cash Return
3.1%
Cap rate
0.4%
Rent to Value Ratio
Active
$910,000
3
bds
|
3
ba
|
2,430
sqft
|
built
2006
385 Peninsula Dr, Oriental, NC 28571
$-3,214
Cash flow
-18.4%
Cash-on-Cash Return
2.1%
Cap rate
0.3%
Rent to Value Ratio
Active
$850,000
3
bds
|
2
ba
|
2,679
sqft
|
built
1997
6042 Dolphin Rd, Oriental, NC 28571
$-2,468
Cash flow
-15.1%
Cash-on-Cash Return
2.8%
Cap rate
0.3%
Rent to Value Ratio

Pending
$575,000
3
bds
|
2
ba
|
1,740
sqft
|
built
1994
288 Spicers Creek Dr, Oriental, NC 28571
$-1,667
Cash flow
-15.1%
Cash-on-Cash Return
2.8%
Cap rate
0.4%
Rent to Value Ratio

Active
$1,190,000
3
bds
|
2
ba
|
1,825
sqft
|
built
1965
1112 Neuse Dr, Oriental, NC 28571
$-4,840
Cash flow
-21.2%
Cash-on-Cash Return
1.4%
Cap rate
0.2%
Rent to Value Ratio

Active
$399,000
2
bds
|
2
ba
|
796
sqft
|
built
2017
5 Back Cove Cir, Oriental, NC 28571
$-1,059
Cash flow
-13.8%
Cash-on-Cash Return
3.1%
Cap rate
0.5%
Rent to Value Ratio
Active
$640,000
3
bds
|
2
ba
|
2,271
sqft
|
built
1924
205 High St, Oriental, NC 28571
$-1,768
Cash flow
-14.4%
Cash-on-Cash Return
3.0%
Cap rate
0.4%
Rent to Value Ratio

Active
$649,000
3
bds
|
3
ba
|
2,190
sqft
|
built
2019
56 Boathouse Rd, Oriental, NC 28571
$-1,683
Cash flow
-13.5%
Cash-on-Cash Return
3.2%
Cap rate
0.5%
Rent to Value Ratio
Active
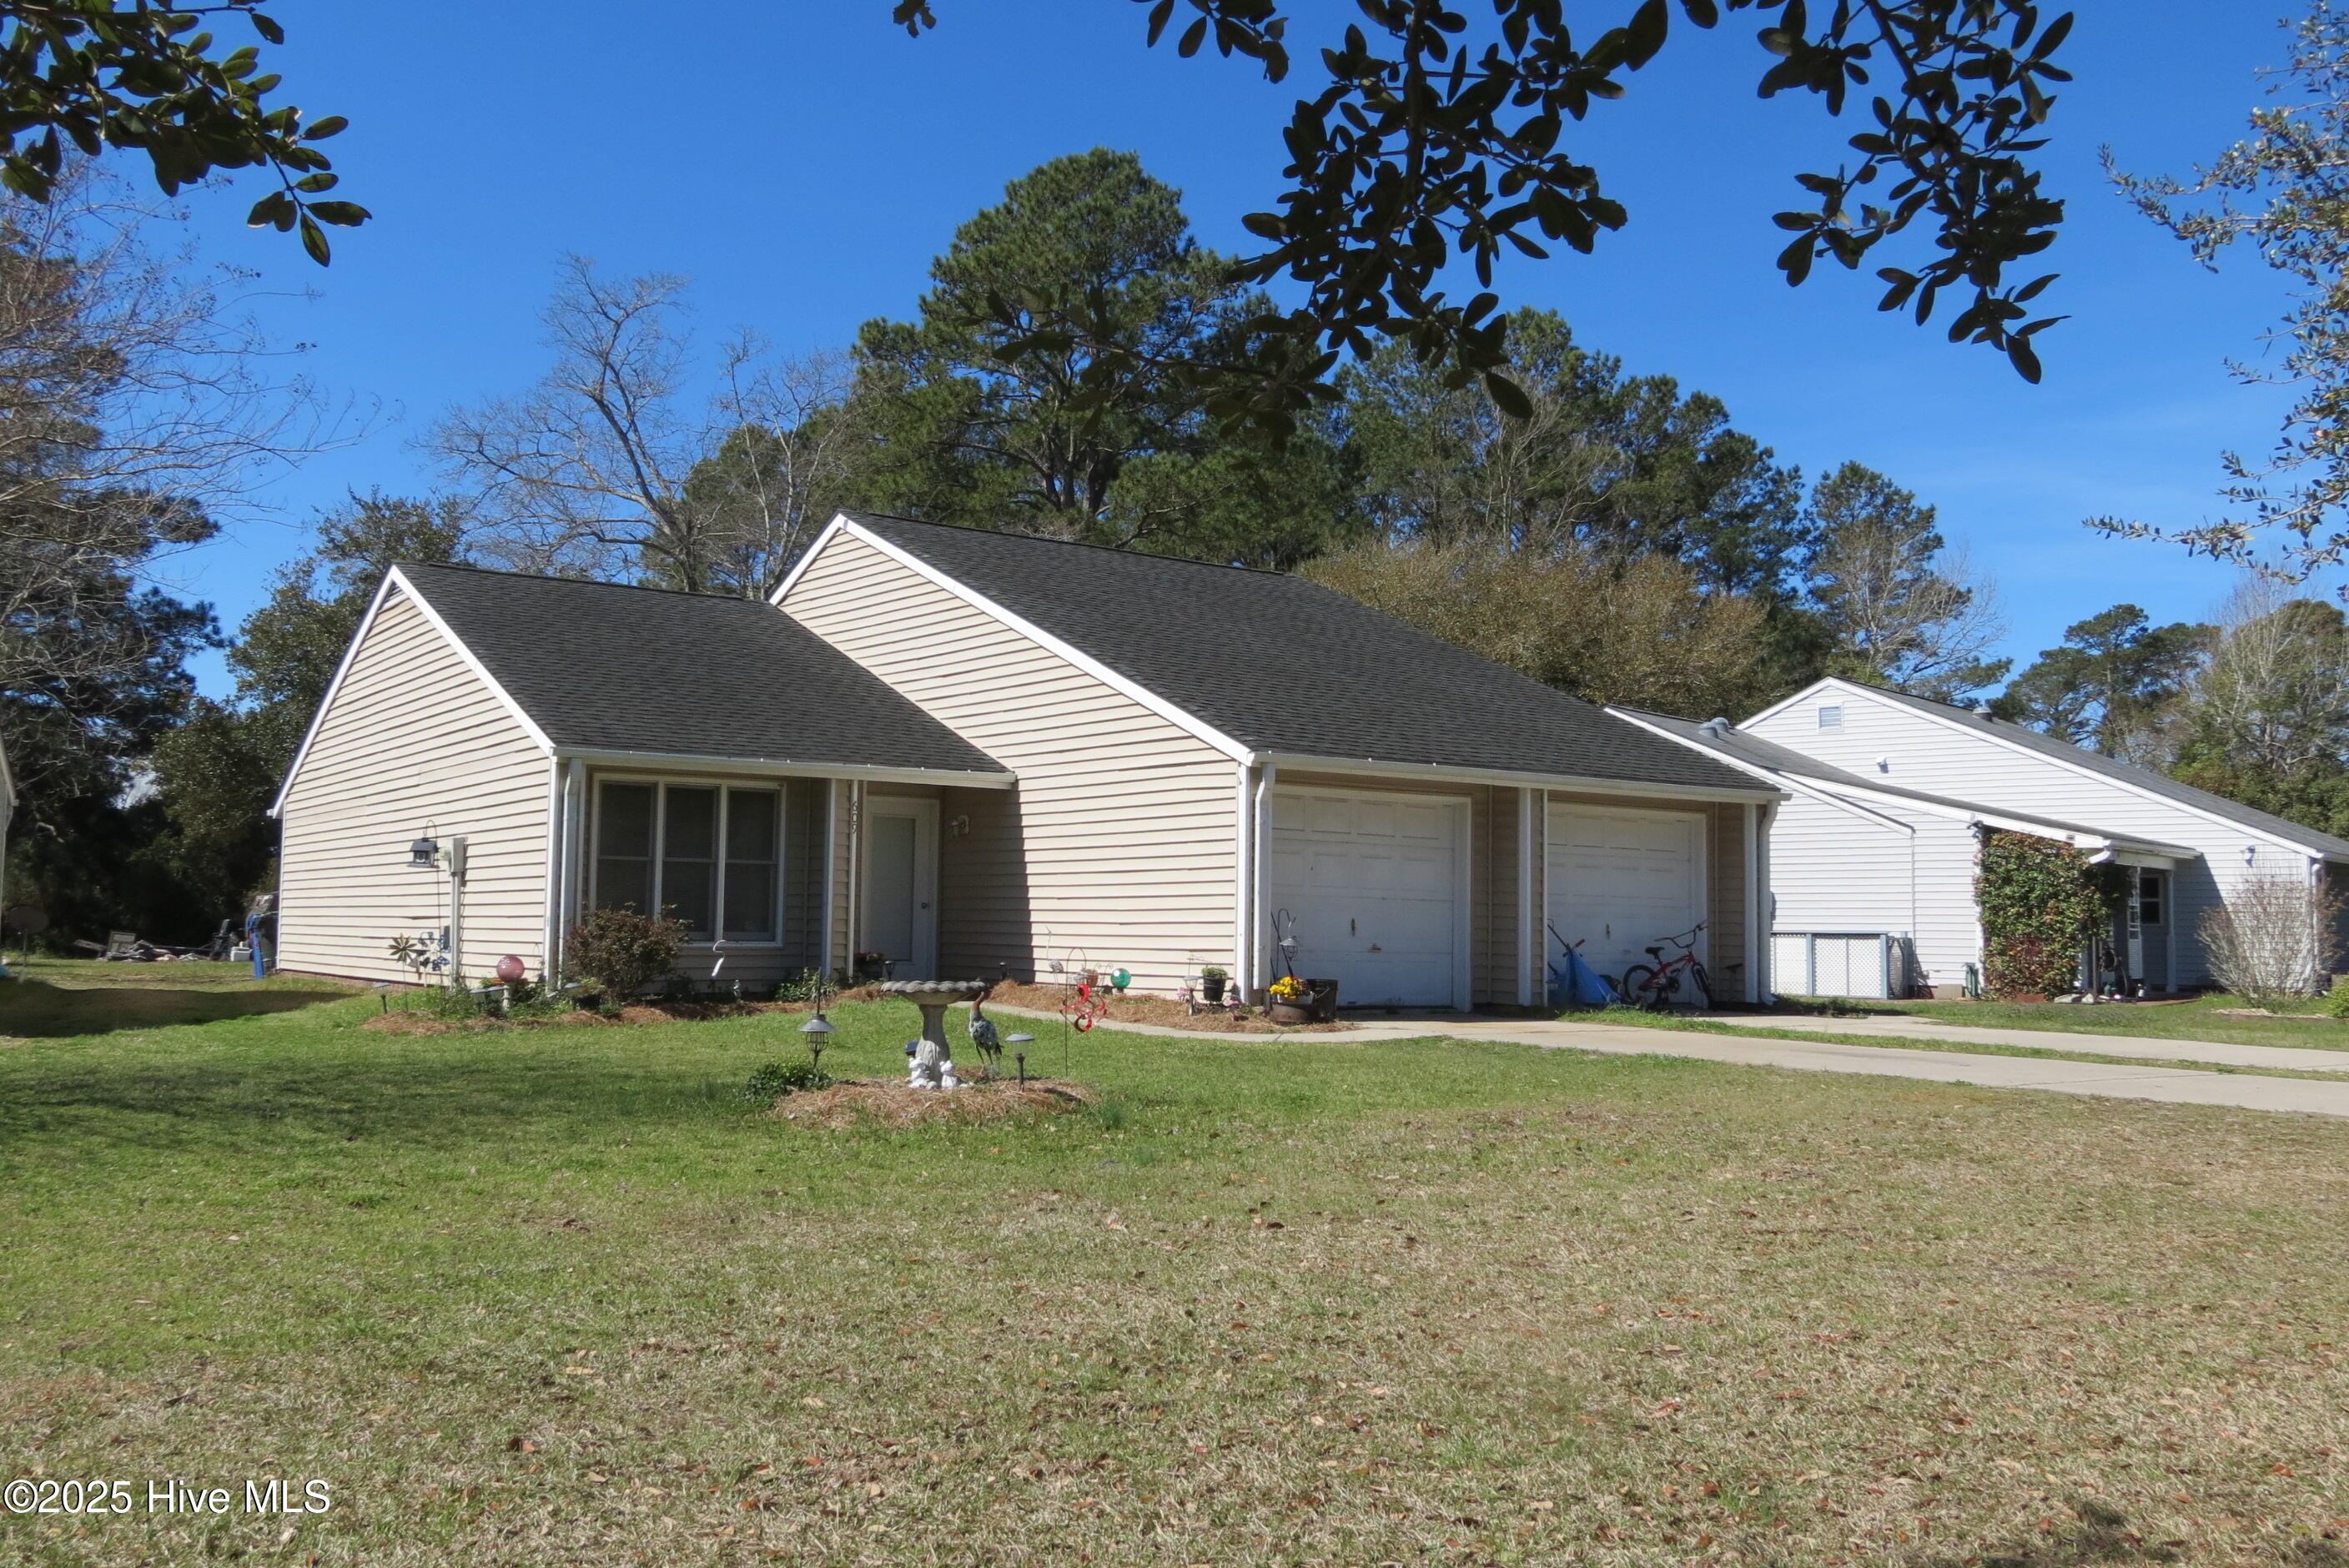
$445,000
4
bds
|
4
ba
|
0
sqft
|
built
1985
609 Ragan Rd, Oriental, NC 28571
$-1,464
Cash flow
-17.2%
Cash-on-Cash Return
2.3%
Cap rate
0.3%
Rent to Value Ratio
Active
$735,000
3
bds
|
3
ba
|
2,826
sqft
|
built
1992
38 Shore Dr E, Oriental, NC 28571
$-1,438
Cash flow
-10.2%
Cash-on-Cash Return
3.9%
Cap rate
0.5%
Rent to Value Ratio
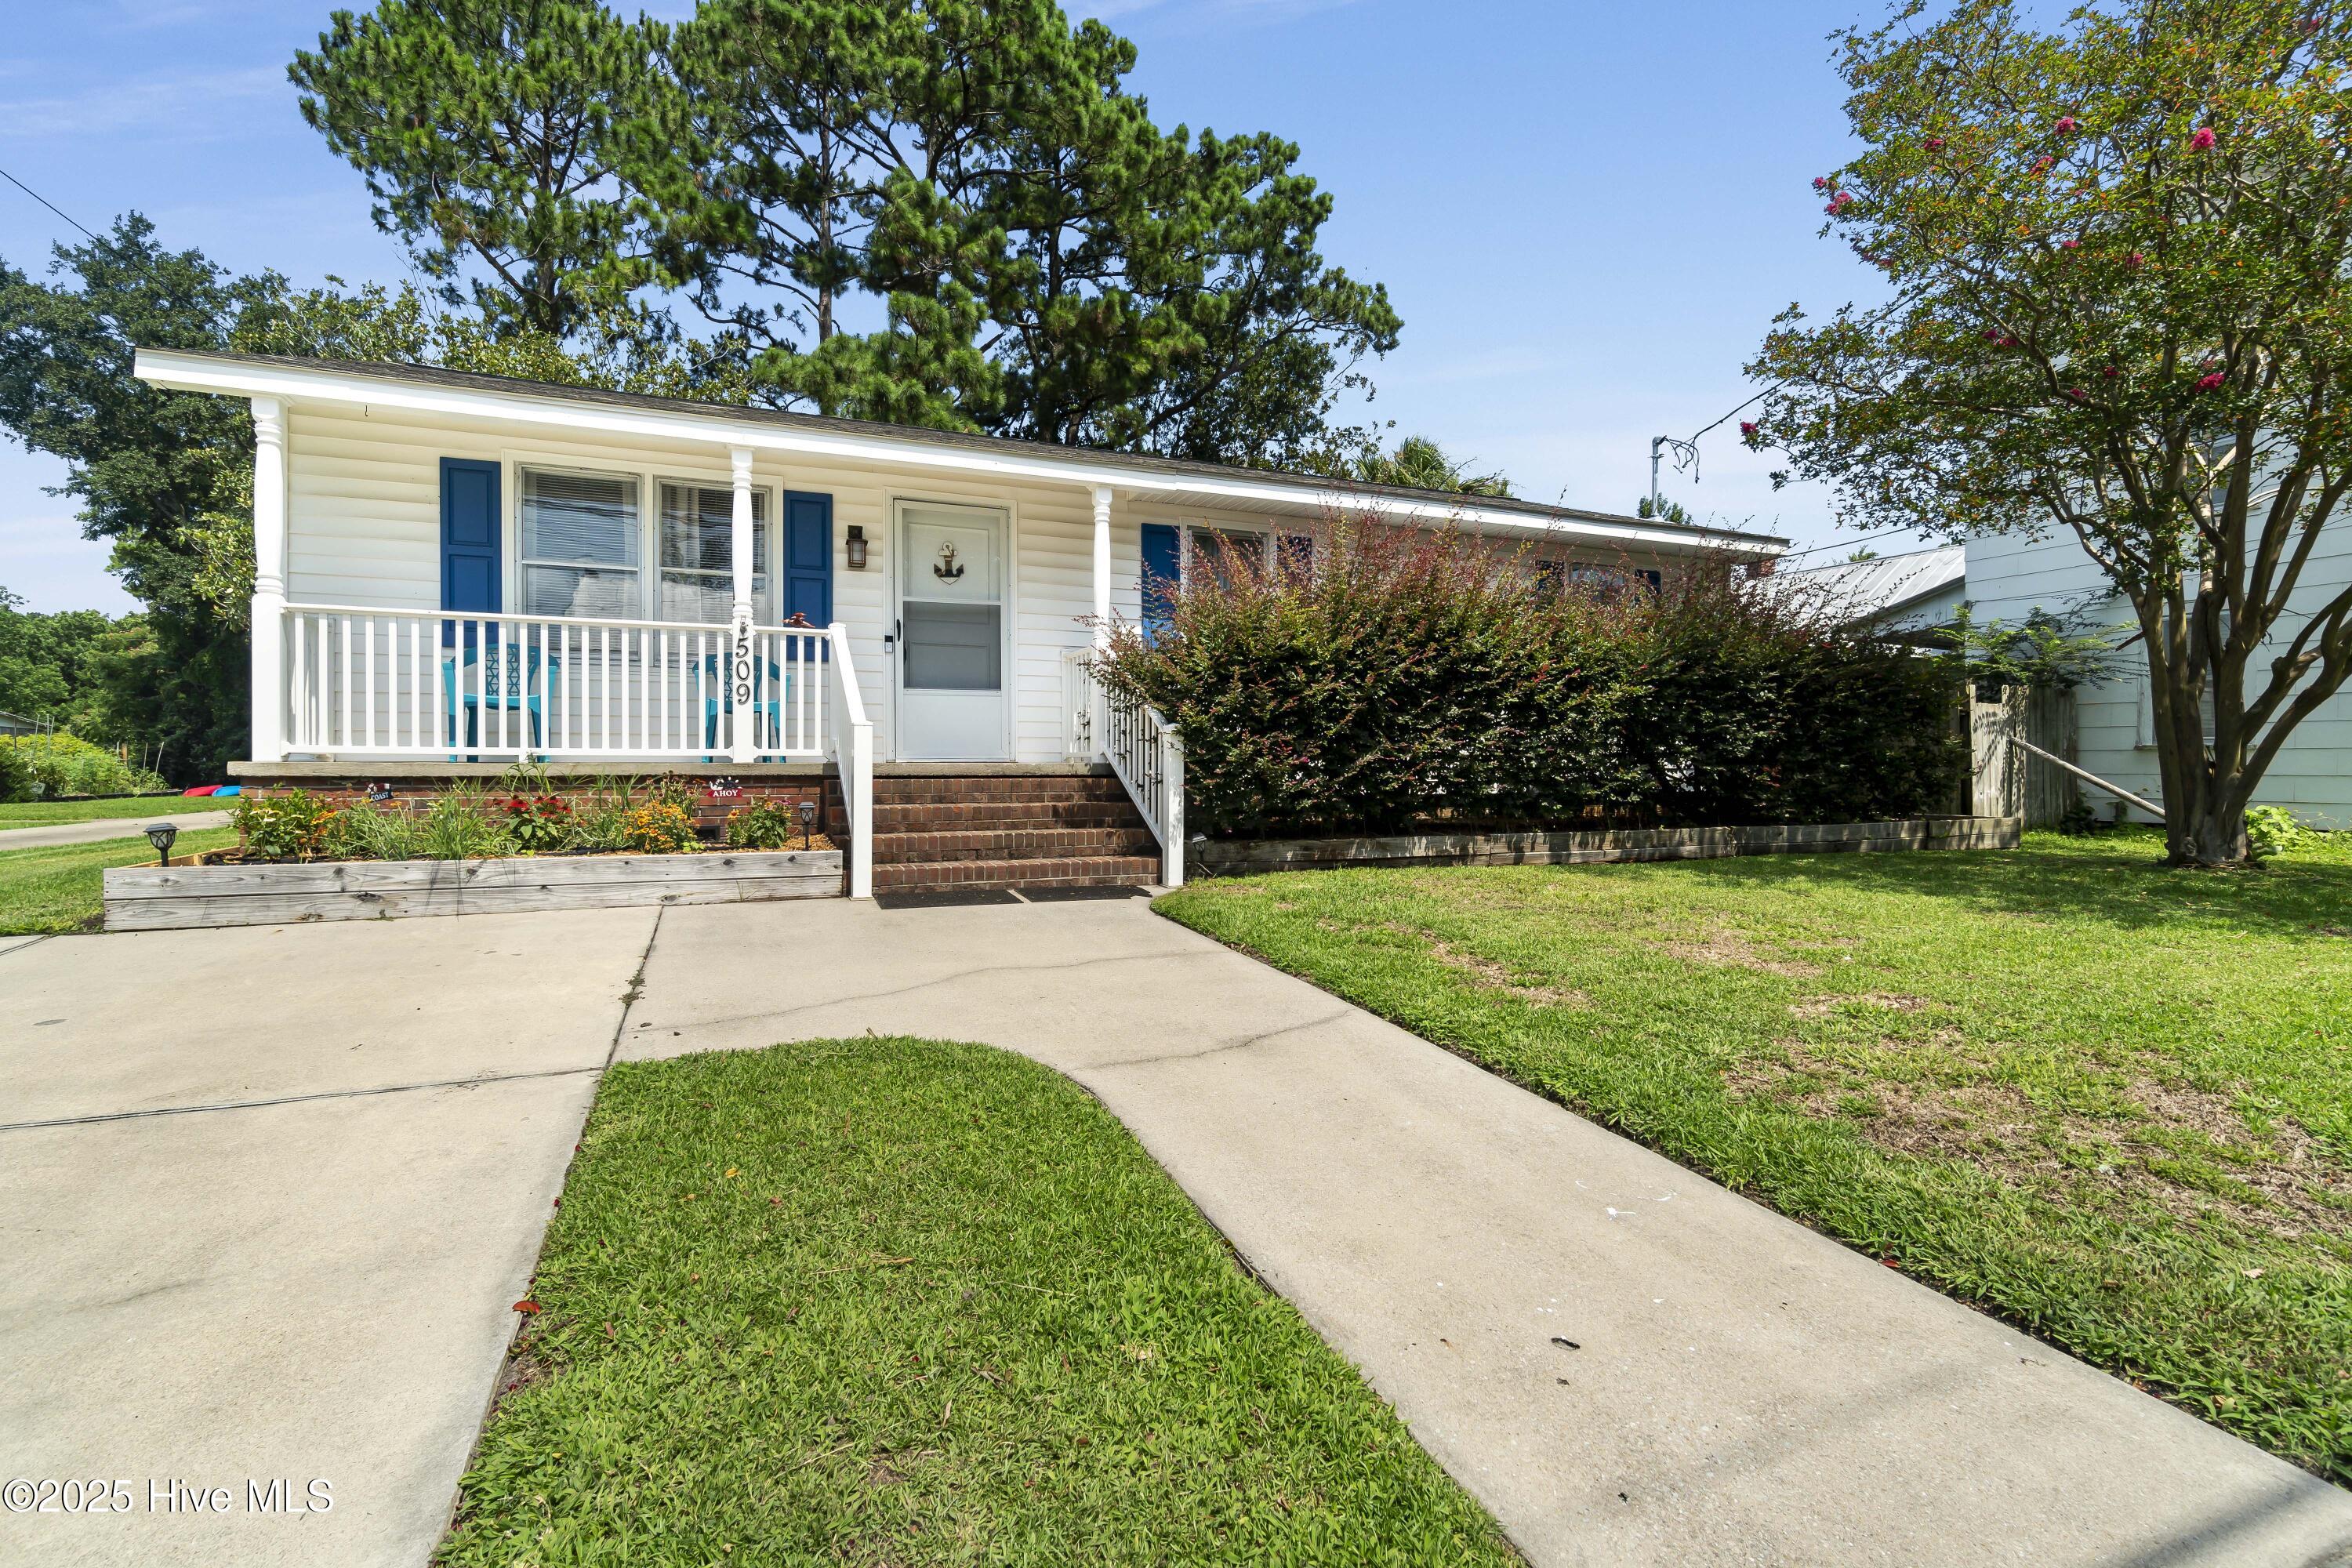
Active
$320,000
3
bds
|
1
ba
|
1,008
sqft
|
built
1973
509 Broad St, Oriental, NC 28571
$-603
Cash flow
-9.8%
Cash-on-Cash Return
4.0%
Cap rate
0.5%
Rent to Value Ratio
Active
$628,000
3
bds
|
3
ba
|
2,239
sqft
|
built
1997
706 Church St, Oriental, NC 28571
$-1,522
Cash flow
-12.6%
Cash-on-Cash Return
3.4%
Cap rate
0.4%
Rent to Value Ratio
Active
$543,000
3
bds
|
4
ba
|
2,622
sqft
|
built
1988
1105 Neuse Dr, Oriental, NC 28571
$-1,133
Cash flow
-10.9%
Cash-on-Cash Return
3.8%
Cap rate
0.5%
Rent to Value Ratio
Active
$275,000
3
bds
|
1
ba
|
1,171
sqft
|
built
1904
503 Hodges St, Oriental, NC 28571
$-292
Cash flow
-5.5%
Cash-on-Cash Return
5.0%
Cap rate
0.7%
Rent to Value Ratio
Active
$1,090,000
4
bds
|
4
ba
|
2,799
sqft
|
built
2007
203 Vandemere St, Oriental, NC 28571
$-2,954
Cash flow
-14.1%
Cash-on-Cash Return
3.0%
Cap rate
0.4%
Rent to Value Ratio

Active
$425,000
3
bds
|
2
ba
|
1,334
sqft
|
built
1920
500 Hodges St, Oriental, NC 28571
$-710
Cash flow
-8.7%
Cash-on-Cash Return
4.3%
Cap rate
0.5%
Rent to Value Ratio

Active
$425,500
3
bds
|
3
ba
|
2,424
sqft
|
built
1986
543 Cooper Leath Trl, Oriental, NC 28571
$-752
Cash flow
-9.2%
Cash-on-Cash Return
4.2%
Cap rate
0.5%
Rent to Value Ratio
Active
$395,000
3
bds
|
2
ba
|
1,842
sqft
|
built
2023
615 Windward Dr, Oriental, NC 28571
$-415
Cash flow
-5.5%
Cash-on-Cash Return
5.0%
Cap rate
0.6%
Rent to Value Ratio

Active
$1,345,000
4
bds
|
2
ba
|
1,680
sqft
|
built
1965
1210 Neuse Dr, Oriental, NC 28571
$-5,588
Cash flow
-21.7%
Cash-on-Cash Return
1.3%
Cap rate
0.2%
Rent to Value Ratio

Active
$850,000
3
bds
|
4
ba
|
2,636
sqft
|
built
2007
317 E Harborside Rd, Oriental, NC 28571
$-2,378
Cash flow
-14.6%
Cash-on-Cash Return
2.9%
Cap rate
0.4%
Rent to Value Ratio
Active
$899,000
2
bds
|
2
ba
|
1,648
sqft
|
built
1915
130 Holiday Ln, Oriental, NC 28571
$-3,126
Cash flow
-18.1%
Cash-on-Cash Return
2.1%
Cap rate
0.3%
Rent to Value Ratio