Pompano Beach, FL Investment Properties for Sale
Browse homes for sale and investment properties in Pompano Beach, FL. Refine your search by price, property type, or more.
Best cash flowing properties in Pompano Beach, FL
Active
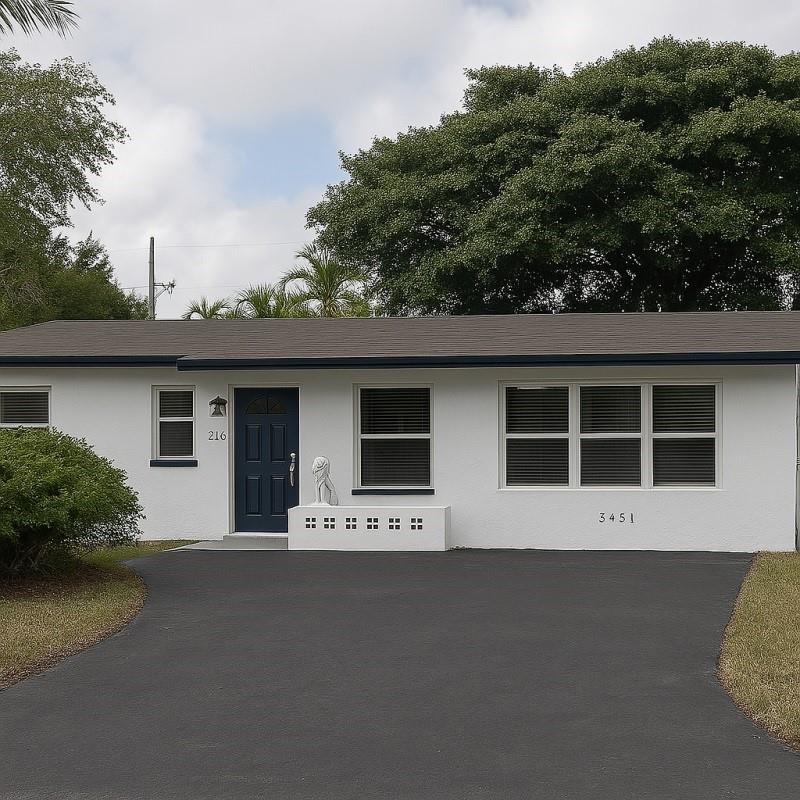
$424,900
3
bds
|
2
ba
|
1,358
sqft
|
built
1964
3451 NE 13th Ave, Pompano Beach, FL 33064
$-162
Cash flow
-2.0%
Cash-on-Cash Return
5.8%
Cap rate
0.8%
Rent to Value Ratio
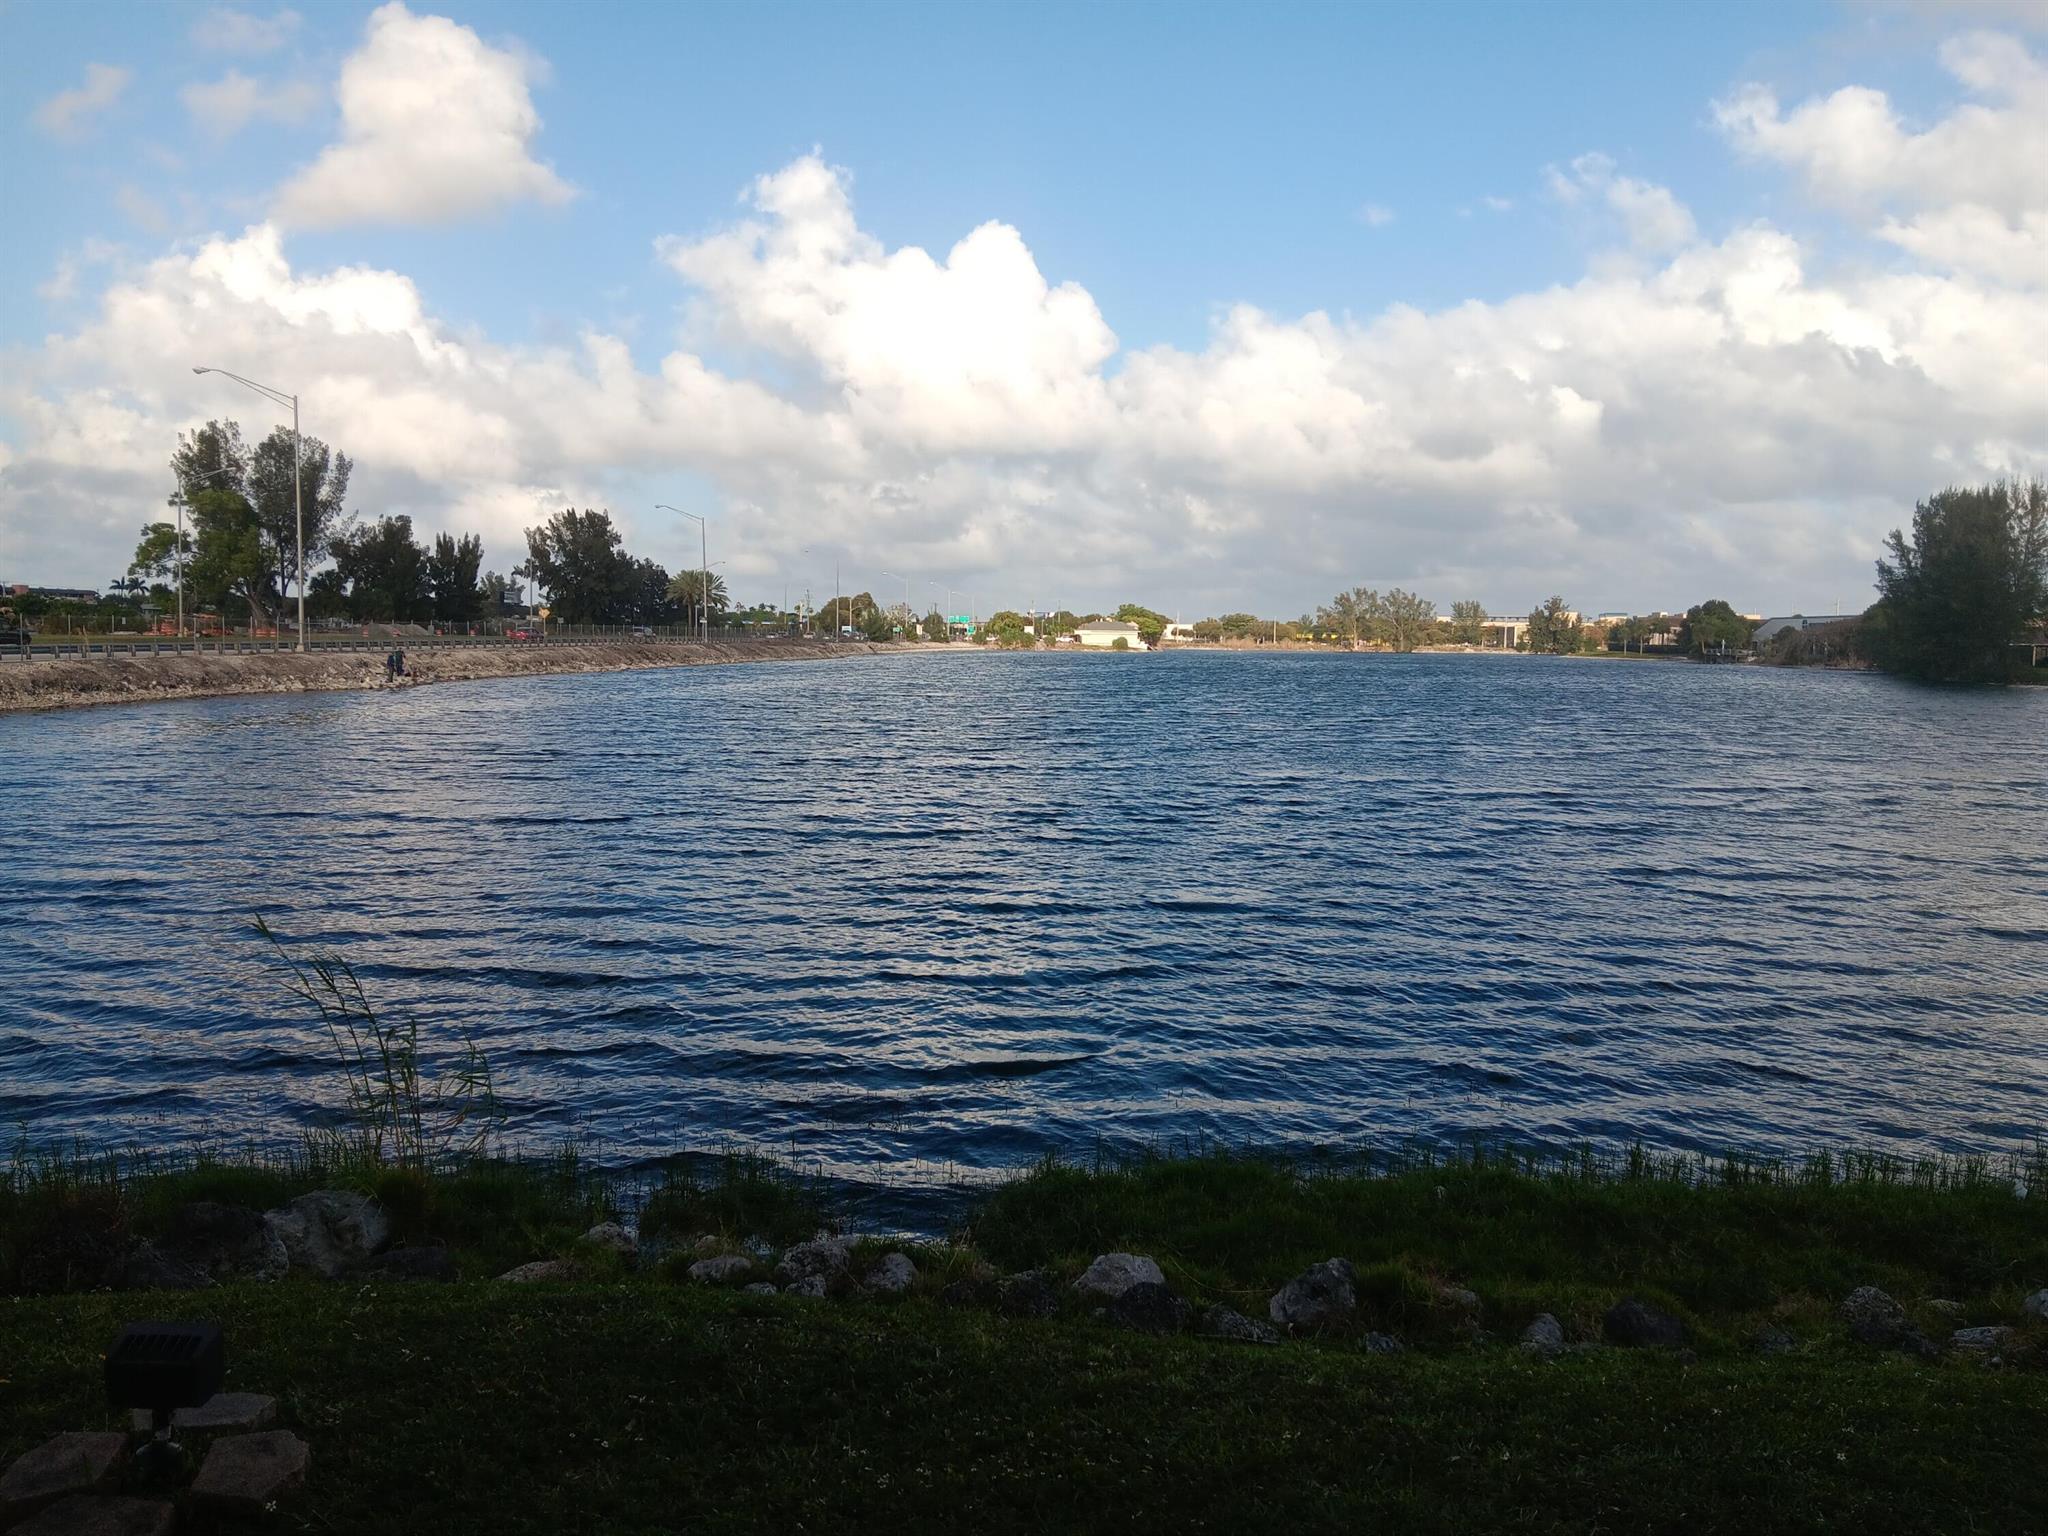
Active
$169,000
1
bds
|
2
ba
|
850
sqft
|
built
1980
3450 Blue Lake Dr, Pompano Beach, FL 33064
$-284
Cash flow
-8.8%
Cash-on-Cash Return
4.3%
Cap rate
0.9%
Rent to Value Ratio
1,114 out of 1,230 properties for sale in Pompano Beach, FL
Limited Results Shown
Create a free account, or log in to reveal all property listings and enjoy the complete experience.
Active
$950,000
bds
|
0
ba
|
1,250
sqft
|
built
1958
201 NW 7th Ter, Pompano Beach, FL 33060
$-3,595
Cash flow
-19.7%
Cash-on-Cash Return
1.7%
Cap rate
0.2%
Rent to Value Ratio
Active
$1,475,000
3
bds
|
2
ba
|
1,586
sqft
|
built
1955
2358 SE 11th St, Pompano Beach, FL 33062
$-3,872
Cash flow
-13.7%
Cash-on-Cash Return
3.1%
Cap rate
0.5%
Rent to Value Ratio
Active
$238,000
2
bds
|
2
ba
|
1,150
sqft
|
built
1980
3500 Blue Lake Dr, Pompano Beach, FL 33064
$-674
Cash flow
-14.8%
Cash-on-Cash Return
2.9%
Cap rate
1.0%
Rent to Value Ratio

Active
$289,000
3
bds
|
2
ba
|
1,390
sqft
|
built
1969
3150 N Palm Aire Dr, Pompano Beach, FL 33069
$-1,261
Cash flow
-22.8%
Cash-on-Cash Return
1.0%
Cap rate
0.8%
Rent to Value Ratio
Active
$424,900
3
bds
|
2
ba
|
1,358
sqft
|
built
1964
3451 NE 13th Ave, Pompano Beach, FL 33064
$-162
Cash flow
-2.0%
Cash-on-Cash Return
5.8%
Cap rate
0.8%
Rent to Value Ratio
Active
$795,000
2
bds
|
2
ba
|
1,130
sqft
|
built
1977
531 N Ocean Blvd, Pompano Beach, FL 33062
$-4,079
Cash flow
-26.8%
Cash-on-Cash Return
0.1%
Cap rate
0.4%
Rent to Value Ratio
Active
$962,000
4
bds
|
4
ba
|
2,722
sqft
|
built
1989
517 Misty Oaks Dr, Pompano Beach, FL 33069
$-2,468
Cash flow
-13.4%
Cash-on-Cash Return
3.2%
Cap rate
0.6%
Rent to Value Ratio

Active
$497,000
6
bds
|
4
ba
|
1,525
sqft
|
built
1961
691 NW 20th Ct, Pompano Beach, FL 33060
$-1,227
Cash flow
-12.9%
Cash-on-Cash Return
3.3%
Cap rate
0.6%
Rent to Value Ratio
Active under contract
$434,000
3
bds
|
3
ba
|
1,538
sqft
|
built
2016
1078 NW 33rd St, Pompano Beach, FL 33064
$-742
Cash flow
-8.9%
Cash-on-Cash Return
4.2%
Cap rate
0.7%
Rent to Value Ratio
Active
$349,900
1
bds
|
1
ba
|
700
sqft
|
built
1977
531 N Ocean Blvd, Pompano Beach, FL 33062
$-1,311
Cash flow
-19.5%
Cash-on-Cash Return
1.8%
Cap rate
0.7%
Rent to Value Ratio
Pending
$499,000
2
bds
|
2
ba
|
1,390
sqft
|
built
1986
1500 N Ocean Blvd, Pompano Beach, FL 33062
$-2,675
Cash flow
-28.0%
Cash-on-Cash Return
-0.1%
Cap rate
0.6%
Rent to Value Ratio
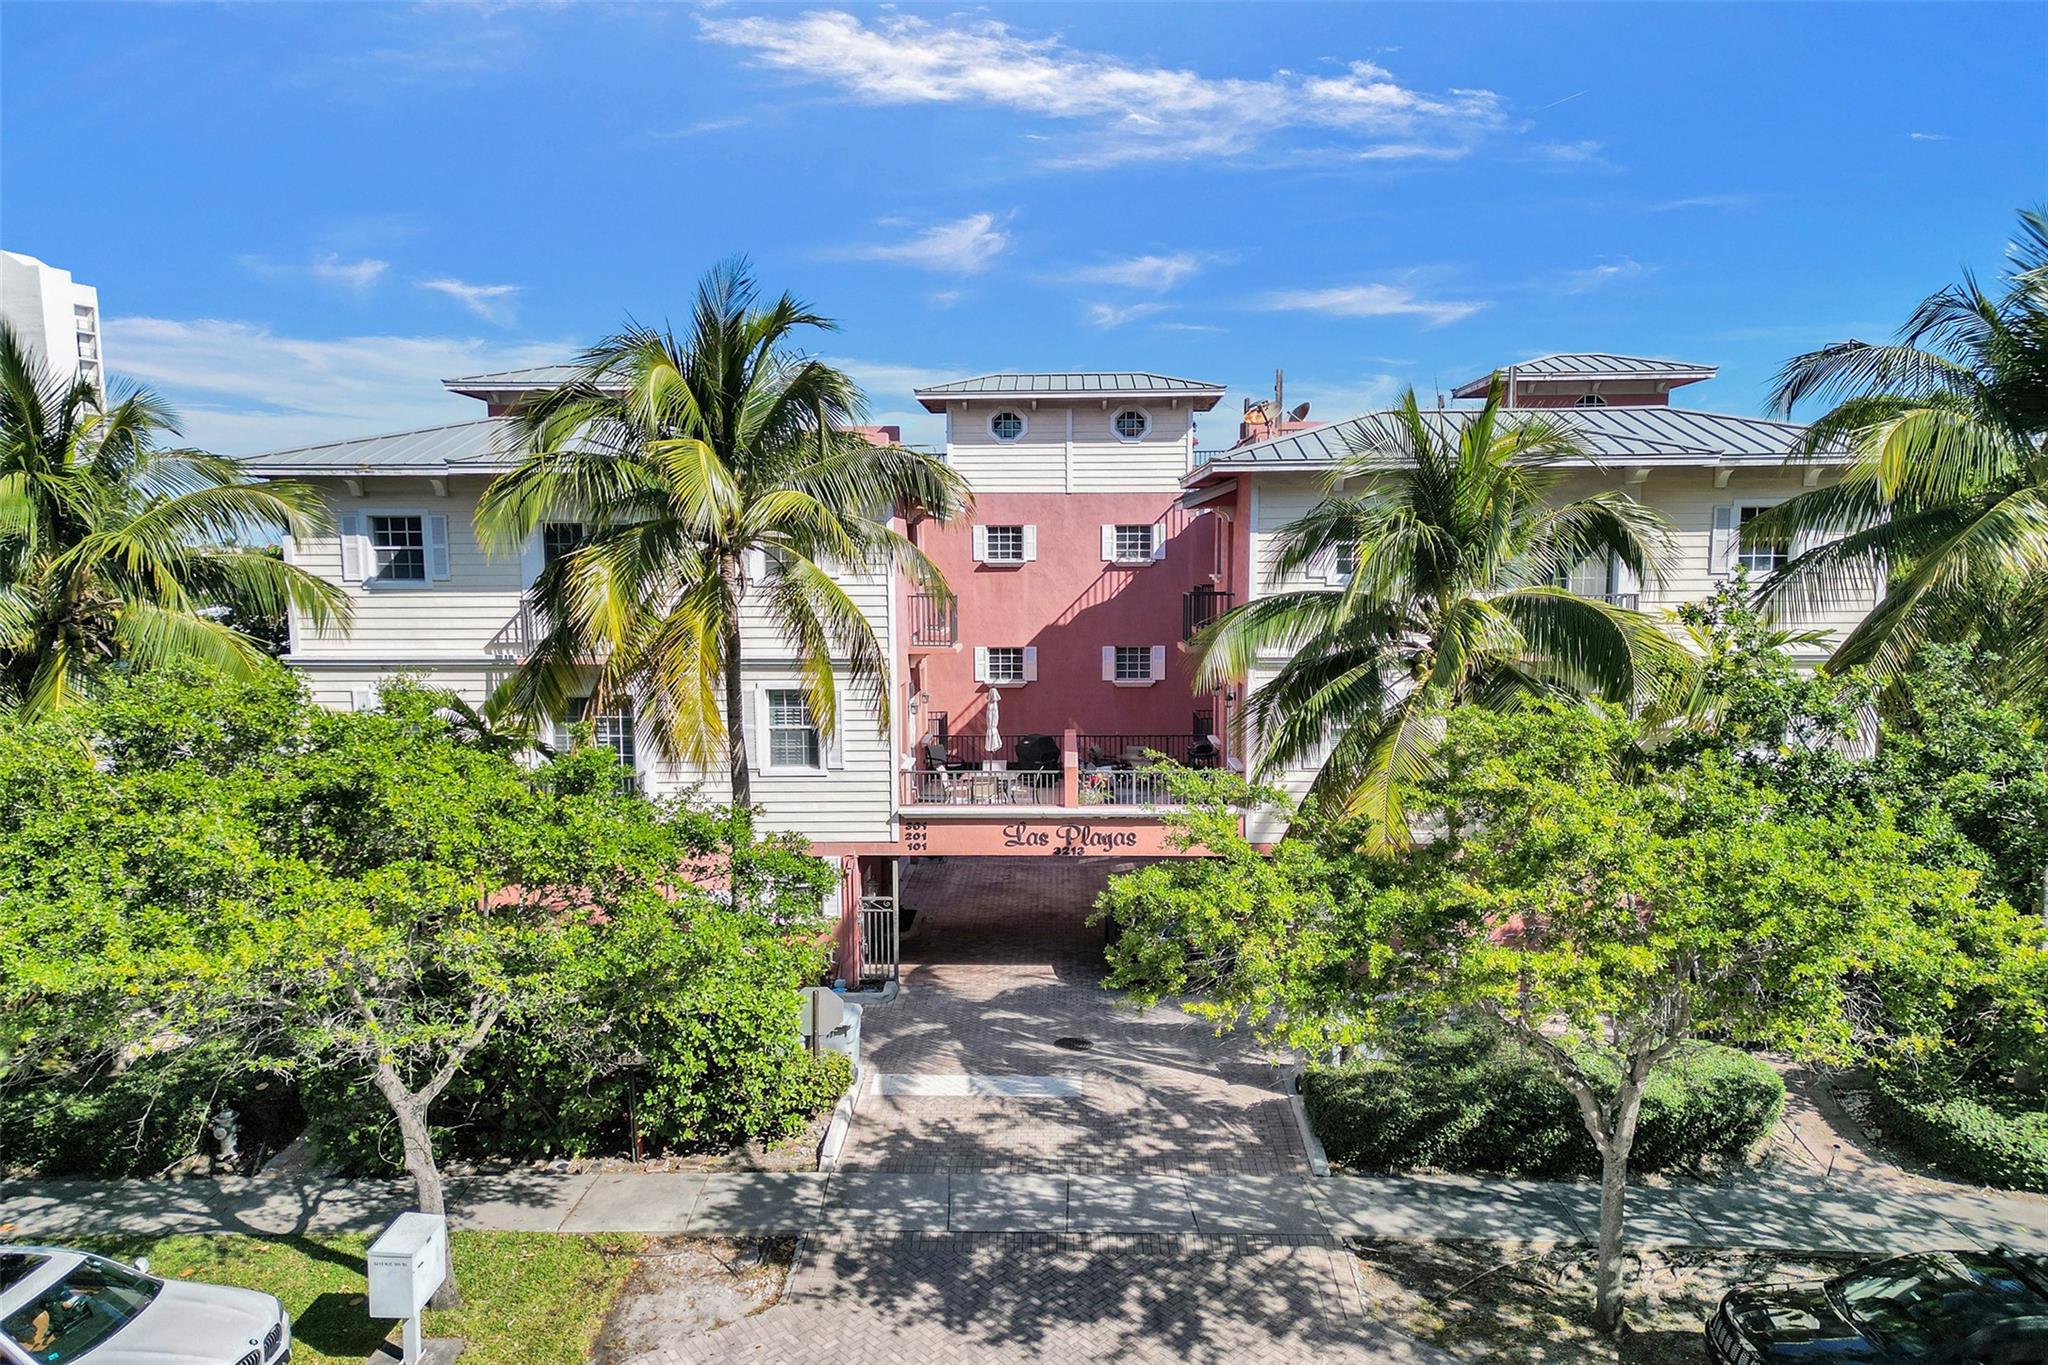
Active
$739,000
2
bds
|
3
ba
|
1,456
sqft
|
built
2007
3213 NE 5th St, Pompano Beach, FL 33062
$-2,710
Cash flow
-19.1%
Cash-on-Cash Return
1.9%
Cap rate
0.4%
Rent to Value Ratio
Active
$379,900
2
bds
|
2
ba
|
1,000
sqft
|
built
1980
1541 S Ocean Blvd, Pompano Beach, FL 33062
$-1,055
Cash flow
-14.5%
Cash-on-Cash Return
3.0%
Cap rate
0.7%
Rent to Value Ratio
Active
$1,500,000
3
bds
|
2
ba
|
1,586
sqft
|
built
1958
3271 Cypress Creek Dr, Pompano Beach, FL 33062
$-5,360
Cash flow
-18.6%
Cash-on-Cash Return
2.0%
Cap rate
0.4%
Rent to Value Ratio
Active
$340,000
3
bds
|
3
ba
|
1,620
sqft
|
built
1978
804 Cypress Blvd, Pompano Beach, FL 33069
$-1,221
Cash flow
-18.7%
Cash-on-Cash Return
2.0%
Cap rate
0.8%
Rent to Value Ratio
Active
$418,000
3
bds
|
2
ba
|
1,830
sqft
|
built
1986
4130 W Palm Aire Dr, Pompano Beach, FL 33069
$-1,892
Cash flow
-23.6%
Cash-on-Cash Return
0.9%
Cap rate
0.7%
Rent to Value Ratio
Active
$162,500
1
bds
|
1
ba
|
675
sqft
|
built
1973
253 S Cypress Rd, Pompano Beach, FL 33060
$-552
Cash flow
-17.7%
Cash-on-Cash Return
2.2%
Cap rate
1.1%
Rent to Value Ratio
Active
$269,500
1
bds
|
1
ba
|
740
sqft
|
built
1976
3212 NE 12th St, Pompano Beach, FL 33062
$-1,004
Cash flow
-19.4%
Cash-on-Cash Return
1.8%
Cap rate
0.9%
Rent to Value Ratio
Active
$669,000
3
bds
|
4
ba
|
1,907
sqft
|
built
2022
466 SE 1st Cir, Pompano Beach, FL 33060
$-3,243
Cash flow
-25.3%
Cash-on-Cash Return
0.5%
Cap rate
0.5%
Rent to Value Ratio

Active
$303,788
1
bds
|
1
ba
|
800
sqft
|
built
1967
301 N Ocean Blvd, Pompano Beach, FL 33062
$-762
Cash flow
-13.1%
Cash-on-Cash Return
3.3%
Cap rate
0.8%
Rent to Value Ratio
Active
$199,000
3
bds
|
2
ba
|
1,390
sqft
|
built
1972
2851 S Palm Aire Dr, Pompano Beach, FL 33069
$-424
Cash flow
-11.1%
Cash-on-Cash Return
3.7%
Cap rate
1.3%
Rent to Value Ratio

Active
$348,888
3
bds
|
2
ba
|
1,184
sqft
|
built
1962
840 NE 32nd Ct, Pompano Beach, FL 33064
$-517
Cash flow
-7.7%
Cash-on-Cash Return
4.5%
Cap rate
0.8%
Rent to Value Ratio
Active
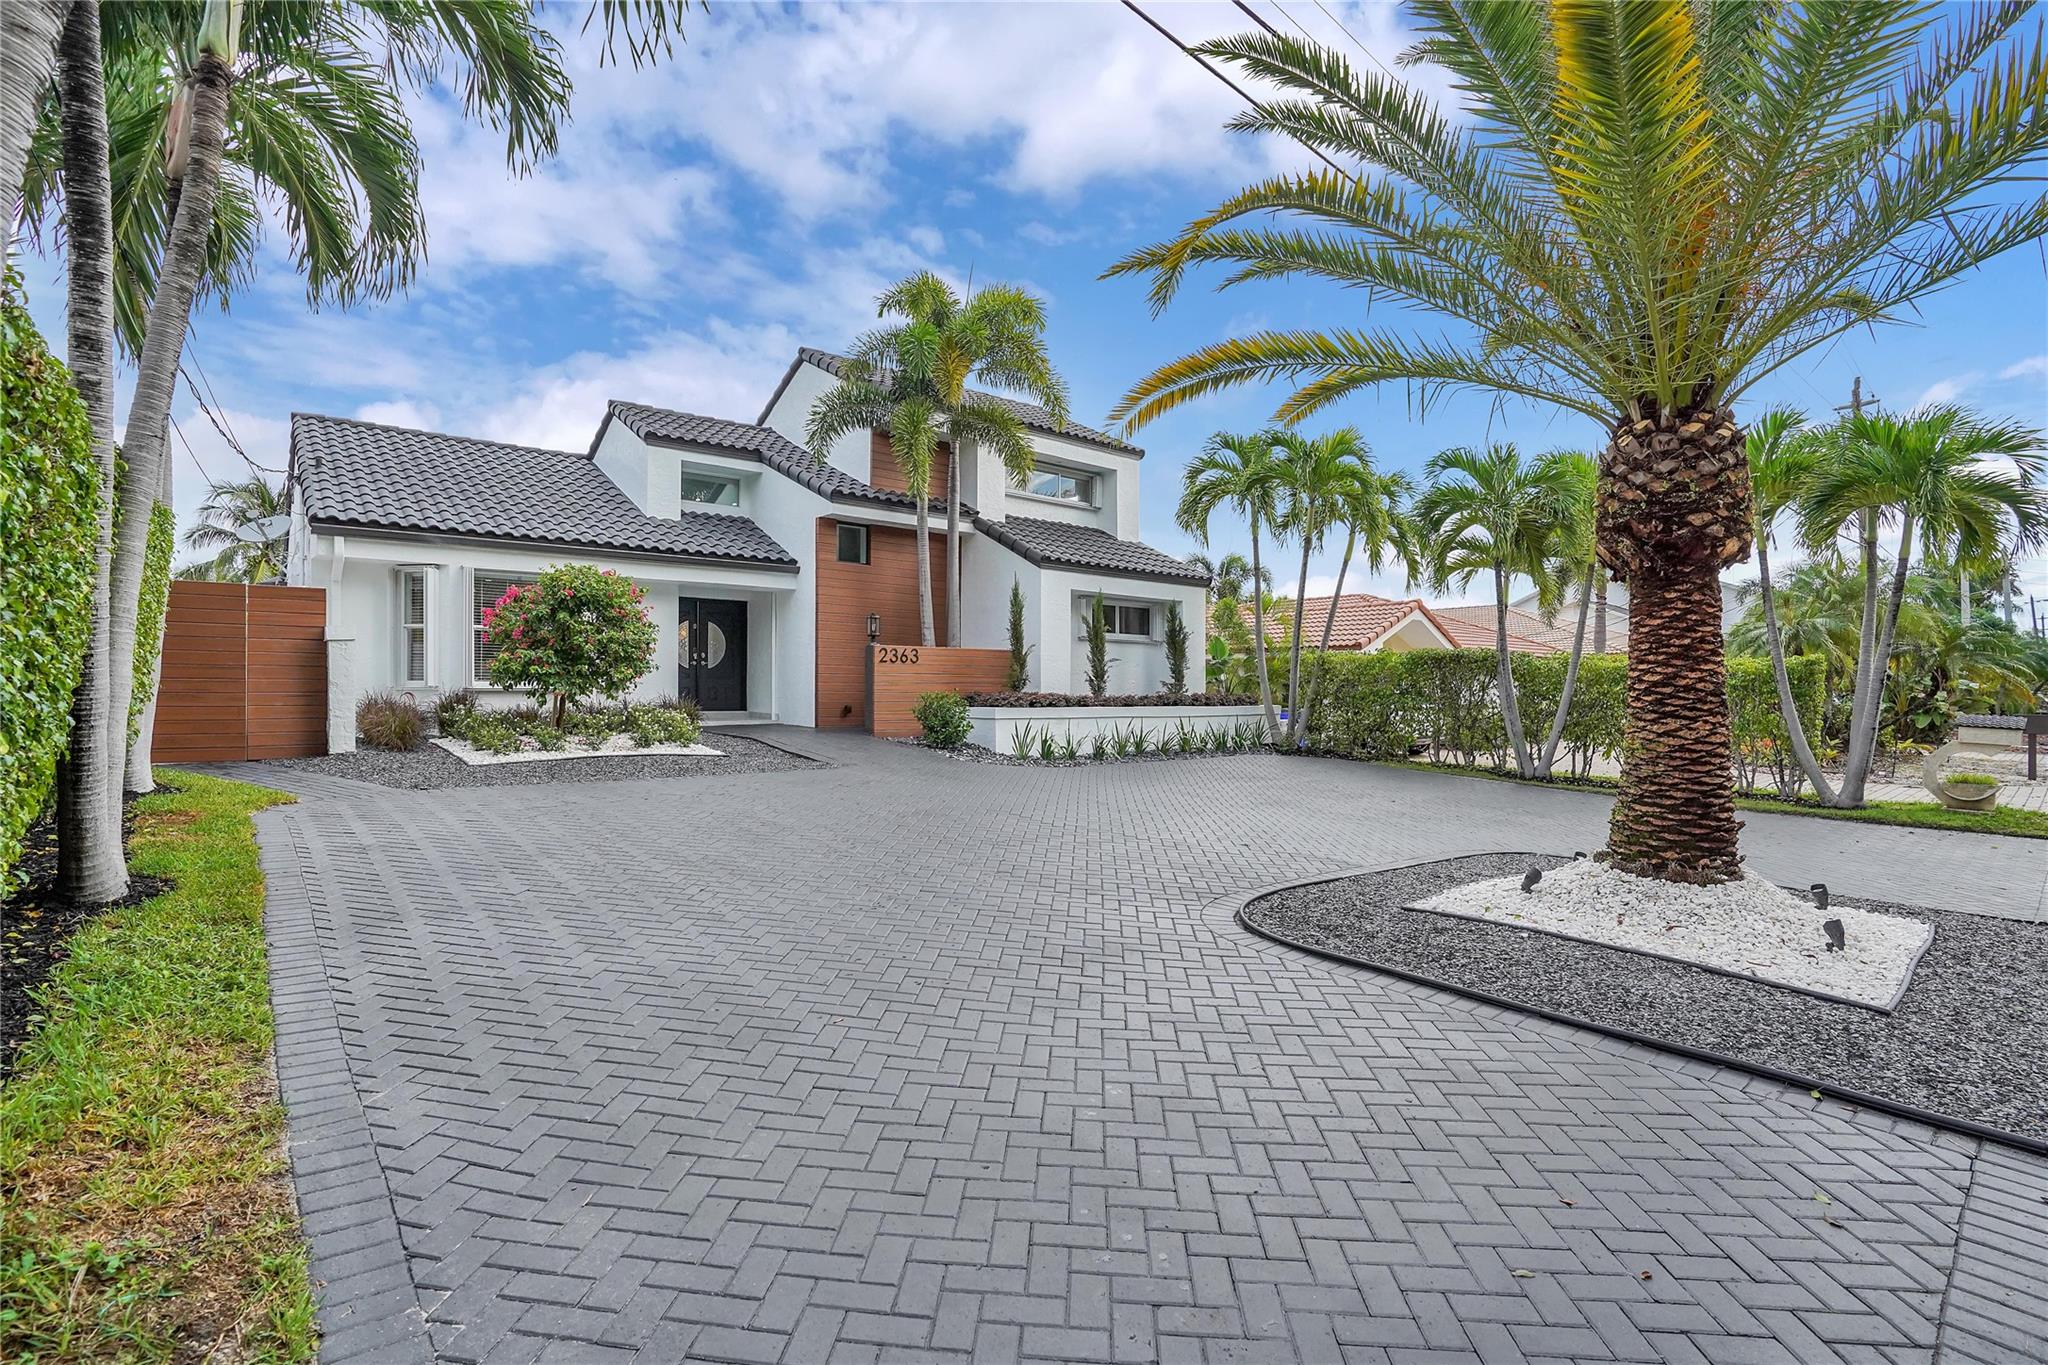
$1,799,000
4
bds
|
4
ba
|
2,248
sqft
|
built
1985
2363 SE 15th St, Pompano Beach, FL 33062
$-4,147
Cash flow
-12.0%
Cash-on-Cash Return
3.5%
Cap rate
0.5%
Rent to Value Ratio
Active
$2,274,000
3
bds
|
2
ba
|
2,117
sqft
|
built
1963
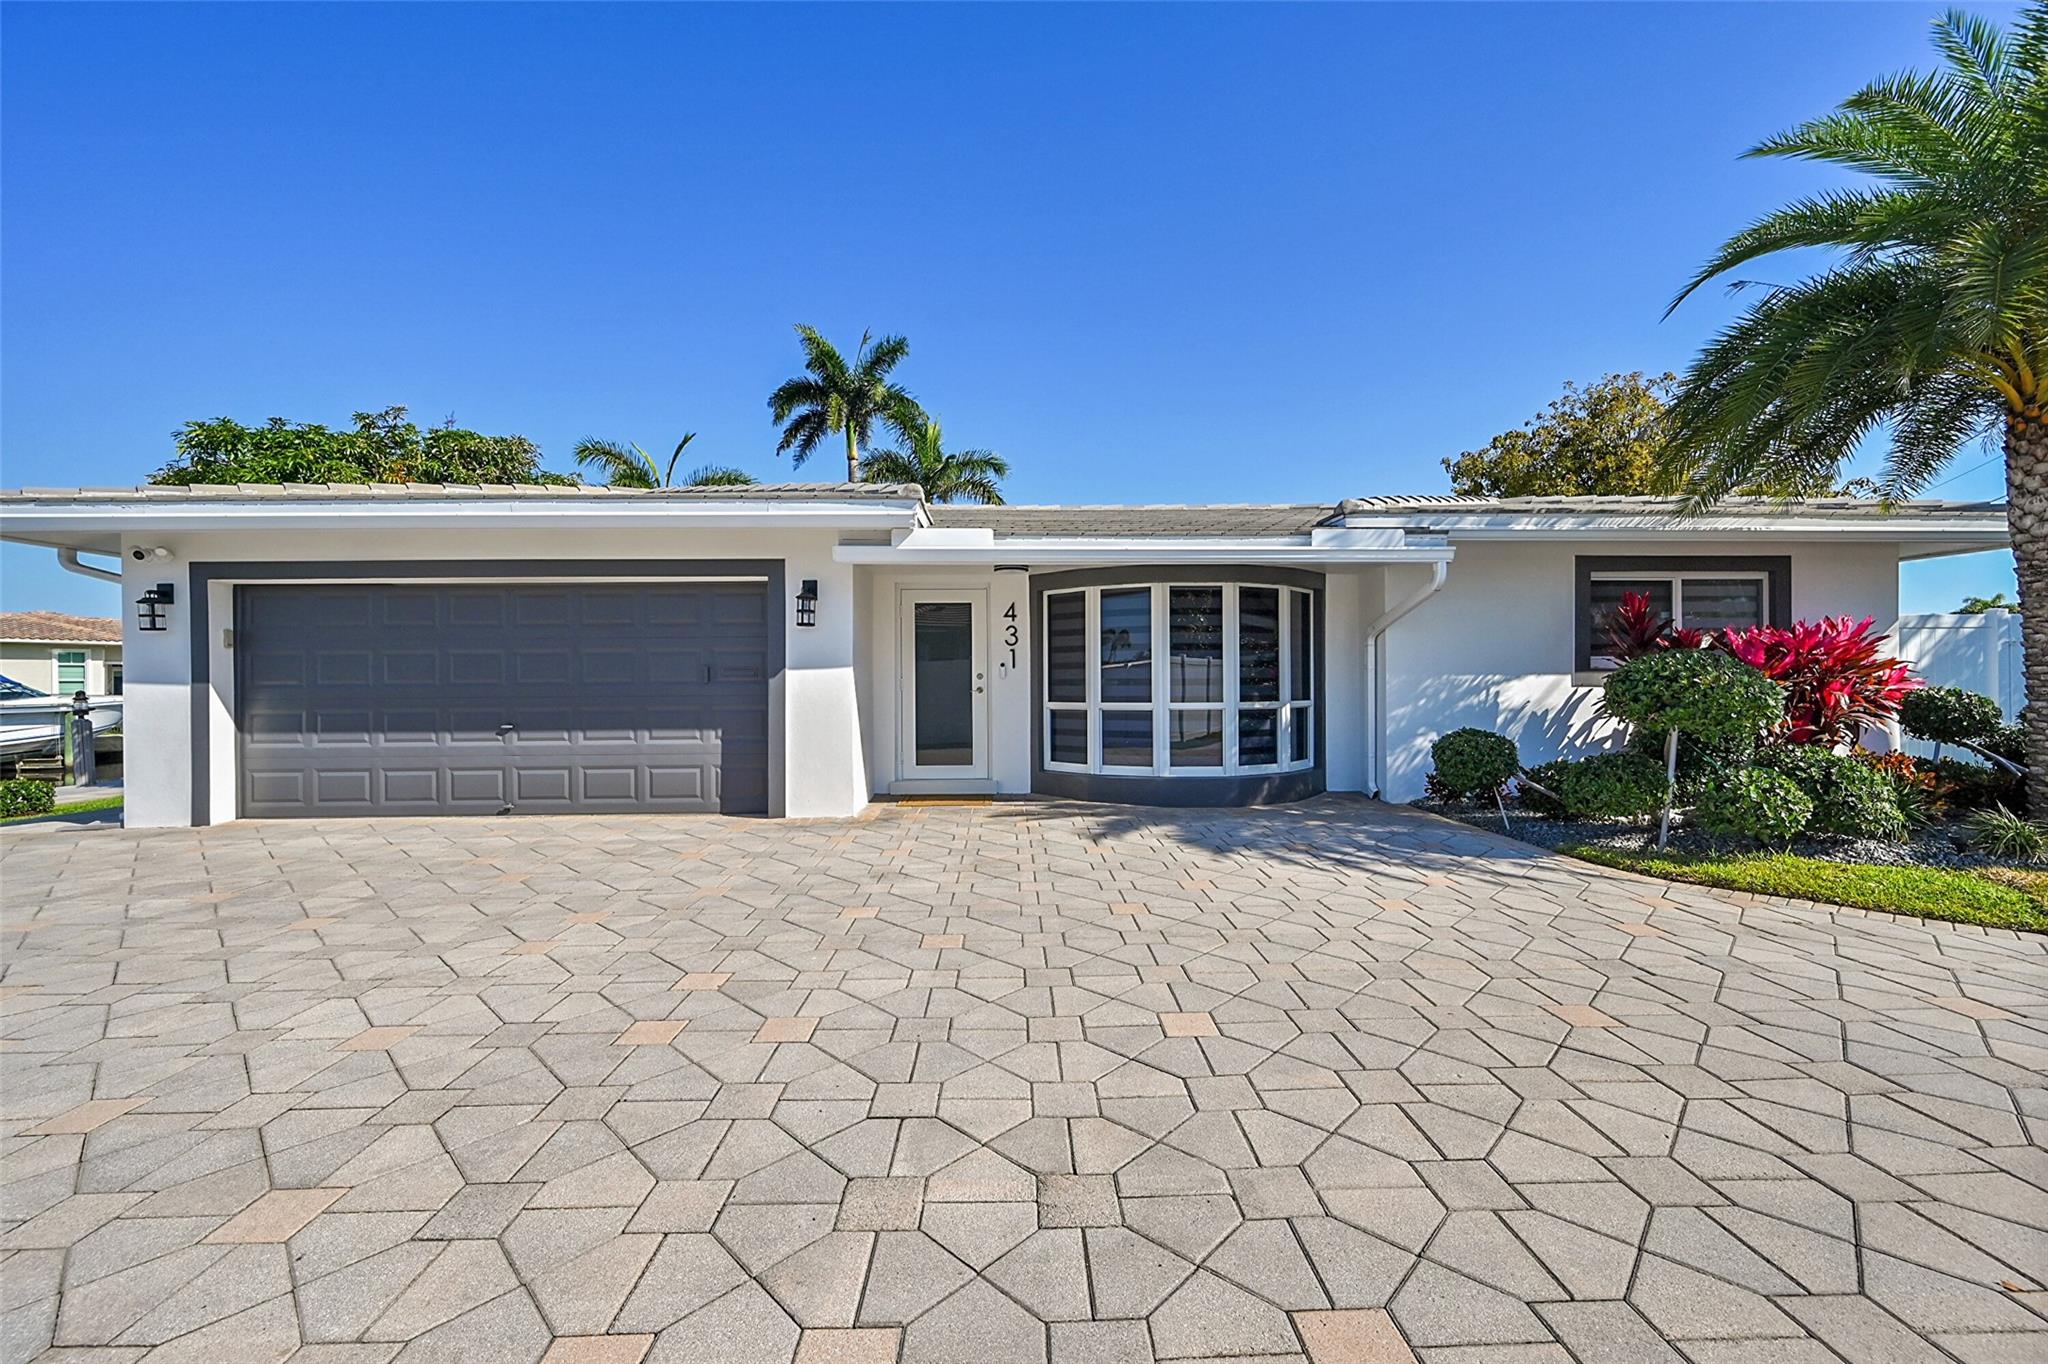
431 SE 9th Ave, Pompano Beach, FL 33060
$-8,168
Cash flow
-18.7%
Cash-on-Cash Return
2.0%
Cap rate
0.4%
Rent to Value Ratio

Active
$999,974
3
bds
|
2
ba
|
1,498
sqft
|
built
1964
1120 SE 9th Ave, Pompano Beach, FL 33060
$-2,565
Cash flow
-13.4%
Cash-on-Cash Return
3.2%
Cap rate
0.5%
Rent to Value Ratio
Active
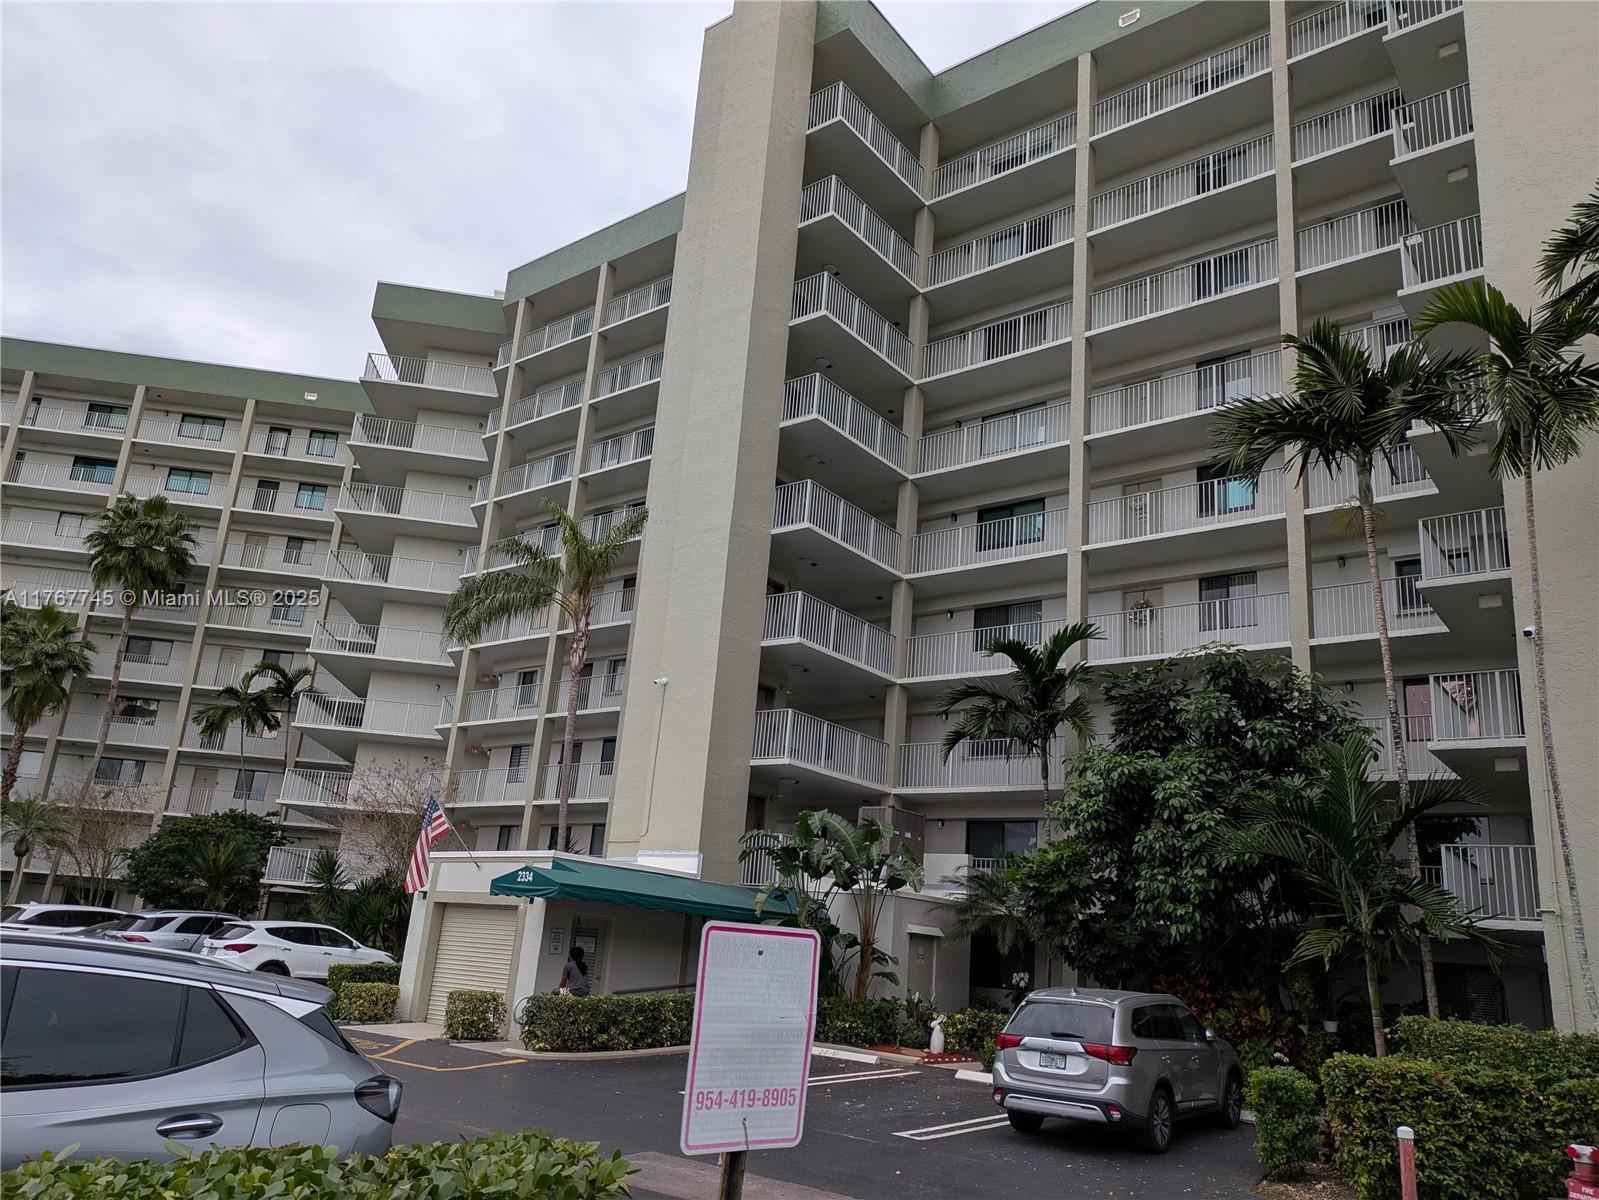
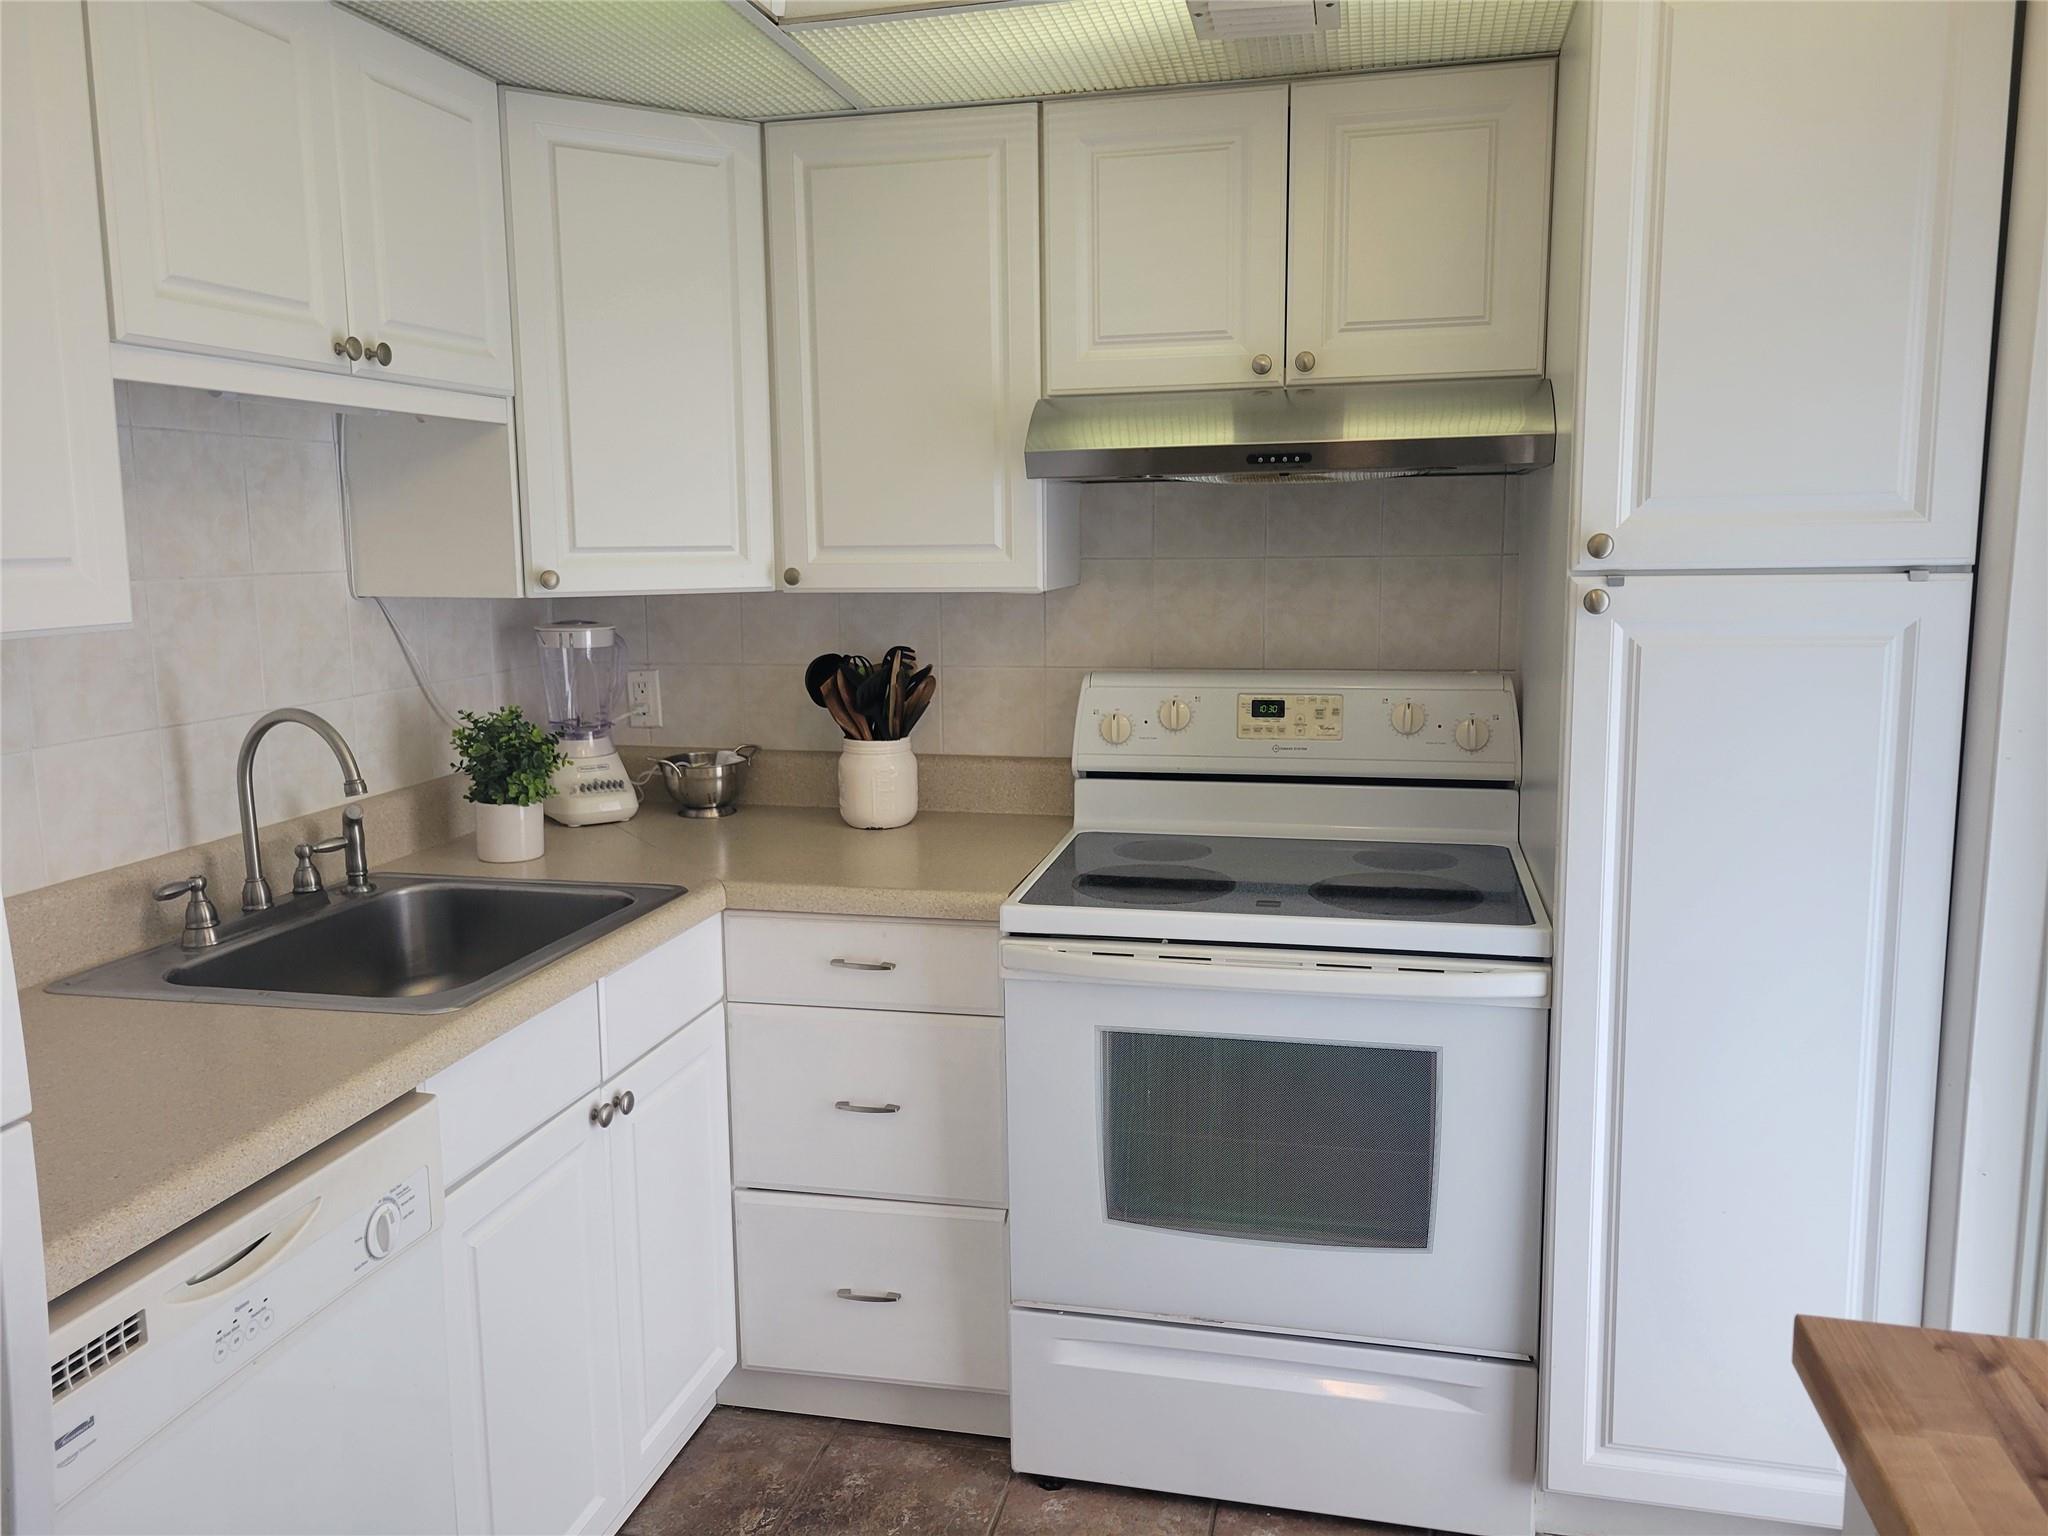
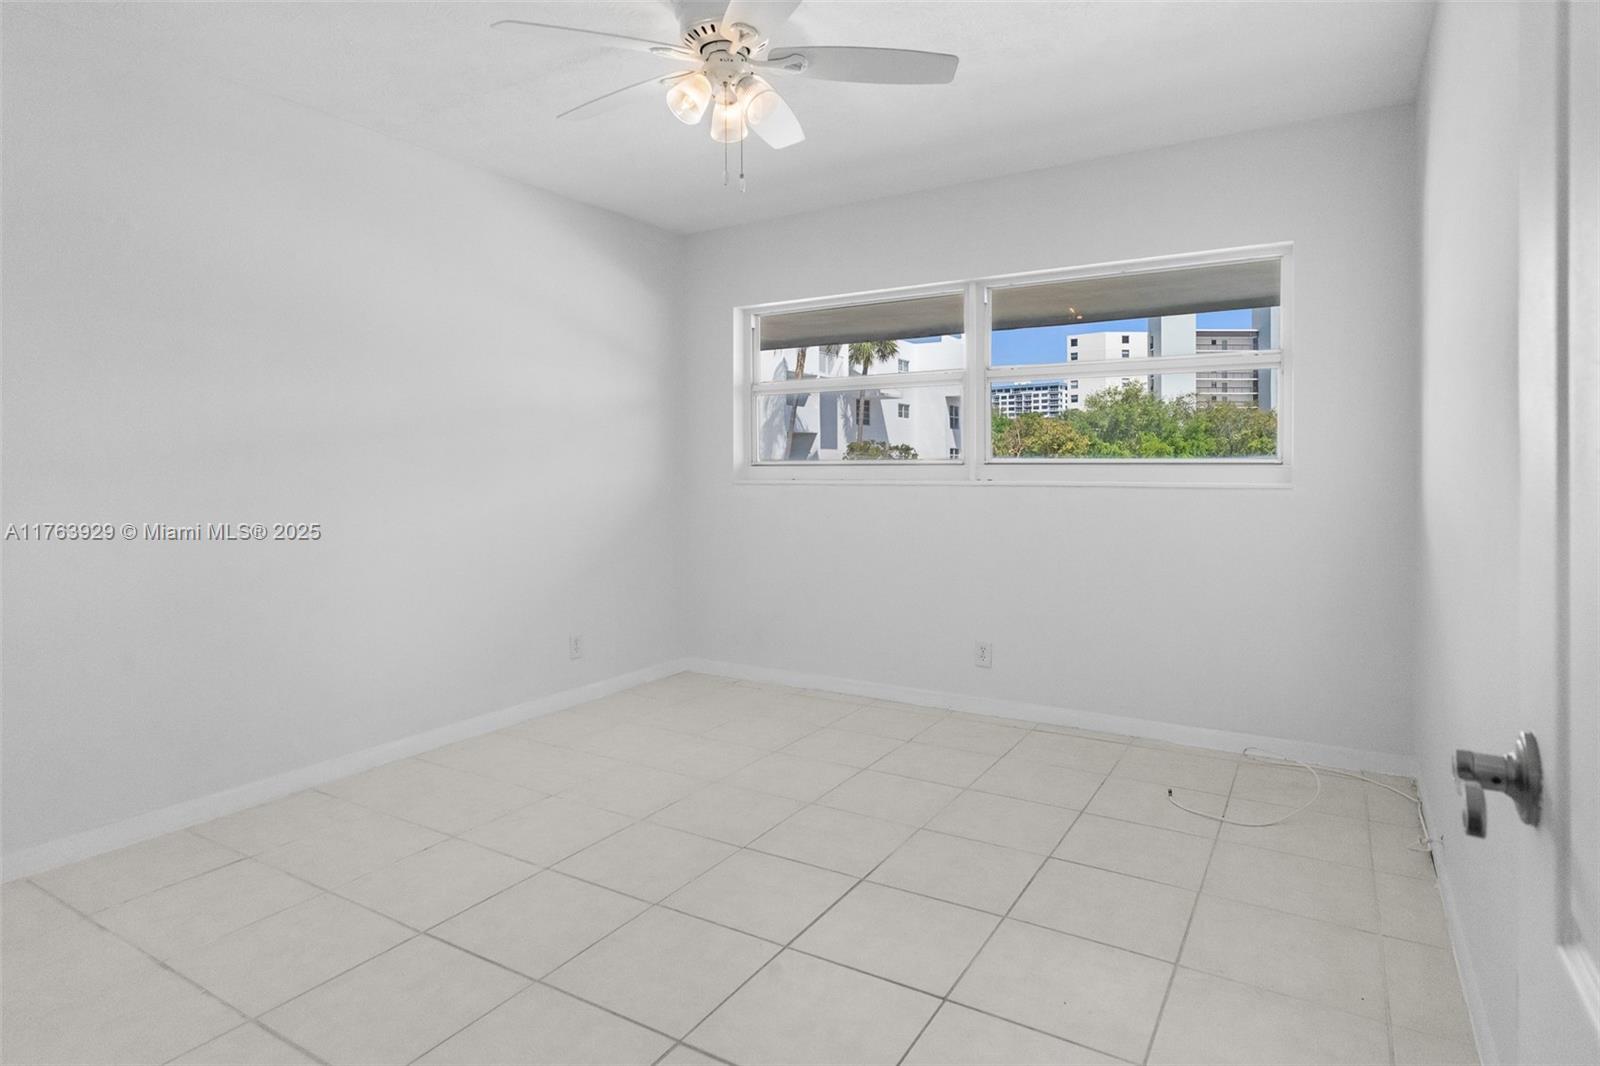
$259,000
2
bds
|
2
ba
|
1,190
sqft
|
built
1993
2334 S Cypress Bend Dr, Pompano Beach, FL 33069
$-381
Cash flow
-7.7%
Cash-on-Cash Return
4.5%
Cap rate
1.0%
Rent to Value Ratio
Active
$204,000
2
bds
|
2
ba
|
1,150
sqft
|
built
1971
2671 S Course Dr, Pompano Beach, FL 33069
$-707
Cash flow
-18.1%
Cash-on-Cash Return
2.1%
Cap rate
1.0%
Rent to Value Ratio

Active
$285,000
2
bds
|
1
ba
|
600
sqft
|
built
1955
2862 NW 4th St, Pompano Beach, FL 33069
$-641
Cash flow
-11.7%
Cash-on-Cash Return
3.6%
Cap rate
0.6%
Rent to Value Ratio
Active
$285,000
2
bds
|
2
ba
|
1,065
sqft
|
built
1969
1340 NE 28th Ave, Pompano Beach, FL 33062
$-789
Cash flow
-14.4%
Cash-on-Cash Return
3.0%
Cap rate
0.9%
Rent to Value Ratio
Active
$624,990
3
bds
|
2
ba
|
1,632
sqft
|
built
1959
1320 SE 4th Ave, Pompano Beach, FL 33060
$-812
Cash flow
-6.8%
Cash-on-Cash Return
4.7%
Cap rate
0.6%
Rent to Value Ratio
Active
$169,000
1
bds
|
2
ba
|
850
sqft
|
built
1980
3450 Blue Lake Dr, Pompano Beach, FL 33064
$-284
Cash flow
-8.8%
Cash-on-Cash Return
4.3%
Cap rate
0.9%
Rent to Value Ratio
Active
$540,000
2
bds
|
2
ba
|
1,200
sqft
|
built
1970
405 N Ocean Blvd, Pompano Beach, FL 33062
$-2,109
Cash flow
-20.4%
Cash-on-Cash Return
1.6%
Cap rate
0.6%
Rent to Value Ratio
Active
$523,900
2
bds
|
2
ba
|
1,150
sqft
|
built
1975
101 Briny Ave, Pompano Beach, FL 33062
$-2,488
Cash flow
-24.8%
Cash-on-Cash Return
0.6%
Cap rate
0.6%
Rent to Value Ratio
Active
$599,000
2
bds
|
2
ba
|
1,350
sqft
|
built
1971
2000 S Ocean Blvd, Pompano Beach, FL 33062
$-3,072
Cash flow
-26.8%
Cash-on-Cash Return
0.1%
Cap rate
0.5%
Rent to Value Ratio
Active
$250,000
1
bds
|
1
ba
|
800
sqft
|
built
1967
301 N Ocean Blvd, Pompano Beach, FL 33062
$-434
Cash flow
-9.1%
Cash-on-Cash Return
4.2%
Cap rate
0.8%
Rent to Value Ratio

Active
$330,000
3
bds
|
2
ba
|
1,390
sqft
|
built
1981
3520 Oaks Way, Pompano Beach, FL 33069
$-1,429
Cash flow
-22.6%
Cash-on-Cash Return
1.1%
Cap rate
0.8%
Rent to Value Ratio
Active
$199,000
1
bds
|
1
ba
|
713
sqft
|
built
1989
4201 W Mc Nab Rd, Pompano Beach, FL 33069
$-476
Cash flow
-12.5%
Cash-on-Cash Return
3.4%
Cap rate
0.9%
Rent to Value Ratio
Active
$3,449,900
4
bds
|
5
ba
|
2,505
sqft
|
built
2019
730 N Ocean Blvd, Pompano Beach, FL 33062
$-17,606
Cash flow
-26.6%
Cash-on-Cash Return
0.2%
Cap rate
0.3%
Rent to Value Ratio

Active
$440,000
3
bds
|
1
ba
|
1,390
sqft
|
built
1961
665 NW 19th St, Pompano Beach, FL 33060
$-859
Cash flow
-10.2%
Cash-on-Cash Return
3.9%
Cap rate
0.6%
Rent to Value Ratio
Active
$369,000
3
bds
|
3
ba
|
1,710
sqft
|
built
1980
3095 N Course Dr, Pompano Beach, FL 33069
$-954
Cash flow
-13.5%
Cash-on-Cash Return
3.2%
Cap rate
0.8%
Rent to Value Ratio