Quincy, MA Investment Properties for Sale
Browse homes for sale and investment properties in Quincy, MA. Refine your search by price, property type, or more.
Best cash flowing properties in Quincy, MA
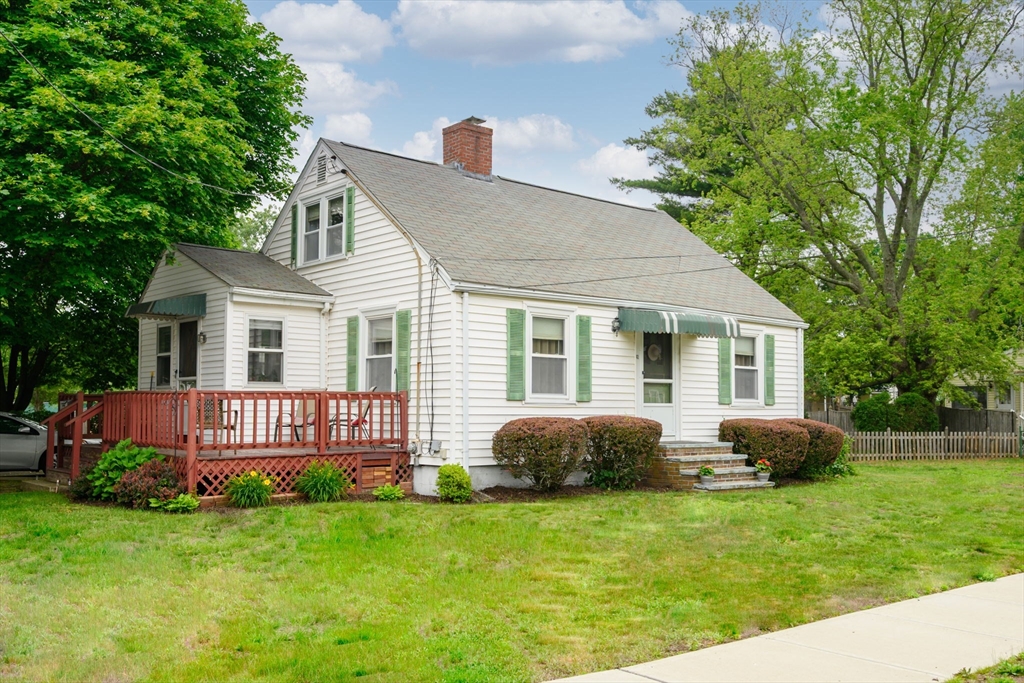
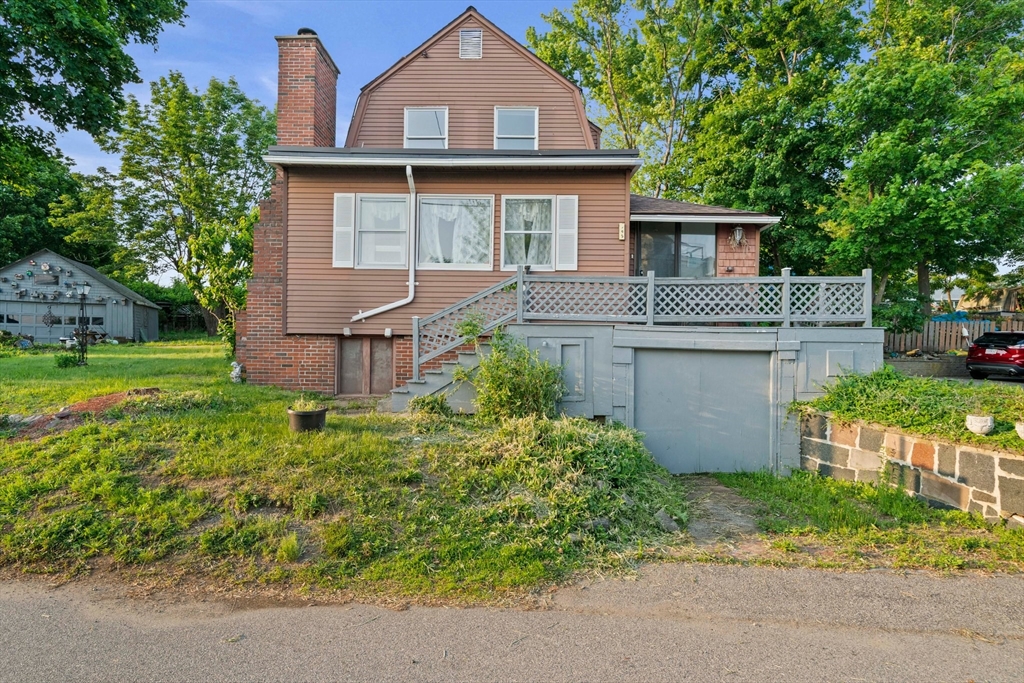
Active under contract
$475,000
2
bds
|
1
ba
|
1,307
sqft
|
built
1941
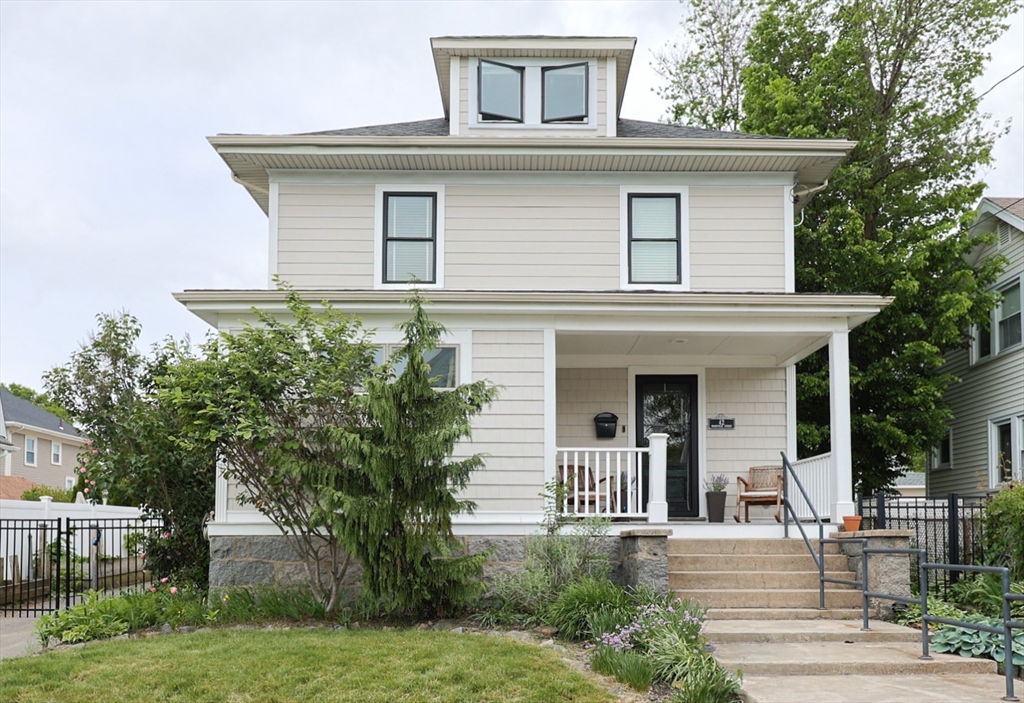
41 Hyde St, Quincy, MA 02169
$-573
Cash flow
-6.3%
Cash-on-Cash Return
4.2%
Cap rate
0.7%
Rent to Value Ratio

Active
$299,900
1
bds
|
1
ba
|
652
sqft
|
built
1965
766 Willard St, Quincy, MA 02169
$-656
Cash flow
-11.4%
Cash-on-Cash Return
3.1%
Cap rate
0.7%
Rent to Value Ratio
93 out of 120 properties for sale in Quincy, MA
Limited Results Shown
Create a free account, or log in to reveal all property listings and enjoy the complete experience.
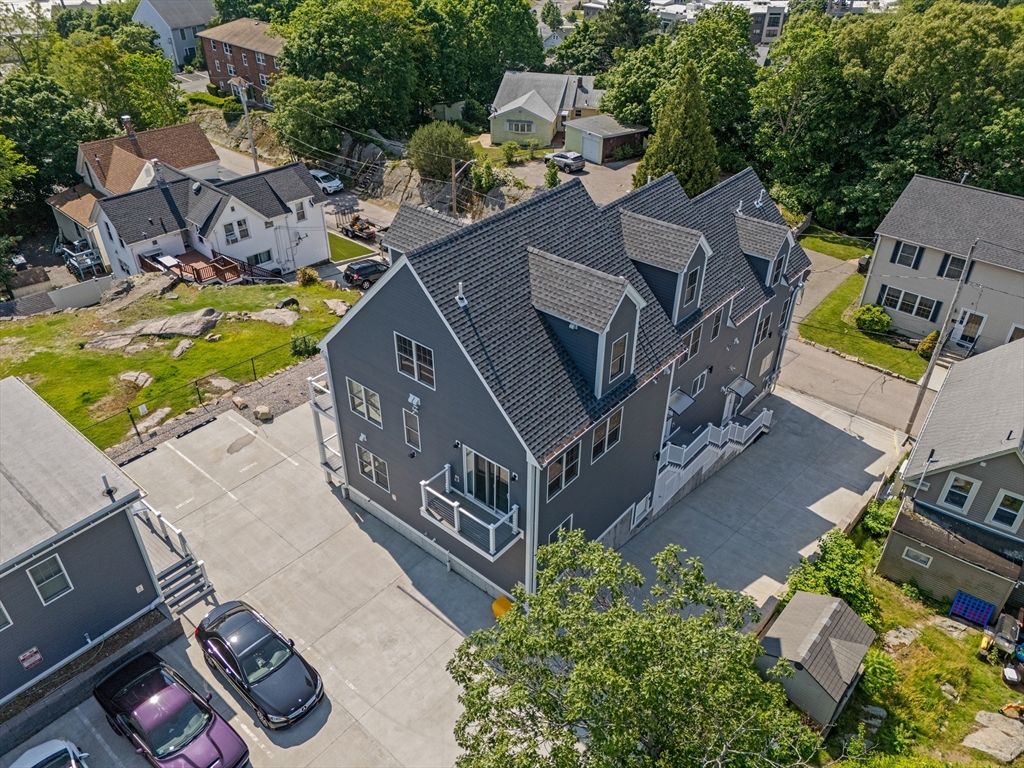
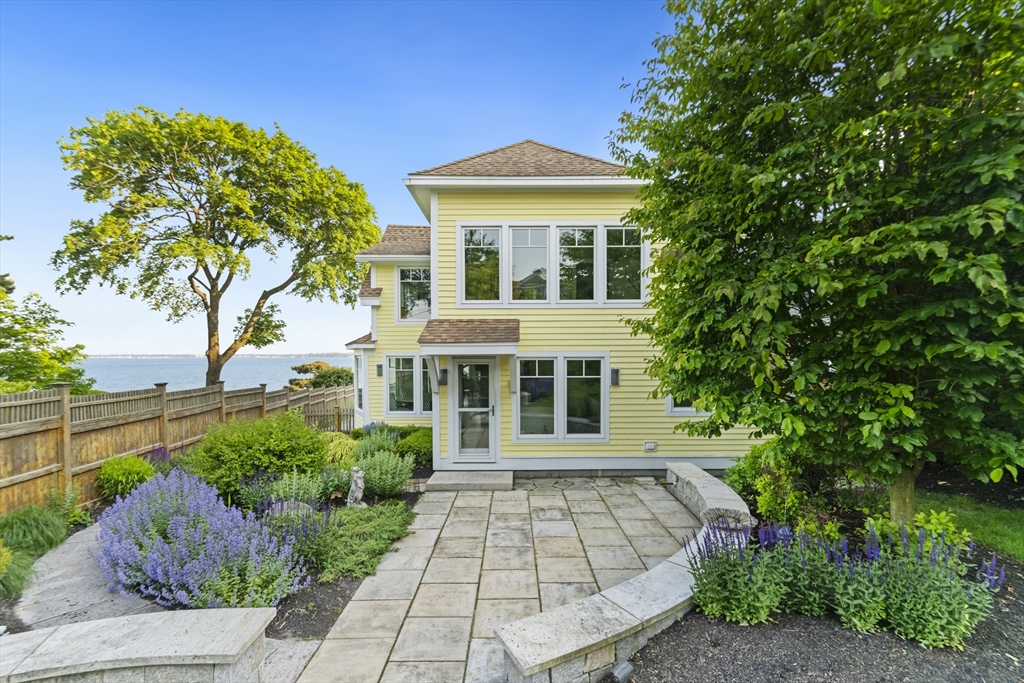
Active
$829,000
3
bds
|
4
ba
|
1,916
sqft
|
built
2021
47 Parker St, Quincy, MA 02169
$-2,518
Cash flow
-15.8%
Cash-on-Cash Return
2.0%
Cap rate
0.4%
Rent to Value Ratio
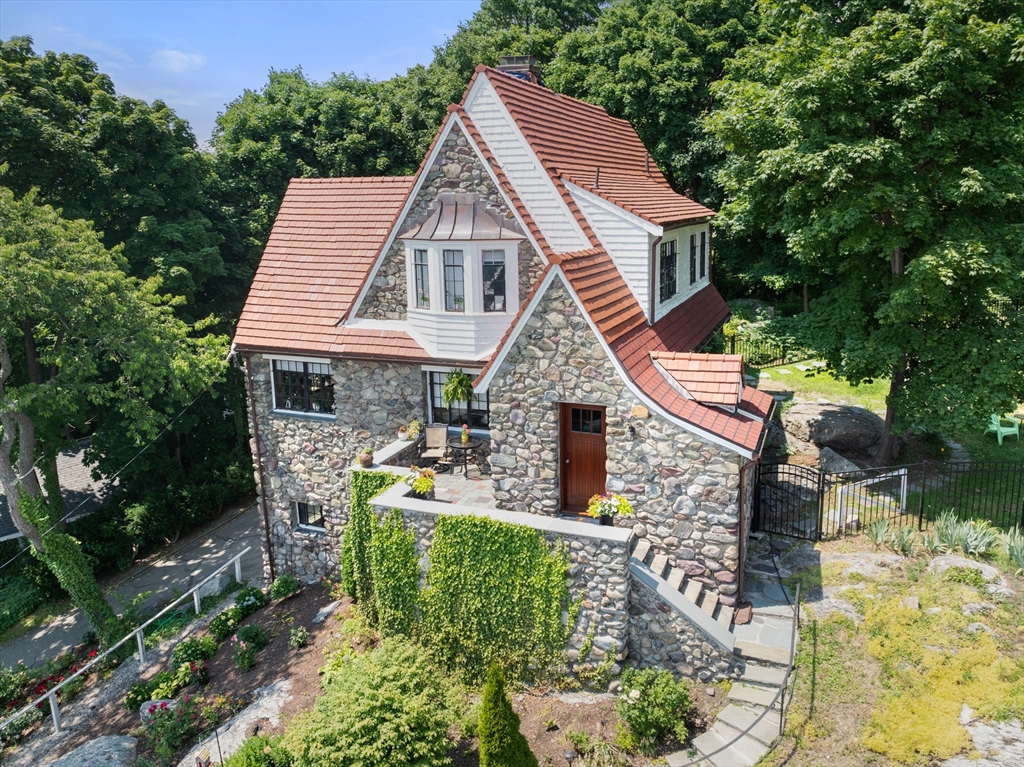
Active
$2,399,000
3
bds
|
5
ba
|
2,500
sqft
|
built
1910
63 Crabtree Rd, Quincy, MA 02171
$-7,983
Cash flow
-17.4%
Cash-on-Cash Return
1.7%
Cap rate
0.3%
Rent to Value Ratio
Active
$299,900
1
bds
|
1
ba
|
652
sqft
|
built
1965
766 Willard St, Quincy, MA 02169
$-656
Cash flow
-11.4%
Cash-on-Cash Return
3.1%
Cap rate
0.7%
Rent to Value Ratio
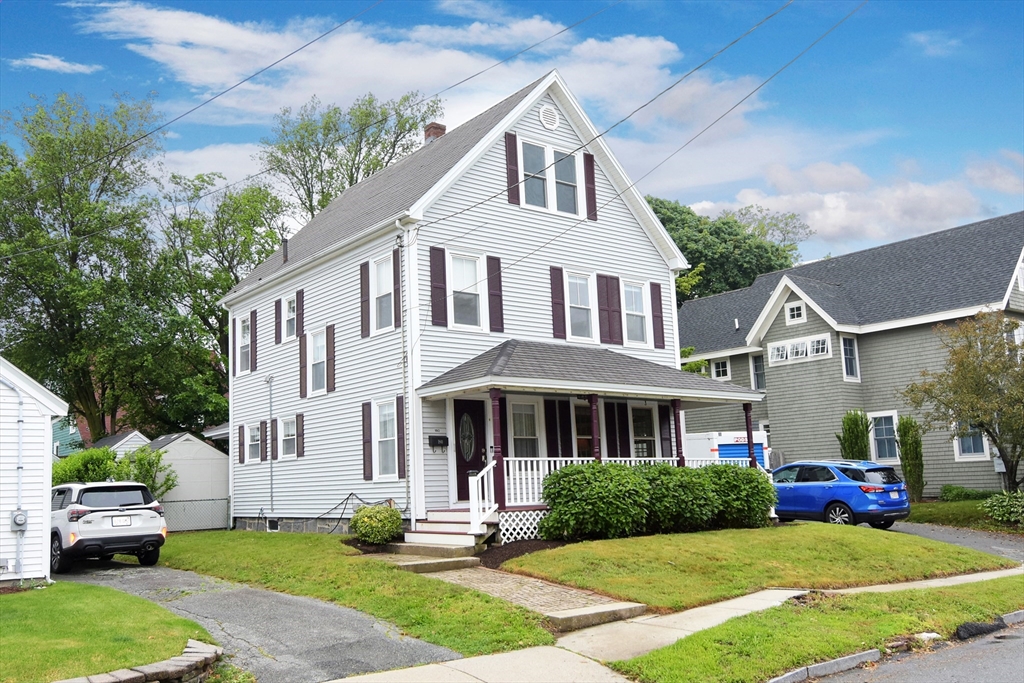
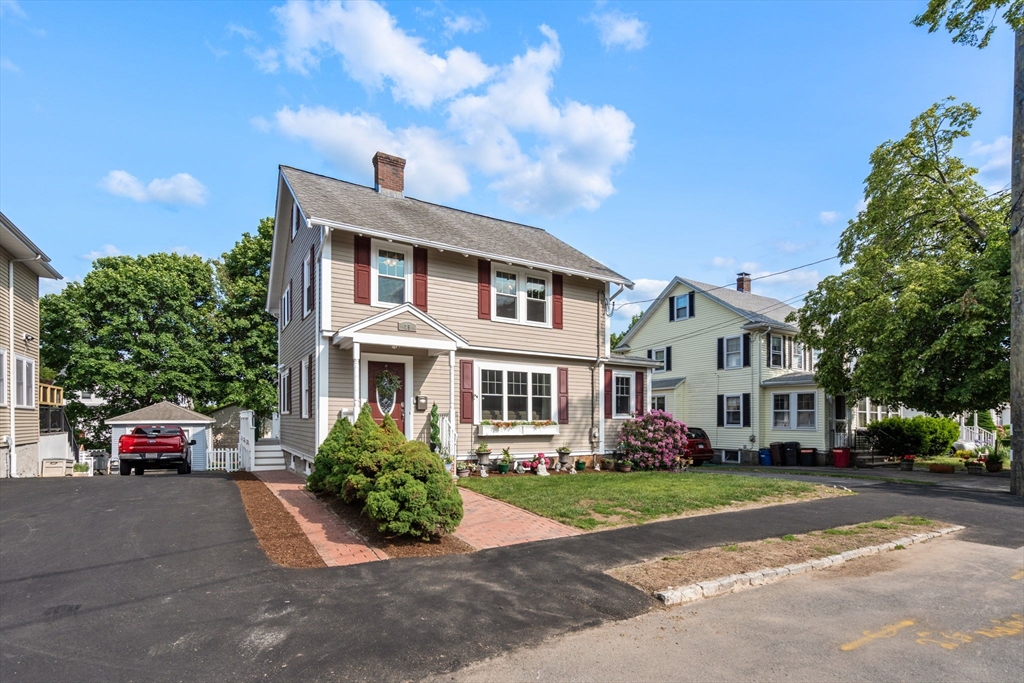
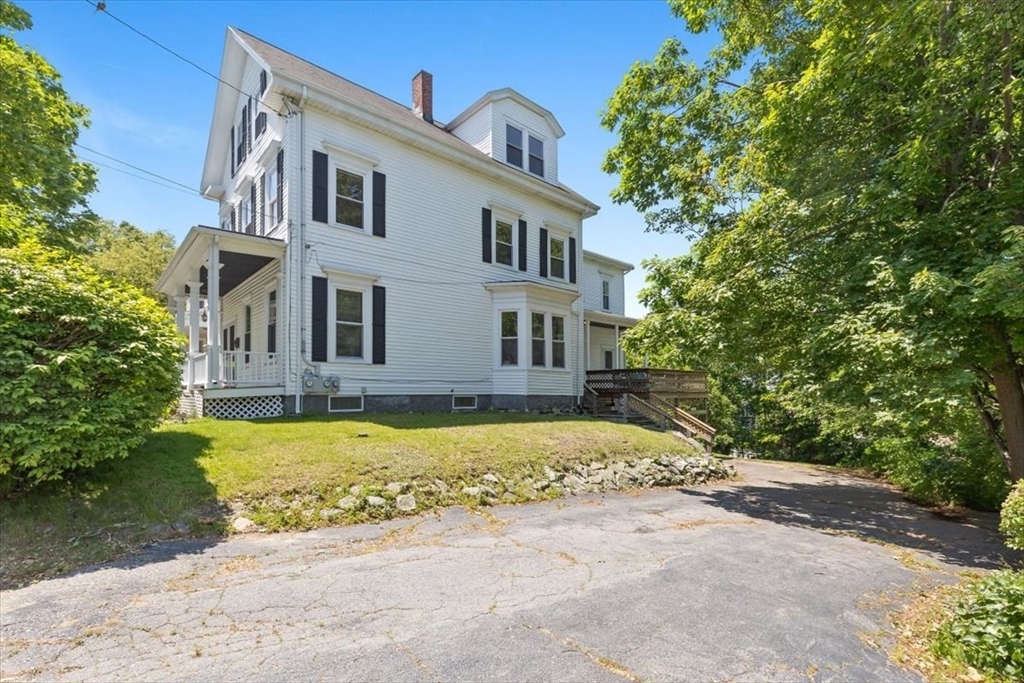
Pending
$799,900
5
bds
|
2
ba
|
1,800
sqft
|
built
1900
180 Davis St, Quincy, MA 02170
$-2,029
Cash flow
-13.2%
Cash-on-Cash Return
2.6%
Cap rate
0.4%
Rent to Value Ratio
Active
$329,900
1
bds
|
1
ba
|
629
sqft
|
built
1966
475-479 Sea St, Quincy, MA 02169
$-779
Cash flow
-12.3%
Cash-on-Cash Return
2.8%
Cap rate
0.6%
Rent to Value Ratio
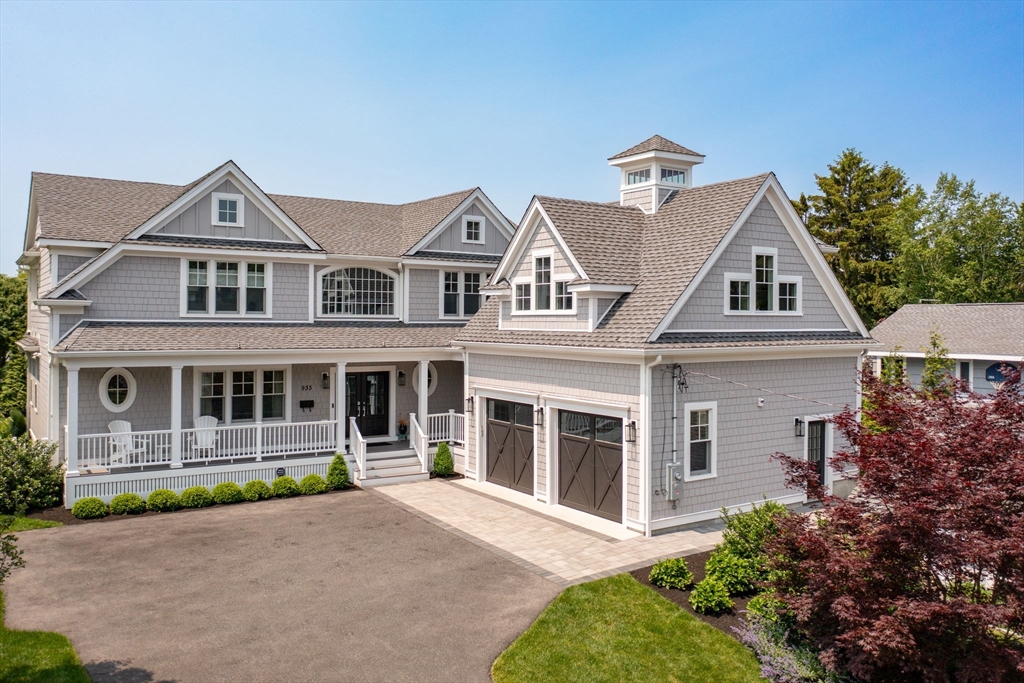
Active
$2,699,000
4
bds
|
6
ba
|
4,600
sqft
|
built
2021
935 E Squantum St, Quincy, MA 02171
$-8,039
Cash flow
-15.5%
Cash-on-Cash Return
2.1%
Cap rate
0.4%
Rent to Value Ratio
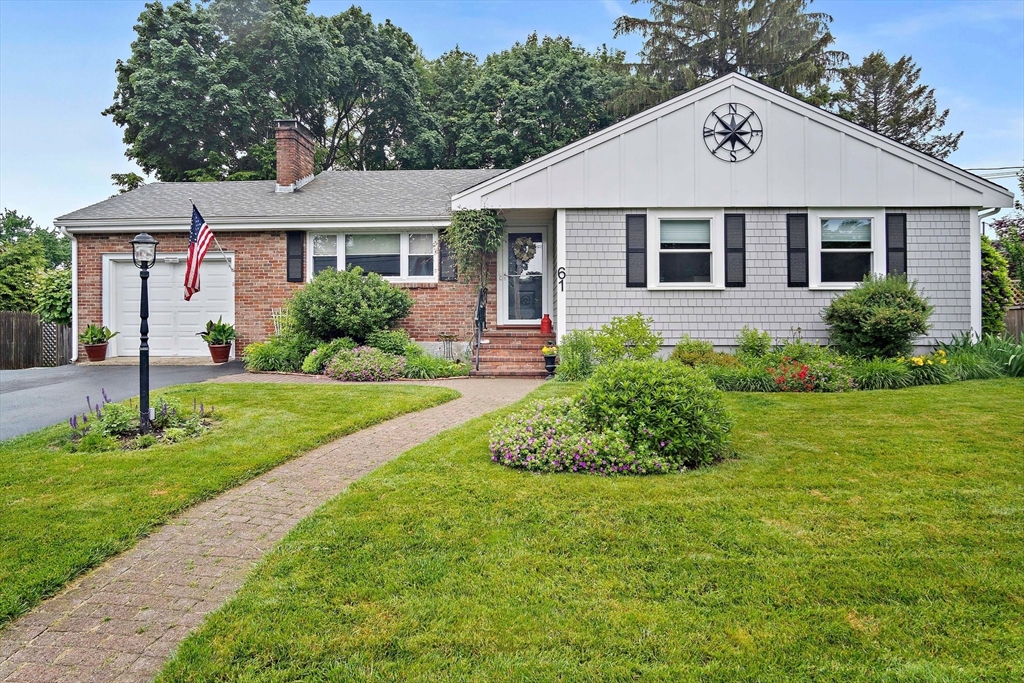
Active
$749,900
3
bds
|
2
ba
|
2,256
sqft
|
built
1955
61 Hillsboro St, Quincy, MA 02169
$-1,689
Cash flow
-11.8%
Cash-on-Cash Return
3.0%
Cap rate
0.5%
Rent to Value Ratio
Active
$699,900
4
bds
|
2
ba
|
1,216
sqft
|
built
1953
174 N Central Ave, Quincy, MA 02170
$-1,471
Cash flow
-11.0%
Cash-on-Cash Return
3.2%
Cap rate
0.5%
Rent to Value Ratio
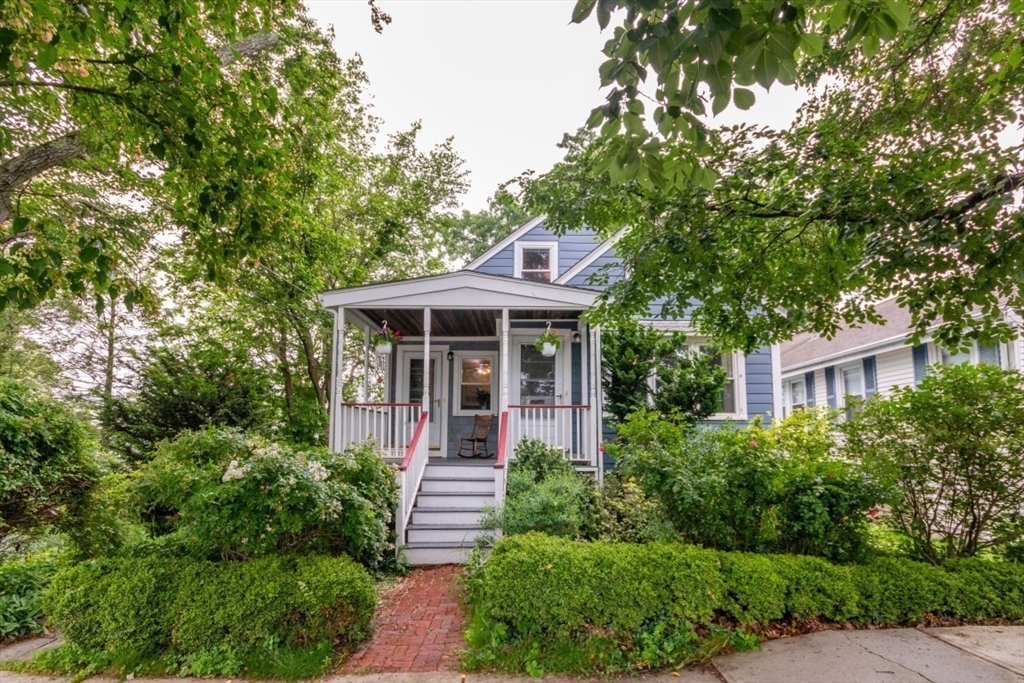
Active
$724,999
3
bds
|
2
ba
|
1,829
sqft
|
built
1880
295 Rock Island Rd, Quincy, MA 02169
$-1,650
Cash flow
-11.9%
Cash-on-Cash Return
2.9%
Cap rate
0.5%
Rent to Value Ratio
Active under contract
$475,000
2
bds
|
1
ba
|
1,307
sqft
|
built
1941
41 Hyde St, Quincy, MA 02169
$-573
Cash flow
-6.3%
Cash-on-Cash Return
4.2%
Cap rate
0.7%
Rent to Value Ratio
Active
$2,400,000
3
bds
|
3
ba
|
3,183
sqft
|
built
1925
50 Surfside Ln, Quincy, MA 02171
$-8,842
Cash flow
-19.2%
Cash-on-Cash Return
1.3%
Cap rate
0.2%
Rent to Value Ratio
Active
$975,000
5
bds
|
4
ba
|
3,087
sqft
|
built
1925
25 Victory Ave, Quincy, MA 02169
$-2,657
Cash flow
-14.2%
Cash-on-Cash Return
2.4%
Cap rate
0.4%
Rent to Value Ratio
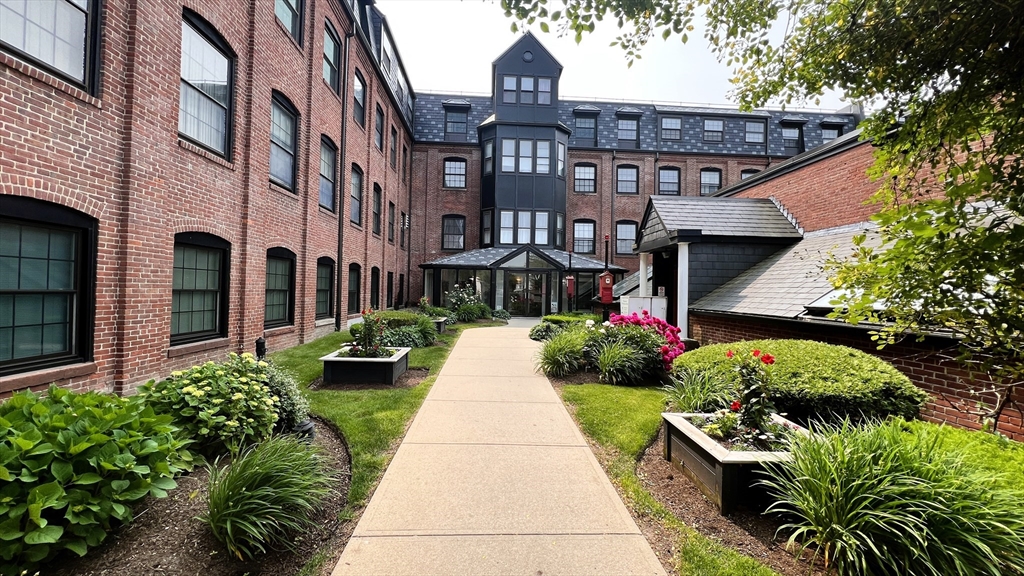
Active
$679,000
2
bds
|
2
ba
|
1,145
sqft
|
built
2017
999 Hancock St, Quincy, MA 02169
$-2,285
Cash flow
-17.6%
Cash-on-Cash Return
1.6%
Cap rate
0.5%
Rent to Value Ratio
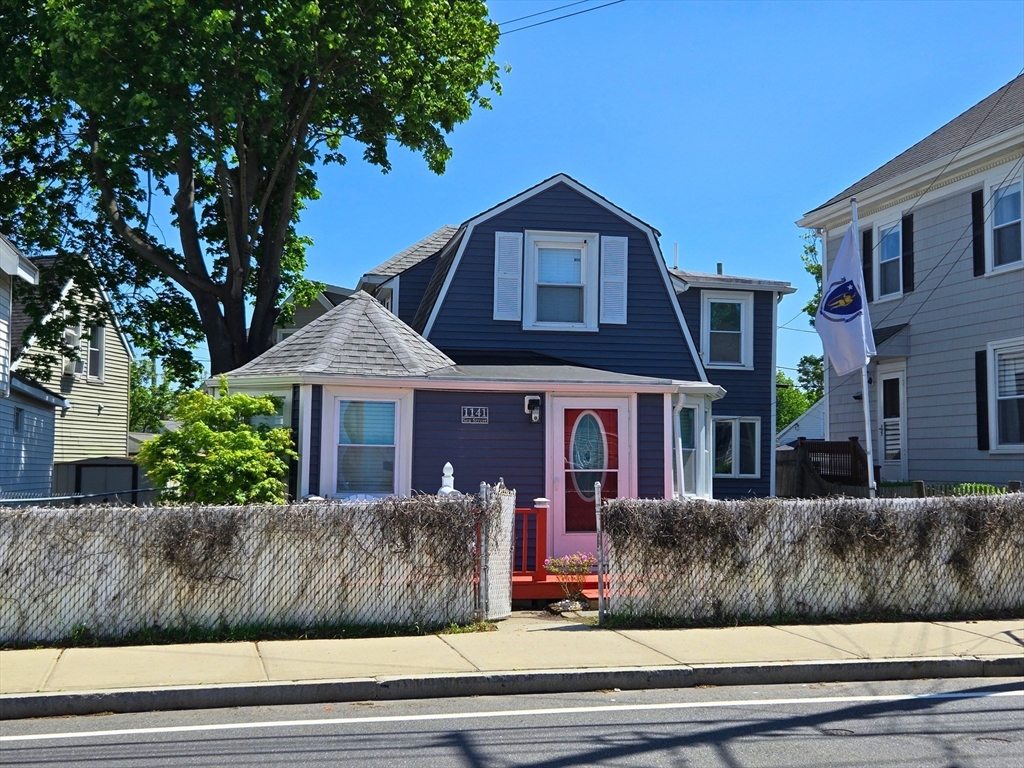
Active
$589,888
2
bds
|
2
ba
|
1,374
sqft
|
built
1900
1141 Sea St, Quincy, MA 02169
$-1,072
Cash flow
-9.5%
Cash-on-Cash Return
3.5%
Cap rate
0.5%
Rent to Value Ratio
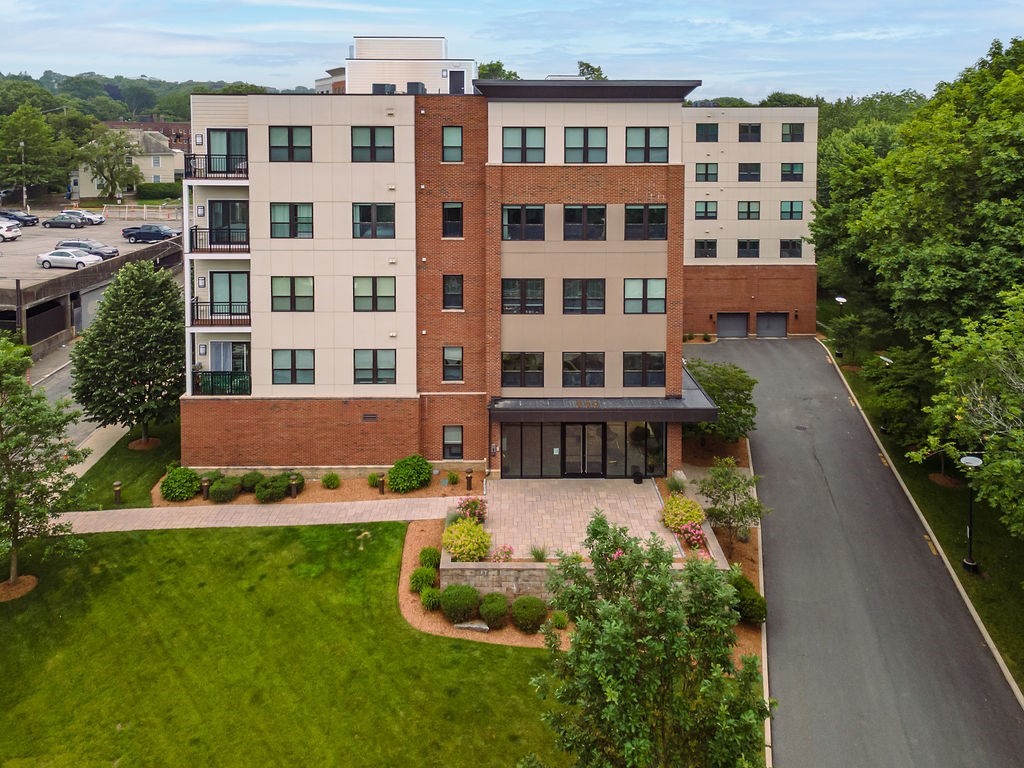
Active
$349,000
1
bds
|
1
ba
|
644
sqft
|
built
1985
133 Commander Shea Blvd, Quincy, MA 02171
$-1,228
Cash flow
-18.4%
Cash-on-Cash Return
1.5%
Cap rate
0.6%
Rent to Value Ratio
Active
$679,900
2
bds
|
2
ba
|
1,161
sqft
|
built
2017
999 Hancock St, Quincy, MA 02169
$-2,035
Cash flow
-15.6%
Cash-on-Cash Return
2.1%
Cap rate
0.5%
Rent to Value Ratio
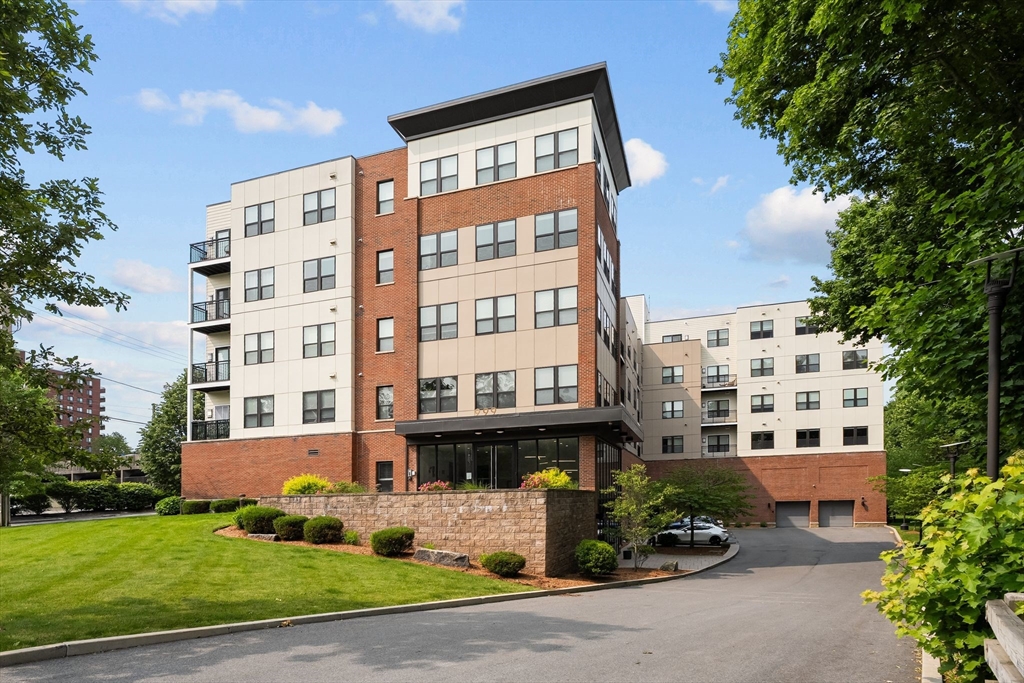
Active
$995,000
2
bds
|
2
ba
|
1,362
sqft
|
built
2021
60 Newbury St, Quincy, MA 02171
$-2,159
Cash flow
-11.3%
Cash-on-Cash Return
3.1%
Cap rate
0.6%
Rent to Value Ratio
Active
$899,900
4
bds
|
2
ba
|
1,666
sqft
|
built
1927
33 Samoset Ave, Quincy, MA 02169
$-2,457
Cash flow
-14.2%
Cash-on-Cash Return
2.4%
Cap rate
0.4%
Rent to Value Ratio
Active
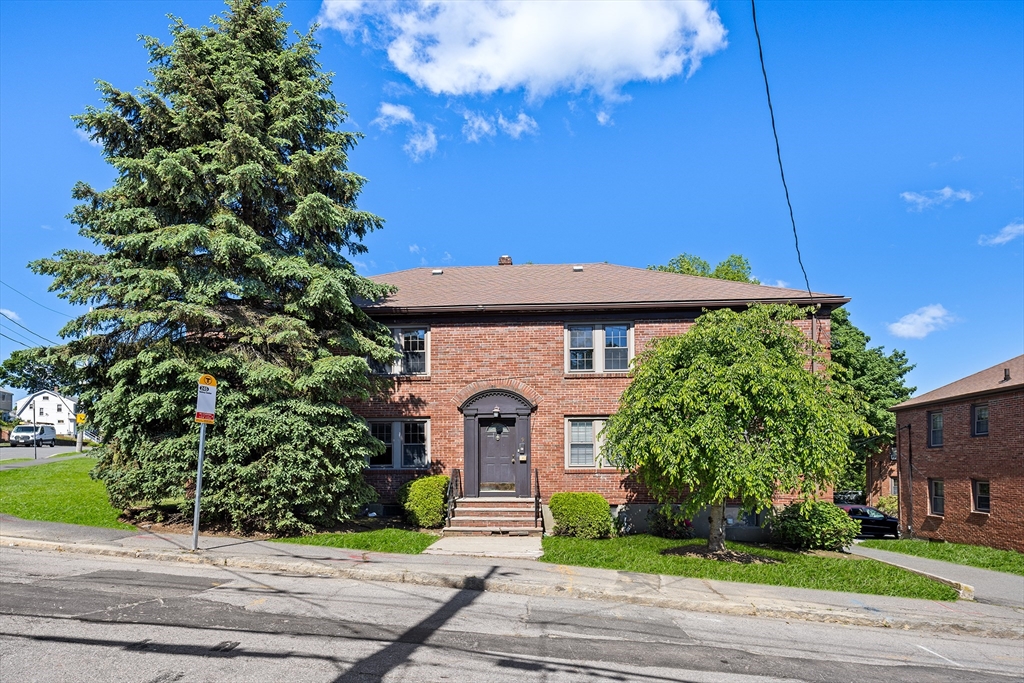
$659,000
4
bds
|
2
ba
|
1,680
sqft
|
built
1918
18 Whiton Ave, Quincy, MA 02169
$-1,174
Cash flow
-9.3%
Cash-on-Cash Return
3.5%
Cap rate
0.5%
Rent to Value Ratio
Active
$688,000
3
bds
|
3
ba
|
1,587
sqft
|
built
1989
35 Merrymount Rd, Quincy, MA 02169
$-1,910
Cash flow
-14.5%
Cash-on-Cash Return
2.3%
Cap rate
0.5%
Rent to Value Ratio
Active
$649,000
3
bds
|
2
ba
|
1,365
sqft
|
built
1977
72 Turner St, Quincy, MA 02169
$-1,378
Cash flow
-11.1%
Cash-on-Cash Return
3.1%
Cap rate
0.5%
Rent to Value Ratio
Active
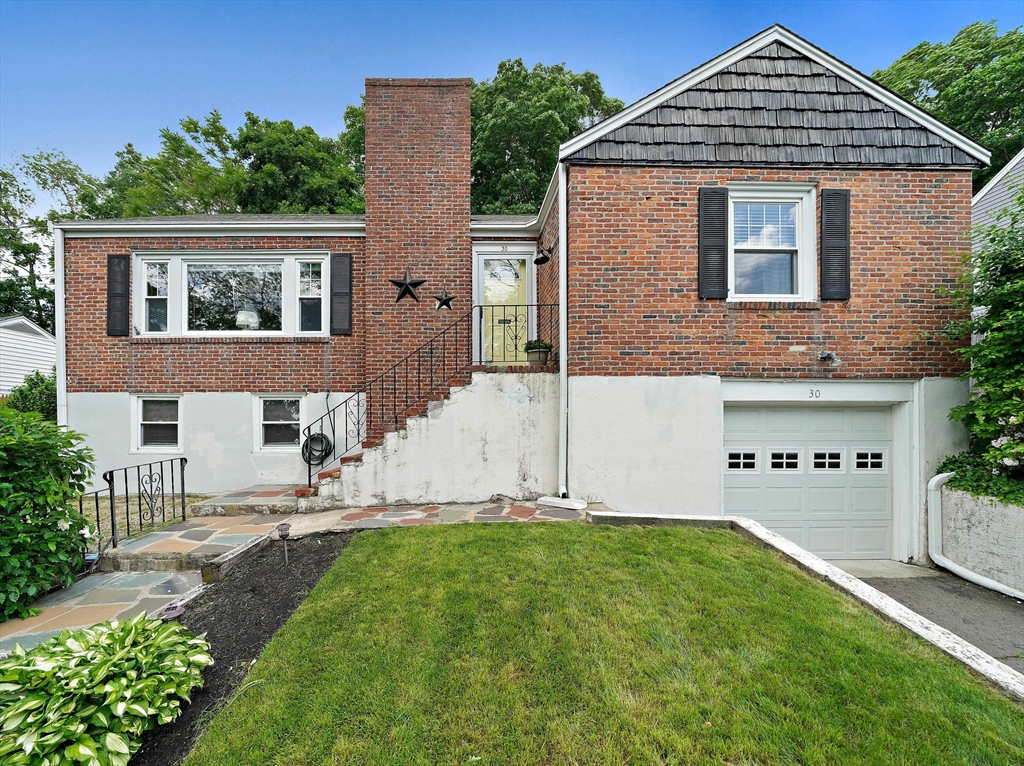
$745,000
2
bds
|
2
ba
|
1,960
sqft
|
built
1952
30 Forbes Hill Rd, Quincy, MA 02170
$-1,759
Cash flow
-12.3%
Cash-on-Cash Return
2.8%
Cap rate
0.5%
Rent to Value Ratio

Active
$699,000
2
bds
|
3
ba
|
1,759
sqft
|
built
2018
27 Mill St, Quincy, MA 02169
$-1,755
Cash flow
-13.1%
Cash-on-Cash Return
2.7%
Cap rate
0.5%
Rent to Value Ratio
Active under contract
$850,000
4
bds
|
2
ba
|
1,864
sqft
|
built
1905
42 Bromfield St, Quincy, MA 02170
$-1,730
Cash flow
-10.6%
Cash-on-Cash Return
3.2%
Cap rate
0.5%
Rent to Value Ratio
Active
$439,900
2
bds
|
1
ba
|
810
sqft
|
built
1987
21 Linden St, Quincy, MA 02170
$-1,350
Cash flow
-16.0%
Cash-on-Cash Return
2.0%
Cap rate
0.5%
Rent to Value Ratio
Active
$1,199,000
5
bds
|
2
ba
|
3,064
sqft
|
built
1900
107 Lincoln Ave, Quincy, MA 02170
$-4,641
Cash flow
-20.2%
Cash-on-Cash Return
1.0%
Cap rate
0.3%
Rent to Value Ratio
Active
$319,900
1
bds
|
1
ba
|
722
sqft
|
built
1988
230 Willard St, Quincy, MA 02169
$-832
Cash flow
-13.6%
Cash-on-Cash Return
2.6%
Cap rate
0.7%
Rent to Value Ratio
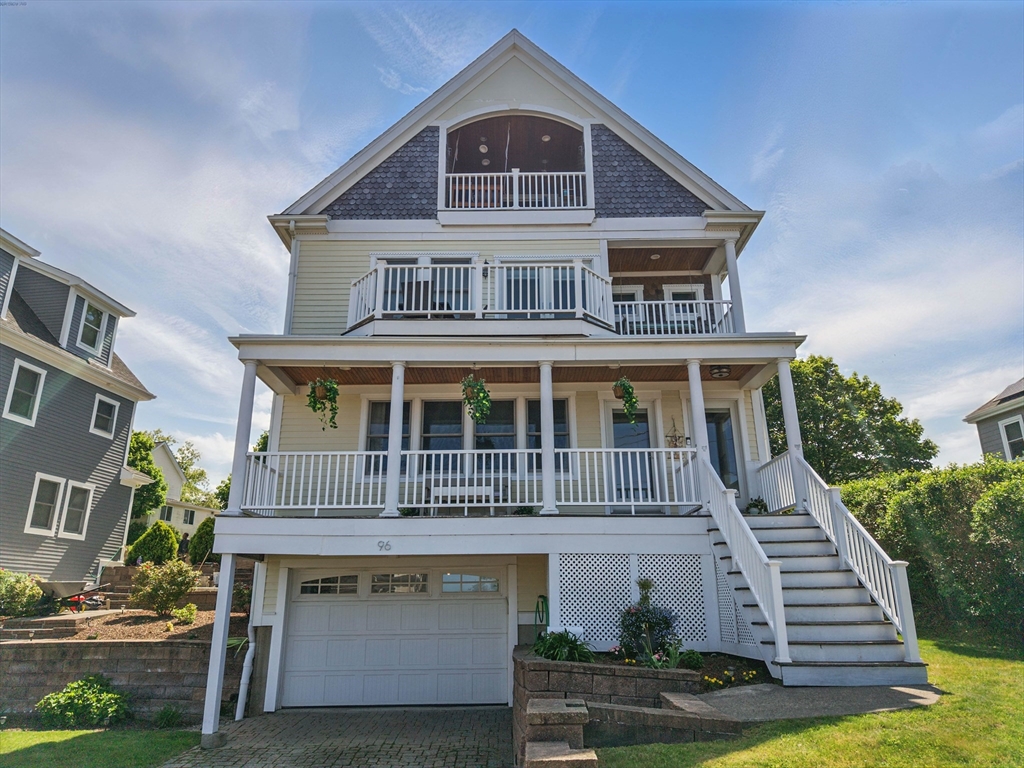
Active
$1,349,000
3
bds
|
4
ba
|
2,500
sqft
|
built
2007
96 Sea Ave, Quincy, MA 02169
$-3,990
Cash flow
-15.4%
Cash-on-Cash Return
2.1%
Cap rate
0.4%
Rent to Value Ratio
Active
$524,900
2
bds
|
2
ba
|
1,214
sqft
|
built
1973
215 Thomas Burgin Pkwy, Quincy, MA 02169
$-1,027
Cash flow
-10.2%
Cash-on-Cash Return
3.3%
Cap rate
0.5%
Rent to Value Ratio

Active
$419,900
2
bds
|
2
ba
|
943
sqft
|
built
1975
459 Willard St, Quincy, MA 02169
$-1,138
Cash flow
-14.1%
Cash-on-Cash Return
2.4%
Cap rate
0.6%
Rent to Value Ratio
Active
$799,900
3
bds
|
2
ba
|
1,866
sqft
|
built
1900
31 Graham St, Quincy, MA 02169
$-2,530
Cash flow
-16.5%
Cash-on-Cash Return
1.9%
Cap rate
0.4%
Rent to Value Ratio
Active
$1,349,000
4
bds
|
3
ba
|
2,580
sqft
|
built
1953
107 Essex St, Quincy, MA 02171
$-4,938
Cash flow
-19.1%
Cash-on-Cash Return
1.3%
Cap rate
0.3%
Rent to Value Ratio
Active
$2,250,000
10
bds
|
6
ba
|
5,232
sqft
|
built
1980
51 Stoughton St, Quincy, MA 02169
$-9,993
Cash flow
-23.2%
Cash-on-Cash Return
0.3%
Cap rate
0.1%
Rent to Value Ratio
Active
$699,900
4
bds
|
2
ba
|
1,344
sqft
|
built
1920
5 Ellington Rd, Quincy, MA 02170
$-1,754
Cash flow
-13.1%
Cash-on-Cash Return
2.7%
Cap rate
0.4%
Rent to Value Ratio
Active
$699,000
3
bds
|
2
ba
|
1,416
sqft
|
built
1900
143 Arlington St, Quincy, MA 02170
$-1,668
Cash flow
-12.5%
Cash-on-Cash Return
2.8%
Cap rate
0.5%
Rent to Value Ratio

Active
$509,000
2
bds
|
2
ba
|
1,232
sqft
|
built
1972
211 West St, Quincy, MA 02169
$-1,482
Cash flow
-15.2%
Cash-on-Cash Return
2.2%
Cap rate
0.6%
Rent to Value Ratio
Active
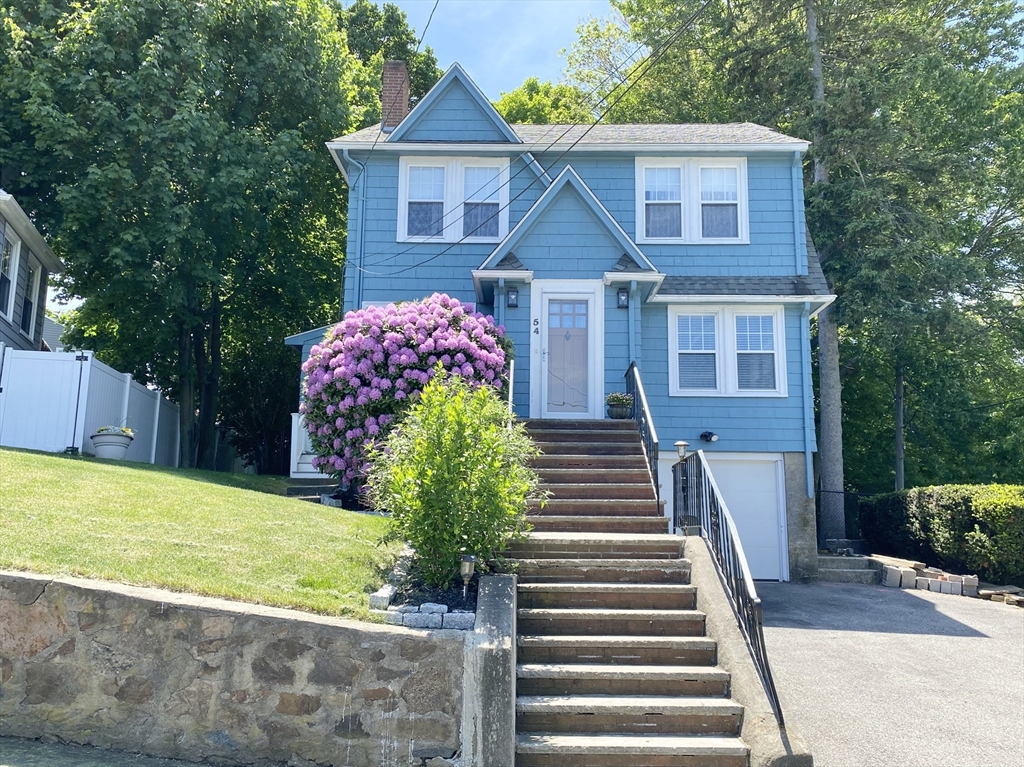
$773,900
3
bds
|
2
ba
|
1,916
sqft
|
built
1930
54 Hilltop St, Quincy, MA 02169
$-1,863
Cash flow
-12.6%
Cash-on-Cash Return
2.8%
Cap rate
0.5%
Rent to Value Ratio
Active
$429,900
2
bds
|
1
ba
|
726
sqft
|
built
1960
9 Common St, Quincy, MA 02169
$-1,064
Cash flow
-12.9%
Cash-on-Cash Return
2.7%
Cap rate
0.5%
Rent to Value Ratio
Active
$999,999
3
bds
|
2
ba
|
2,144
sqft
|
built
1960
196 Plymouth Ave, Quincy, MA 02169
$-2,675
Cash flow
-14.0%
Cash-on-Cash Return
2.5%
Cap rate
0.4%
Rent to Value Ratio
Active
$1,200,000
4
bds
|
2
ba
|
2,400
sqft
|
built
1960
309 Farrington St, Quincy, MA 02170
$-5,077
Cash flow
-22.1%
Cash-on-Cash Return
0.6%
Cap rate
0.2%
Rent to Value Ratio