Quincy, MA Investment Properties for Sale
Browse homes for sale and investment properties in Quincy, MA. Refine your search by price, property type, or more.
Best cash flowing properties in Quincy, MA
Active
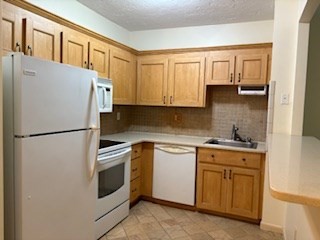
$276,000
1
bds
|
1
ba
|
445
sqft
|
built
1964
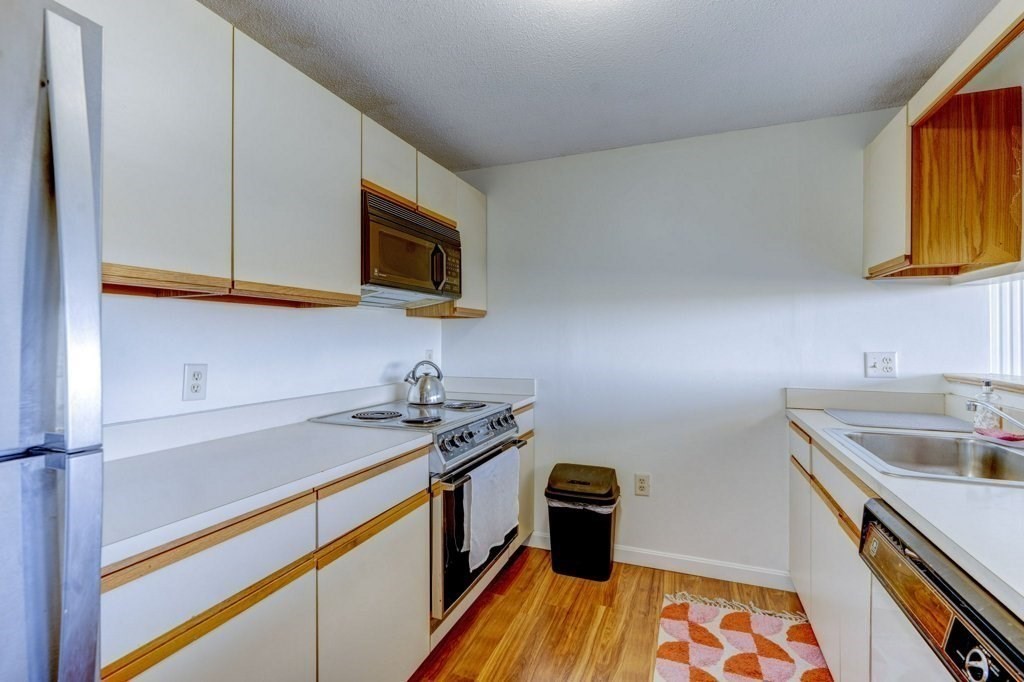
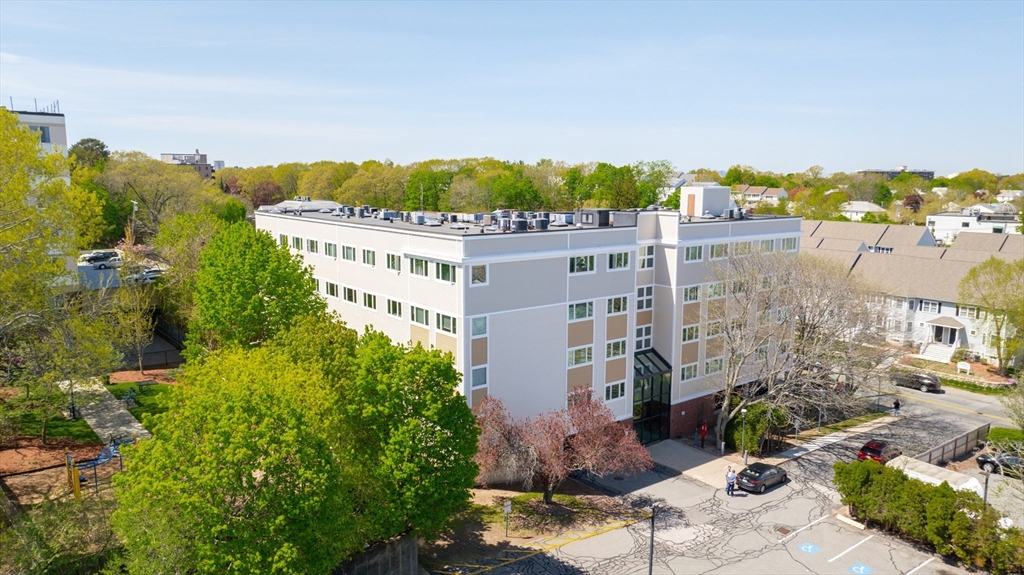
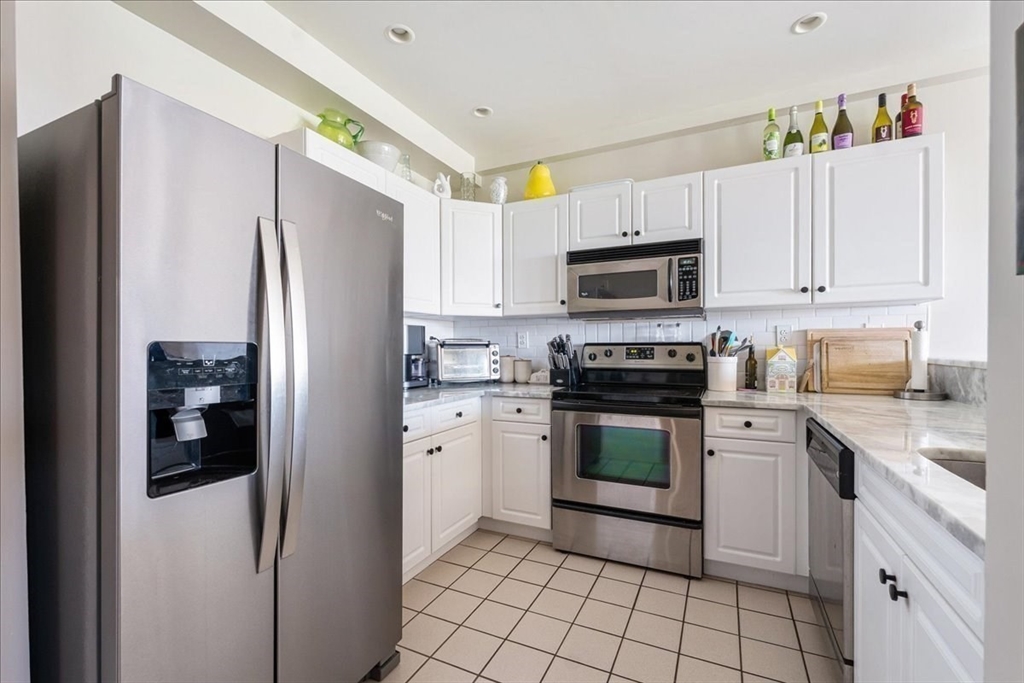
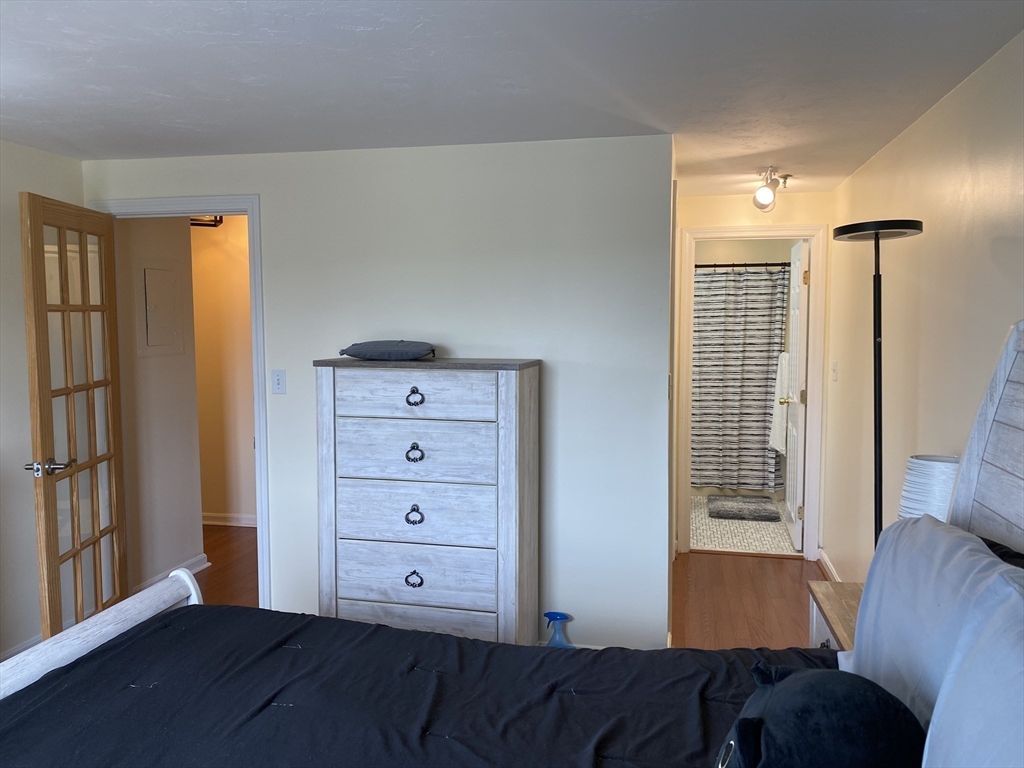
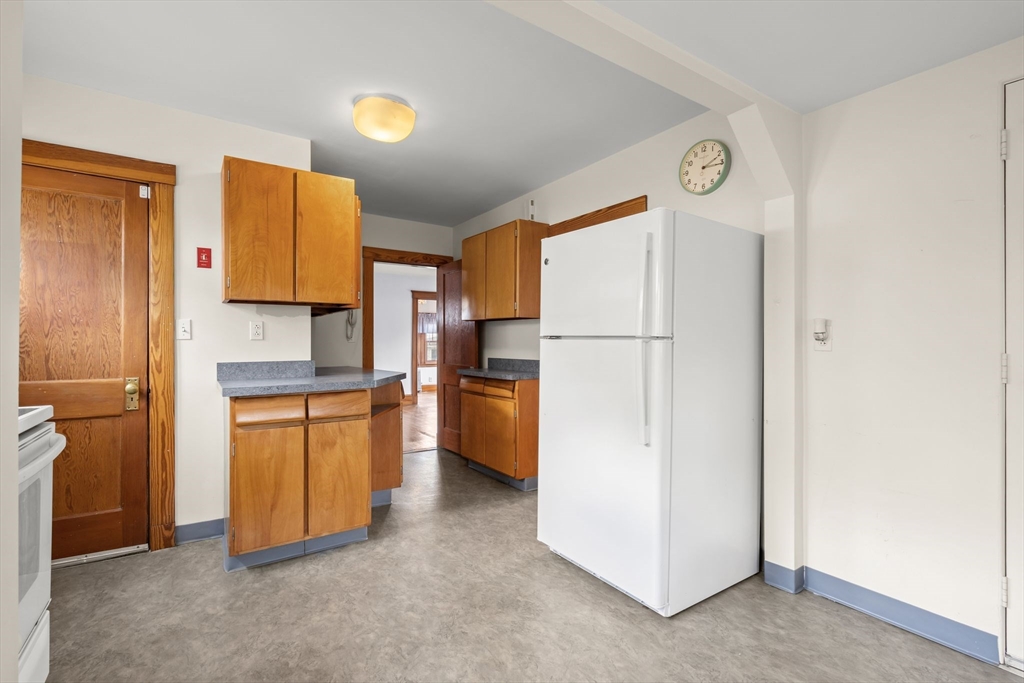
1025 Hancock St, Quincy, MA 02169
$-528
Cash flow
-10.0%
Cash-on-Cash Return
3.4%
Cap rate
0.7%
Rent to Value Ratio
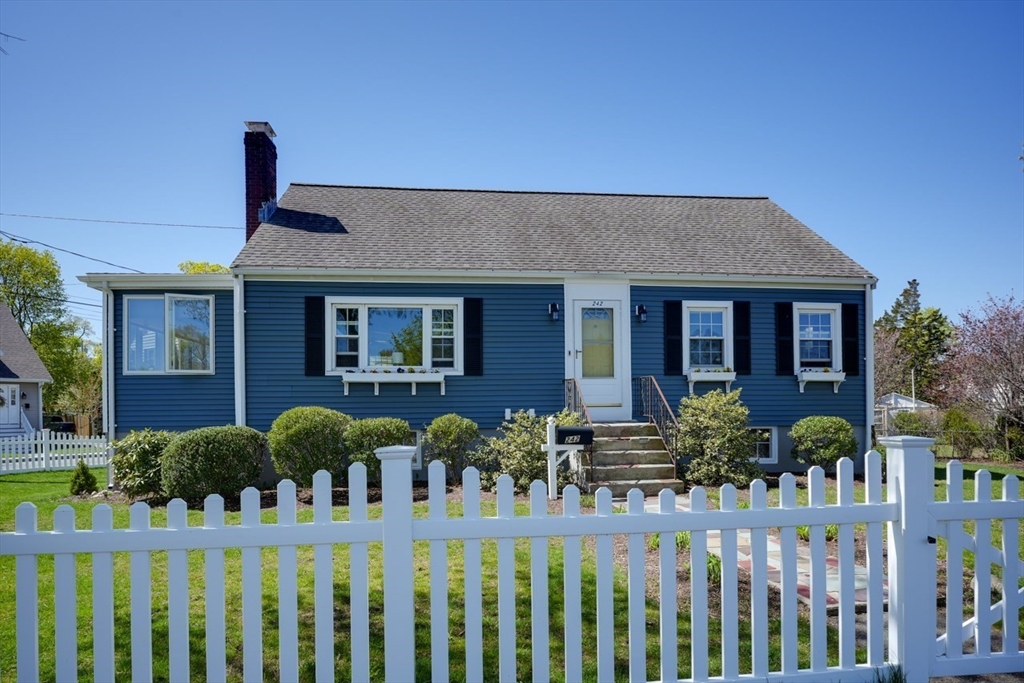
Active
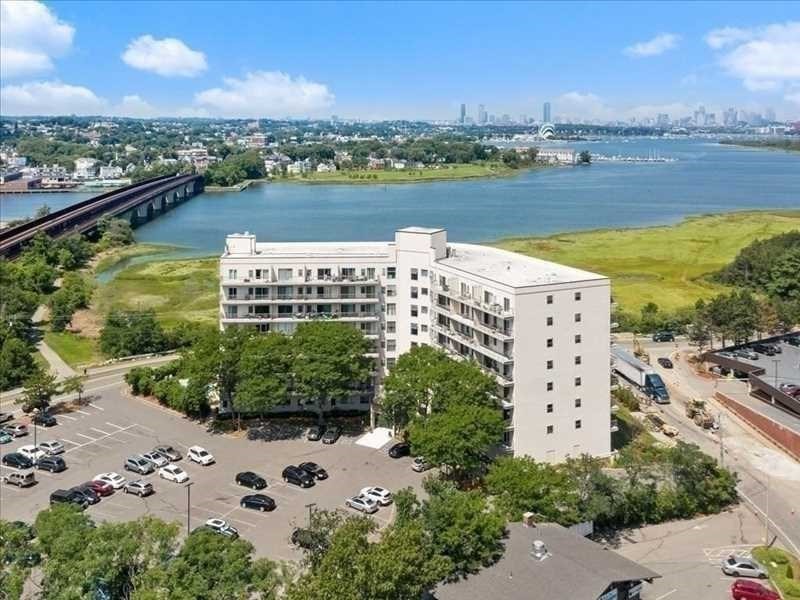
$655,000
3
bds
|
3
ba
|
2,640
sqft
|
built
2025
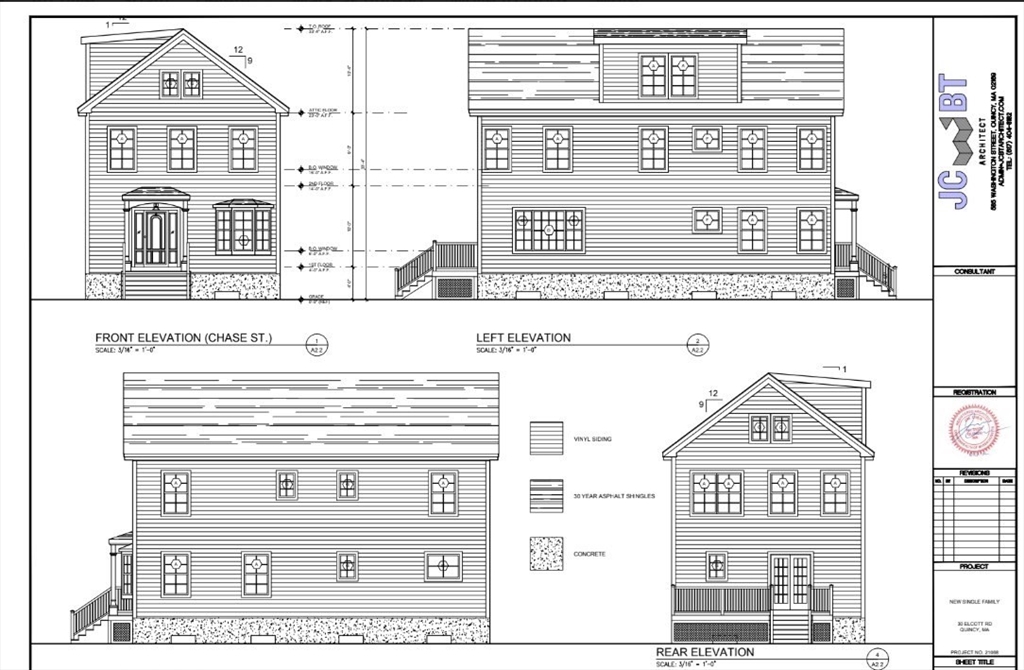
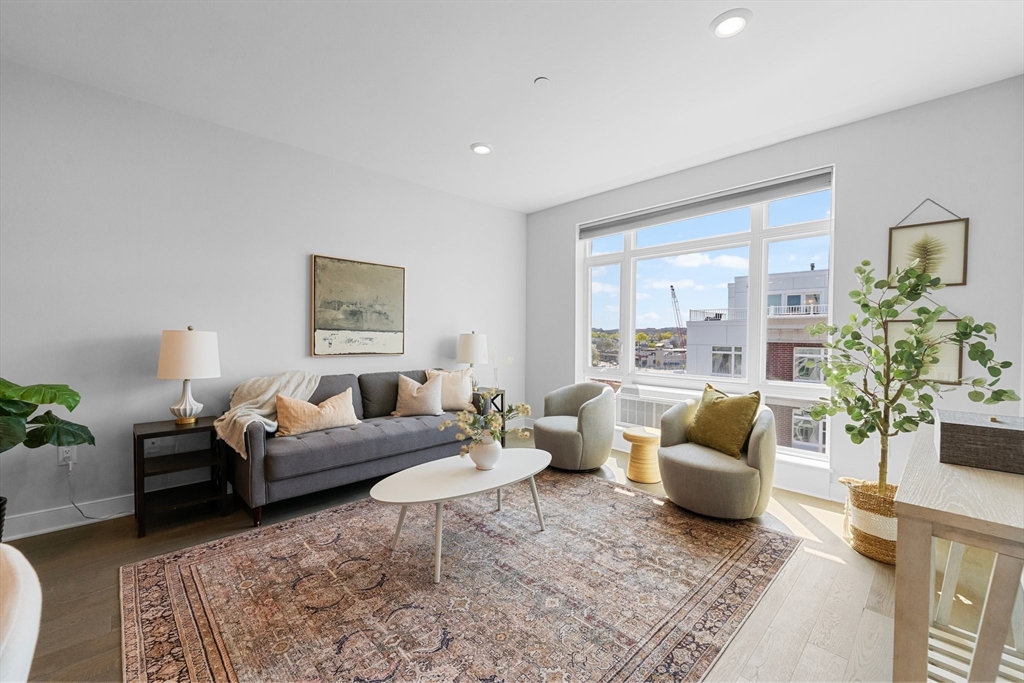
30 Elcott Rd, Quincy, MA 02169
$-846
Cash flow
-6.7%
Cash-on-Cash Return
4.1%
Cap rate
0.6%
Rent to Value Ratio
93 out of 120 properties for sale in Quincy, MA
Limited Results Shown
Create a free account, or log in to reveal all property listings and enjoy the complete experience.
Active under contract
$620,000
4
bds
|
2
ba
|
1,125
sqft
|
built
1969
26 Hanna St, Quincy, MA 02169
$-1,005
Cash flow
-8.5%
Cash-on-Cash Return
3.7%
Cap rate
0.6%
Rent to Value Ratio
Active
$276,000
1
bds
|
1
ba
|
445
sqft
|
built
1964
1025 Hancock St, Quincy, MA 02169
$-528
Cash flow
-10.0%
Cash-on-Cash Return
3.4%
Cap rate
0.7%
Rent to Value Ratio
Active
$552,500
2
bds
|
1
ba
|
1,326
sqft
|
built
1880
10 Nut Island Ave, Quincy, MA 02169
$-889
Cash flow
-8.4%
Cash-on-Cash Return
3.7%
Cap rate
0.6%
Rent to Value Ratio

Active
$347,900
1
bds
|
1
ba
|
644
sqft
|
built
1985
133 Commander Shea Blvd, Quincy, MA 02171
$-1,189
Cash flow
-17.8%
Cash-on-Cash Return
1.6%
Cap rate
0.6%
Rent to Value Ratio
Active
$899,000
4
bds
|
3
ba
|
1,919
sqft
|
built
1945
17 Woodcliff Rd, Quincy, MA 02169
$-2,223
Cash flow
-12.9%
Cash-on-Cash Return
2.7%
Cap rate
0.4%
Rent to Value Ratio
Active
$480,000
2
bds
|
2
ba
|
1,016
sqft
|
built
1994
200 Falls Blvd, Quincy, MA 02169
$-1,455
Cash flow
-15.8%
Cash-on-Cash Return
2.0%
Cap rate
0.6%
Rent to Value Ratio
Active
$1,275,000
8
bds
|
3
ba
|
3,614
sqft
|
built
1900
39 Newbury Ave, Quincy, MA 02171
$-5,195
Cash flow
-21.3%
Cash-on-Cash Return
0.8%
Cap rate
0.2%
Rent to Value Ratio
Active
$799,900
3
bds
|
2
ba
|
1,912
sqft
|
built
1920
10 Prescott Ter, Quincy, MA 02169
$-1,684
Cash flow
-11.0%
Cash-on-Cash Return
3.2%
Cap rate
0.5%
Rent to Value Ratio

Active
$624,900
4
bds
|
2
ba
|
1,488
sqft
|
built
1900
34 Prout St, Quincy, MA 02169
$-1,062
Cash flow
-8.9%
Cash-on-Cash Return
3.6%
Cap rate
0.6%
Rent to Value Ratio
Active
$319,000
1
bds
|
1
ba
|
828
sqft
|
built
1975
58 South St, Quincy, MA 02169
$-855
Cash flow
-14.0%
Cash-on-Cash Return
2.5%
Cap rate
0.6%
Rent to Value Ratio
Active
$275,000
0
bds
|
1
ba
|
510
sqft
|
built
1985
133 Commander Shea Blvd, Quincy, MA 02171
$-938
Cash flow
-17.8%
Cash-on-Cash Return
1.6%
Cap rate
0.6%
Rent to Value Ratio
Active
$725,000
3
bds
|
2
ba
|
1,240
sqft
|
built
1935
70 Sherman St, Quincy, MA 02170
$-1,569
Cash flow
-11.3%
Cash-on-Cash Return
3.1%
Cap rate
0.5%
Rent to Value Ratio
Active under contract
$429,900
1
bds
|
1
ba
|
880
sqft
|
built
1975
77 Adams St, Quincy, MA 02169
$-1,585
Cash flow
-19.2%
Cash-on-Cash Return
1.3%
Cap rate
0.5%
Rent to Value Ratio
Active
$329,900
1
bds
|
1
ba
|
692
sqft
|
built
1988
1 Adams St, Quincy, MA 02169
$-1,188
Cash flow
-18.8%
Cash-on-Cash Return
1.4%
Cap rate
0.6%
Rent to Value Ratio
Active
$2,199,000
3
bds
|
4
ba
|
3,140
sqft
|
built
2025
87 Dorchester St, Quincy, MA 02171
$-9,113
Cash flow
-21.6%
Cash-on-Cash Return
0.7%
Cap rate
0.1%
Rent to Value Ratio
Active
$1,390,000
4
bds
|
2
ba
|
2,294
sqft
|
built
1880
2 Hammond Ct, Quincy, MA 02169
$-5,225
Cash flow
-19.6%
Cash-on-Cash Return
1.2%
Cap rate
0.2%
Rent to Value Ratio

Active
$1,690,000
6
bds
|
5
ba
|
4,200
sqft
|
built
1915
15 Dundee Rd, Quincy, MA 02171
$-5,754
Cash flow
-17.8%
Cash-on-Cash Return
1.6%
Cap rate
0.3%
Rent to Value Ratio
Active
$794,000
3
bds
|
2
ba
|
1,430
sqft
|
built
1925
338 Sea St, Quincy, MA 02169
$-2,326
Cash flow
-15.3%
Cash-on-Cash Return
2.2%
Cap rate
0.4%
Rent to Value Ratio
Active
$369,900
2
bds
|
2
ba
|
845
sqft
|
built
1987
35 Desmoines Rd, Quincy, MA 02169
$-974
Cash flow
-13.7%
Cash-on-Cash Return
2.5%
Cap rate
0.7%
Rent to Value Ratio
Active
$699,900
4
bds
|
3
ba
|
1,686
sqft
|
built
1950
172 Phipps St, Quincy, MA 02169
$-1,560
Cash flow
-11.6%
Cash-on-Cash Return
3.0%
Cap rate
0.5%
Rent to Value Ratio
Active
$1,949,900
2
bds
|
3
ba
|
2,503
sqft
|
built
1987
2001 Marina Dr, Quincy, MA 02171
$-8,979
Cash flow
-24.0%
Cash-on-Cash Return
0.2%
Cap rate
0.3%
Rent to Value Ratio
Active
$699,000
3
bds
|
1
ba
|
1,508
sqft
|
built
1900
32 Grogan Ave, Quincy, MA 02169
$-1,463
Cash flow
-10.9%
Cash-on-Cash Return
3.2%
Cap rate
0.5%
Rent to Value Ratio
Active
$775,000
3
bds
|
1
ba
|
2,258
sqft
|
built
1930
242 Furnace Brook Pkwy, Quincy, MA 02169
$-1,868
Cash flow
-12.6%
Cash-on-Cash Return
2.8%
Cap rate
0.5%
Rent to Value Ratio
Active under contract
$858,000
4
bds
|
3
ba
|
2,436
sqft
|
built
1940
8 Richfield St, Quincy, MA 02171
$-3,445
Cash flow
-20.9%
Cash-on-Cash Return
0.9%
Cap rate
0.2%
Rent to Value Ratio
Active
$549,000
1
bds
|
1
ba
|
820
sqft
|
built
1988
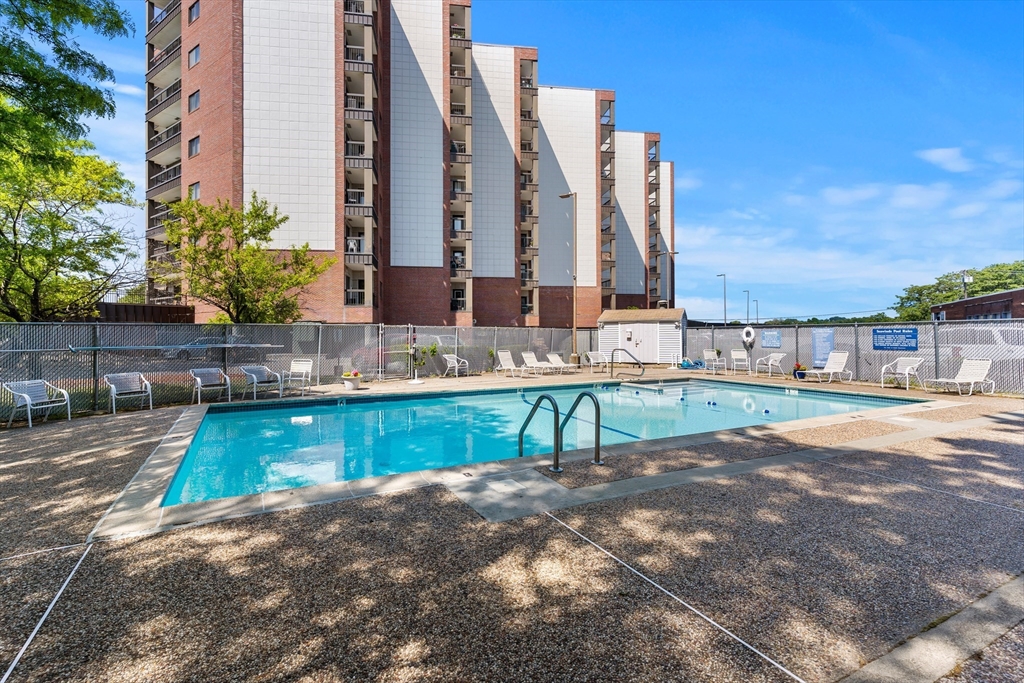
1001 Marina Dr, Quincy, MA 02171
$-1,749
Cash flow
-16.6%
Cash-on-Cash Return
1.9%
Cap rate
0.5%
Rent to Value Ratio
Active
$415,000
2
bds
|
2
ba
|
1,150
sqft
|
built
1972
211 West St, Quincy, MA 02169
$-1,205
Cash flow
-15.1%
Cash-on-Cash Return
2.2%
Cap rate
0.6%
Rent to Value Ratio
Active
$425,000
1
bds
|
1
ba
|
836
sqft
|
built
2004
1 Cityview Ln, Quincy, MA 02169
$-1,173
Cash flow
-14.4%
Cash-on-Cash Return
2.4%
Cap rate
0.5%
Rent to Value Ratio
Active
$668,000
2
bds
|
2
ba
|
1,213
sqft
|
built
2018
2 Cliveden St, Quincy, MA 02169
$-1,629
Cash flow
-12.7%
Cash-on-Cash Return
2.8%
Cap rate
0.5%
Rent to Value Ratio
Active
$399,000
2
bds
|
2
ba
|
865
sqft
|
built
1988
230 Willard St, Quincy, MA 02169
$-1,144
Cash flow
-15.0%
Cash-on-Cash Return
2.2%
Cap rate
0.6%
Rent to Value Ratio
Active
$679,999
3
bds
|
2
ba
|
1,675
sqft
|
built
1988
1 Adams St, Quincy, MA 02169
$-2,834
Cash flow
-21.7%
Cash-on-Cash Return
0.7%
Cap rate
0.6%
Rent to Value Ratio
Active under contract
$375,000
2
bds
|
2
ba
|
855
sqft
|
built
1988
230 Willard St, Quincy, MA 02169
$-1,106
Cash flow
-15.4%
Cash-on-Cash Return
2.1%
Cap rate
0.7%
Rent to Value Ratio
Active
$669,000
3
bds
|
1
ba
|
1,318
sqft
|
built
1920
56 Madison Ave, Quincy, MA 02169
$-1,520
Cash flow
-11.9%
Cash-on-Cash Return
3.0%
Cap rate
0.5%
Rent to Value Ratio
Active
$375,000
2
bds
|
1
ba
|
807
sqft
|
built
1965
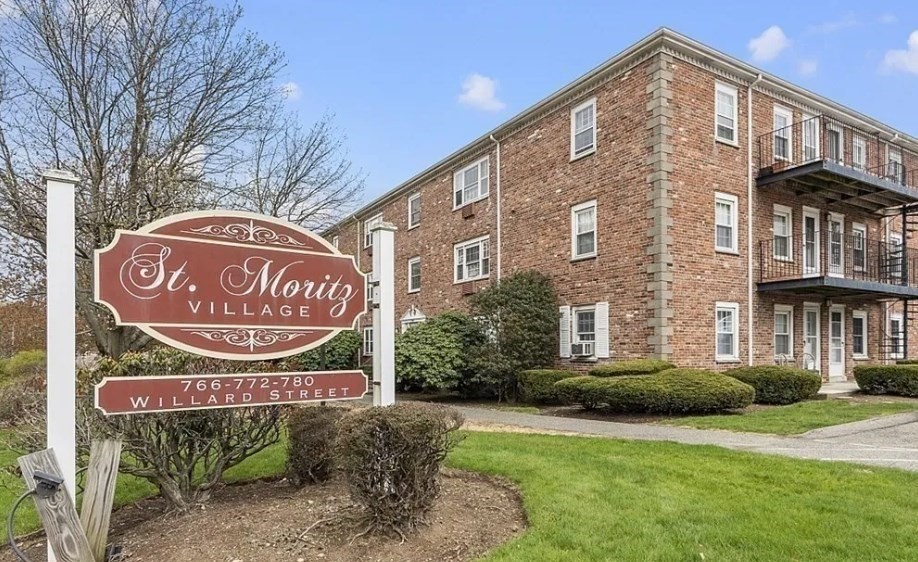
766 Willard St, Quincy, MA 02169
$-958
Cash flow
-13.3%
Cash-on-Cash Return
2.6%
Cap rate
0.6%
Rent to Value Ratio
Active
$375,000
2
bds
|
2
ba
|
868
sqft
|
built
1987
90 Quincy Shore Dr, Quincy, MA 02171
$-1,022
Cash flow
-14.2%
Cash-on-Cash Return
2.4%
Cap rate
0.7%
Rent to Value Ratio
Active
$779,000
5
bds
|
4
ba
|
2,037
sqft
|
built
1950
426 Sea St, Quincy, MA 02169
$-2,046
Cash flow
-13.7%
Cash-on-Cash Return
2.5%
Cap rate
0.4%
Rent to Value Ratio

Active
$799,900
2
bds
|
2
ba
|
1,235
sqft
|
built
1988
1001 Marina Dr, Quincy, MA 02171
$-2,485
Cash flow
-16.2%
Cash-on-Cash Return
2.0%
Cap rate
0.5%
Rent to Value Ratio
Active
$399,000
1
bds
|
1
ba
|
880
sqft
|
built
1975
77 Adams St, Quincy, MA 02169
$-1,146
Cash flow
-15.0%
Cash-on-Cash Return
2.2%
Cap rate
0.6%
Rent to Value Ratio
Active
$1,250,000
6
bds
|
4
ba
|
2,798
sqft
|
built
2006
32 Sumner St, Quincy, MA 02169
$-4,448
Cash flow
-18.6%
Cash-on-Cash Return
1.4%
Cap rate
0.3%
Rent to Value Ratio
Active
$920,000
5
bds
|
4
ba
|
2,552
sqft
|
built
1890
187 Washington St, Quincy, MA 02169
$-3,022
Cash flow
-17.1%
Cash-on-Cash Return
1.7%
Cap rate
0.3%
Rent to Value Ratio
Active
$655,000
3
bds
|
3
ba
|
2,640
sqft
|
built
2025
30 Elcott Rd, Quincy, MA 02169
$-846
Cash flow
-6.7%
Cash-on-Cash Return
4.1%
Cap rate
0.6%
Rent to Value Ratio