Quincy, MA Investment Properties for Sale
Browse homes for sale and investment properties in Quincy, MA. Refine your search by price, property type, or more.
Best cash flowing properties in Quincy, MA
Active
$649,000
2
bds
|
2
ba
|
1,324
sqft
|
built
2019
11 Oak Grove Ter, Quincy, MA 02169
$-1,294
Cash flow
-10.4%
Cash-on-Cash Return
3.3%
Cap rate
0.6%
Rent to Value Ratio
Active
$549,000
2
bds
|
2
ba
|
1,460
sqft
|
built
2005
87 Franklin St, Quincy, MA 02169
$-1,457
Cash flow
-13.8%
Cash-on-Cash Return
2.5%
Cap rate
0.6%
Rent to Value Ratio
93 out of 120 properties for sale in Quincy, MA
Limited Results Shown
Create a free account, or log in to reveal all property listings and enjoy the complete experience.
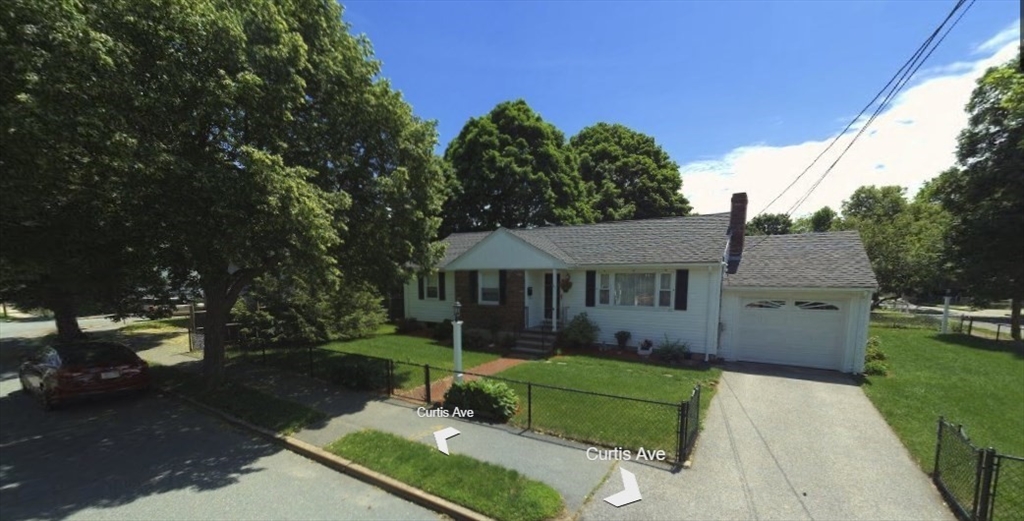
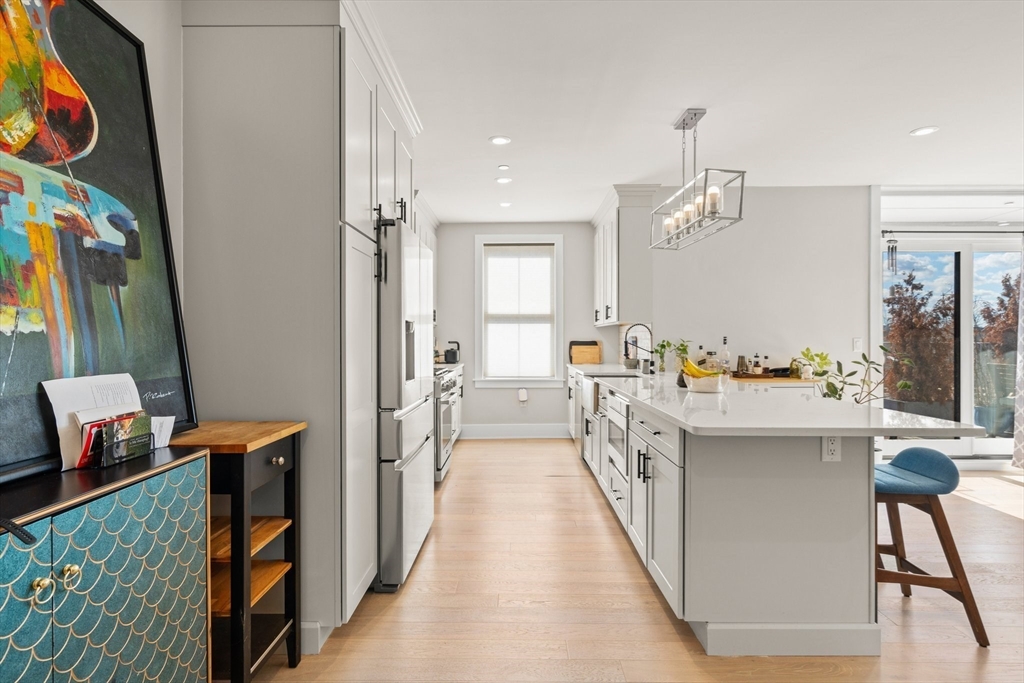
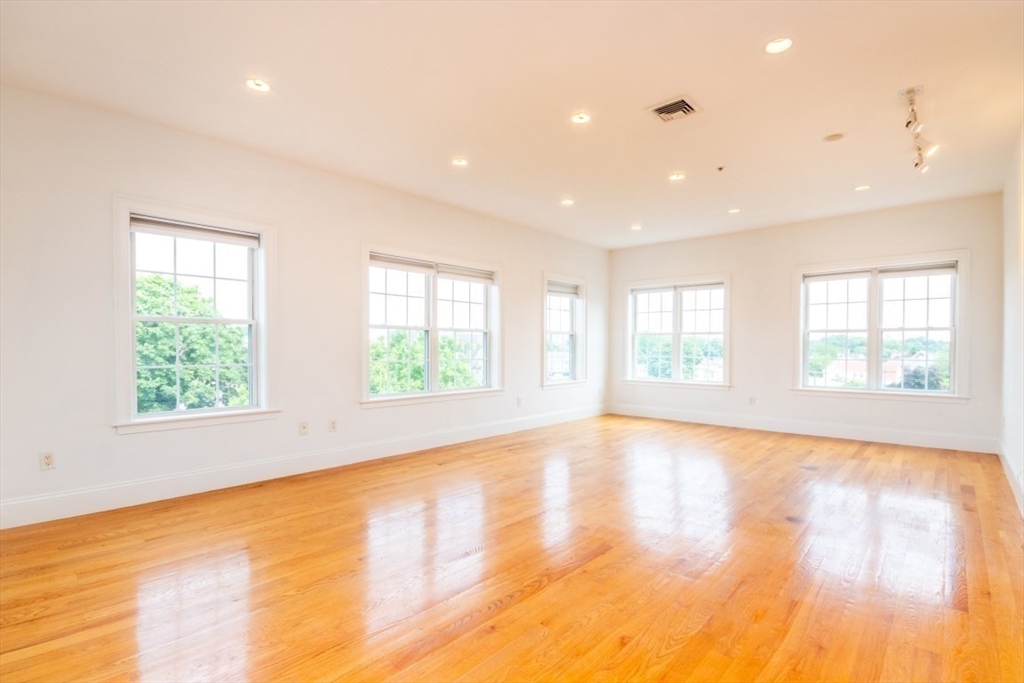
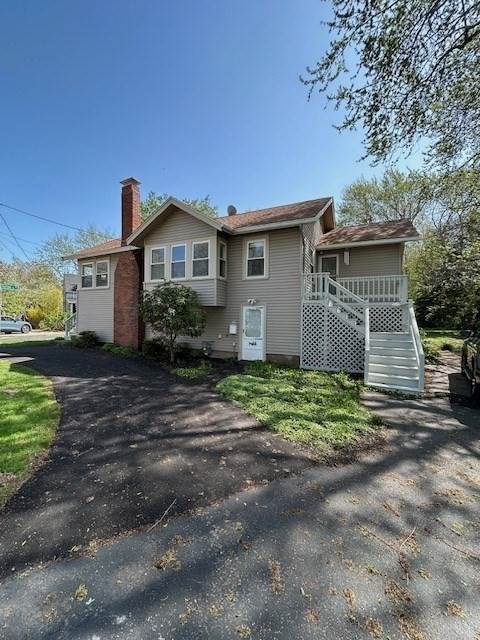
Active
$809,900
3
bds
|
3
ba
|
2,161
sqft
|
built
1956
33 Curtis Ave, Quincy, MA 02169
$-2,144
Cash flow
-13.8%
Cash-on-Cash Return
2.5%
Cap rate
0.4%
Rent to Value Ratio
Active
$549,000
2
bds
|
2
ba
|
1,460
sqft
|
built
2005
87 Franklin St, Quincy, MA 02169
$-1,457
Cash flow
-13.8%
Cash-on-Cash Return
2.5%
Cap rate
0.6%
Rent to Value Ratio
Active
$799,900
3
bds
|
2
ba
|
1,809
sqft
|
built
1920
32 Patten St, Quincy, MA 02170
$-1,627
Cash flow
-10.6%
Cash-on-Cash Return
3.2%
Cap rate
0.5%
Rent to Value Ratio

Active
$1,300,000
7
bds
|
3
ba
|
2,223
sqft
|
built
1890
59 Germain Ave, Quincy, MA 02169
$-4,309
Cash flow
-17.3%
Cash-on-Cash Return
1.7%
Cap rate
0.3%
Rent to Value Ratio
Active
$649,000
2
bds
|
2
ba
|
1,324
sqft
|
built
2019
11 Oak Grove Ter, Quincy, MA 02169
$-1,294
Cash flow
-10.4%
Cash-on-Cash Return
3.3%
Cap rate
0.6%
Rent to Value Ratio

Active
$719,900
3
bds
|
3
ba
|
1,520
sqft
|
built
1975
77 Adams St, Quincy, MA 02169
$-1,727
Cash flow
-12.5%
Cash-on-Cash Return
2.8%
Cap rate
0.6%
Rent to Value Ratio
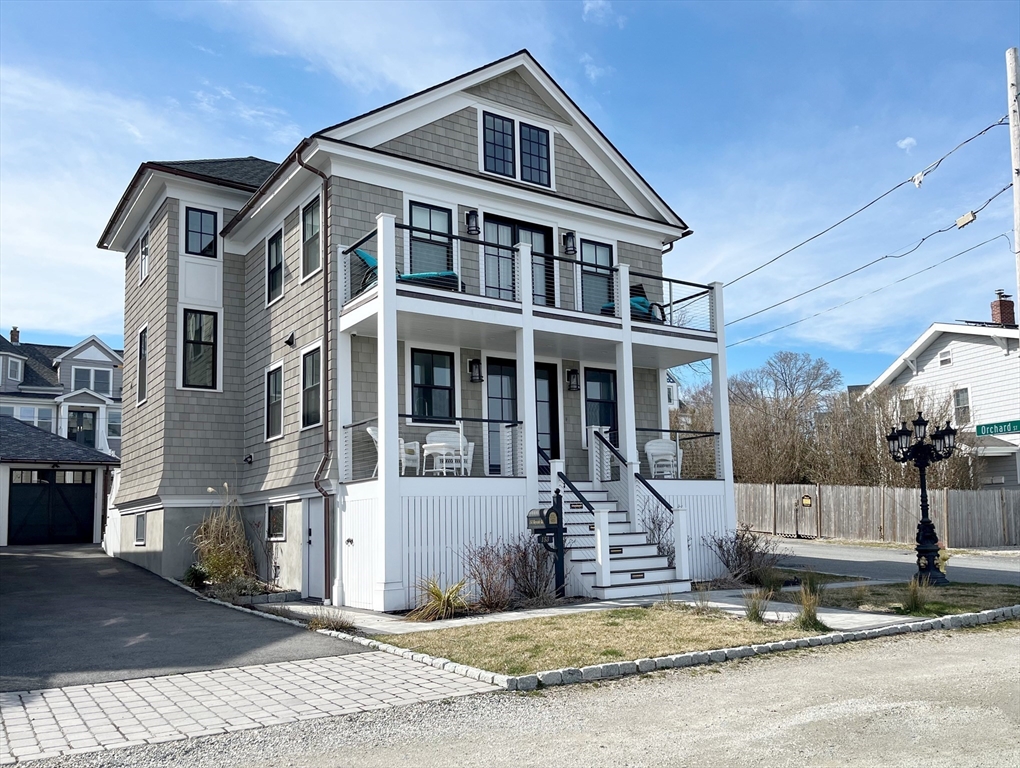
Active
$799,900
2
bds
|
2
ba
|
1,594
sqft
|
built
1940
667 E Squantum St, Quincy, MA 02171
$-1,792
Cash flow
-11.7%
Cash-on-Cash Return
3.0%
Cap rate
0.5%
Rent to Value Ratio
Active
$999,000
6
bds
|
2
ba
|
2,530
sqft
|
built
1898
270 Southern Artery, Quincy, MA 02169
$-3,409
Cash flow
-17.8%
Cash-on-Cash Return
1.6%
Cap rate
0.3%
Rent to Value Ratio
Active
$1,499,000
7
bds
|
5
ba
|
2,802
sqft
|
built
1918
69 Suomi Rd, Quincy, MA 02169
$-4,881
Cash flow
-17.0%
Cash-on-Cash Return
1.8%
Cap rate
0.3%
Rent to Value Ratio
Active
$589,000
2
bds
|
2
ba
|
1,364
sqft
|
built
1989
85 E Squantum St, Quincy, MA 02171
$-2,161
Cash flow
-19.1%
Cash-on-Cash Return
1.3%
Cap rate
0.5%
Rent to Value Ratio
Active
$1,799,000
4
bds
|
5
ba
|
3,448
sqft
|
built
1989
15 Knollwood Rd, Quincy, MA 02171
$-4,312
Cash flow
-12.5%
Cash-on-Cash Return
2.8%
Cap rate
0.5%
Rent to Value Ratio
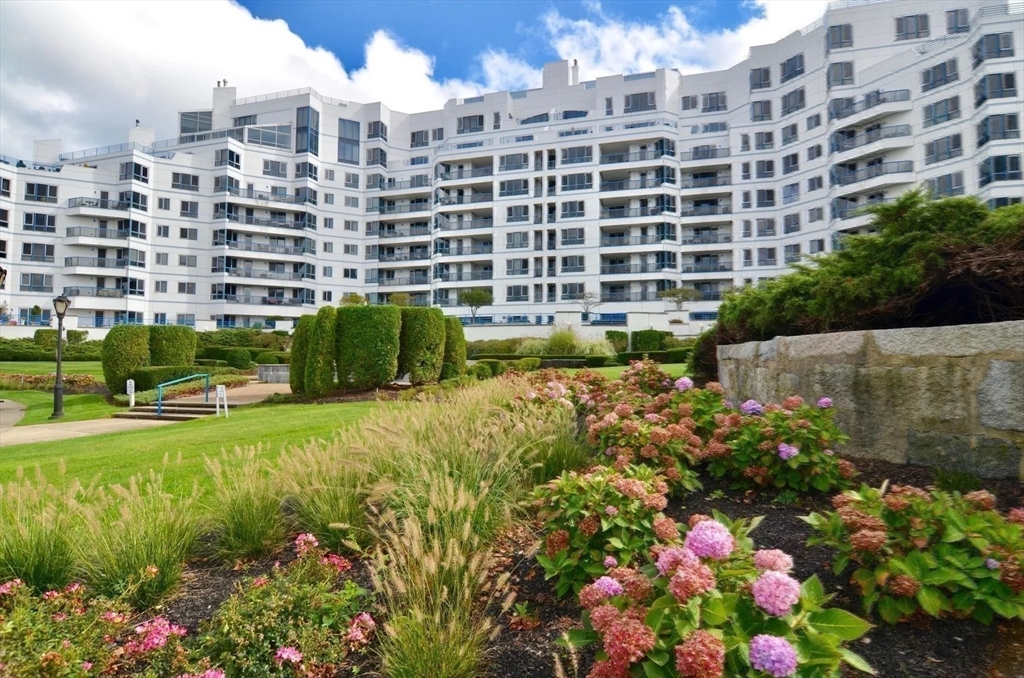
Active
$830,000
2
bds
|
2
ba
|
1,452
sqft
|
built
1987
2001 Marina Dr, Quincy, MA 02171
$-2,717
Cash flow
-17.1%
Cash-on-Cash Return
1.8%
Cap rate
0.5%
Rent to Value Ratio
Active
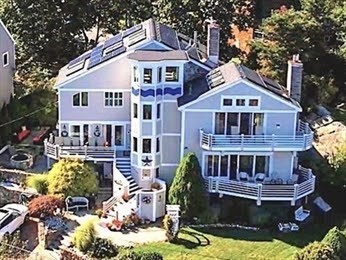
$3,799,000
3
bds
|
4
ba
|
2,525
sqft
|
built
2019
153 Bayside Rd, Quincy, MA 02171
$-12,336
Cash flow
-16.9%
Cash-on-Cash Return
1.8%
Cap rate
0.3%
Rent to Value Ratio