Quincy, MA Investment Properties for Sale
Browse homes for sale and investment properties in Quincy, MA. Refine your search by price, property type, or more.
Best cash flowing properties in Quincy, MA
Active
$276,000
1
bds
|
1
ba
|
445
sqft
|
built
1964
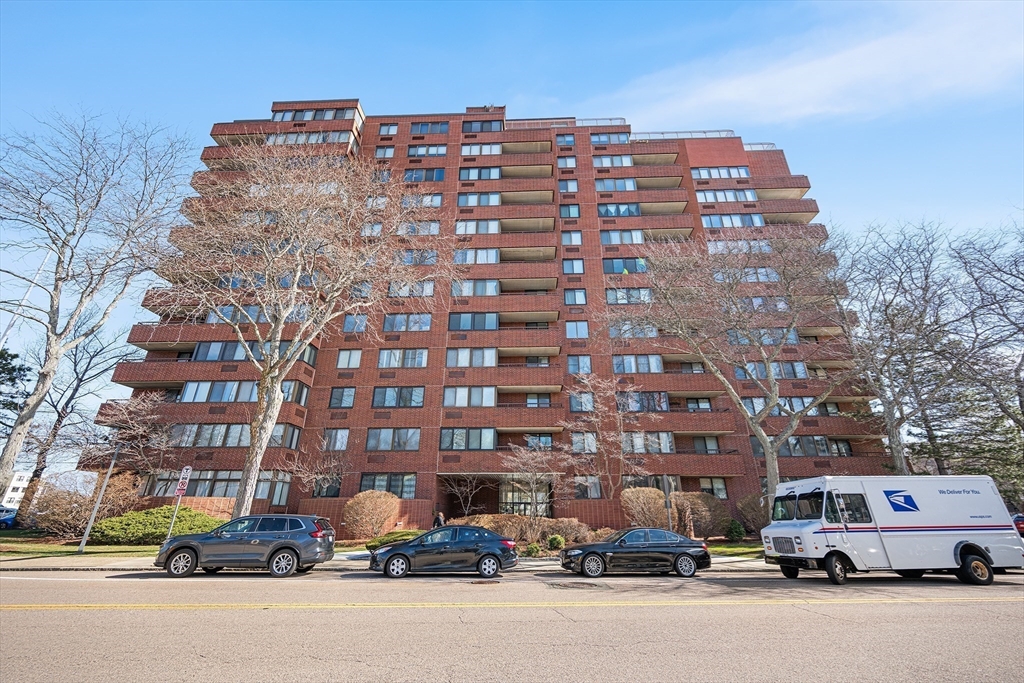
1025 Hancock St, Quincy, MA 02169
$-528
Cash flow
-10.0%
Cash-on-Cash Return
3.4%
Cap rate
0.7%
Rent to Value Ratio

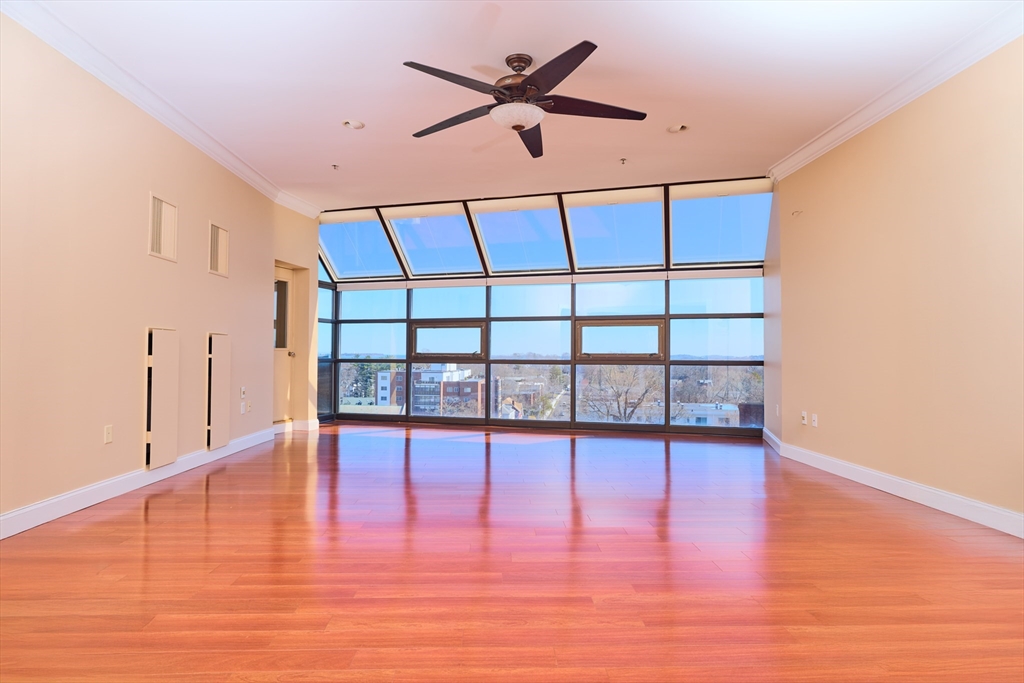
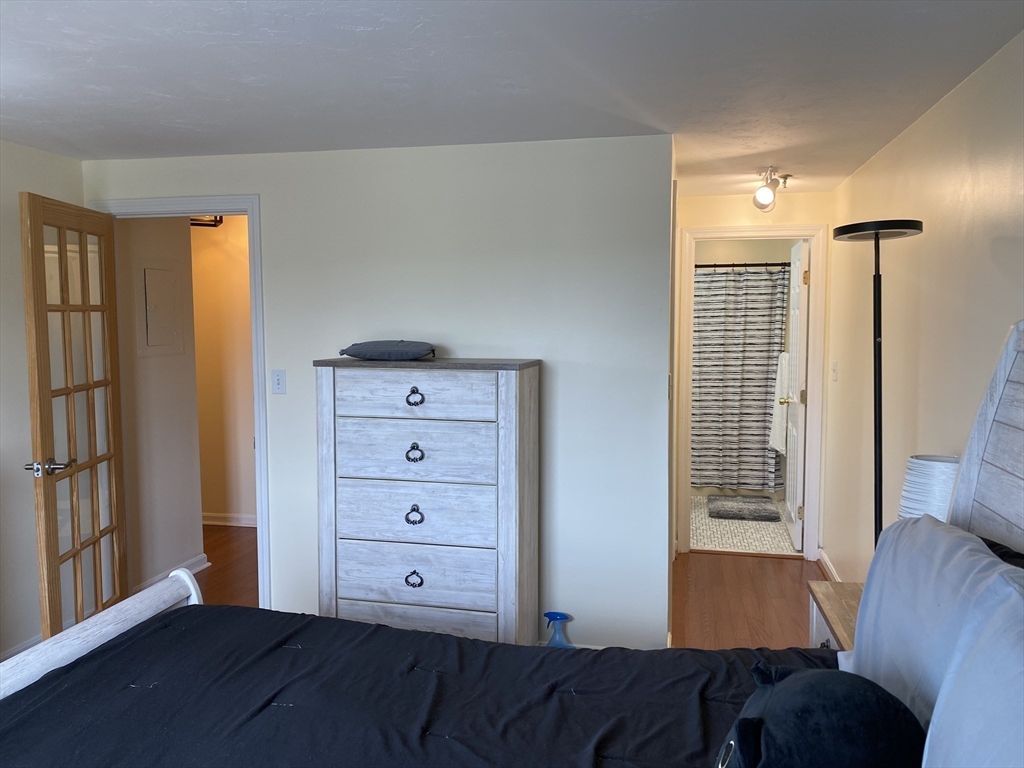
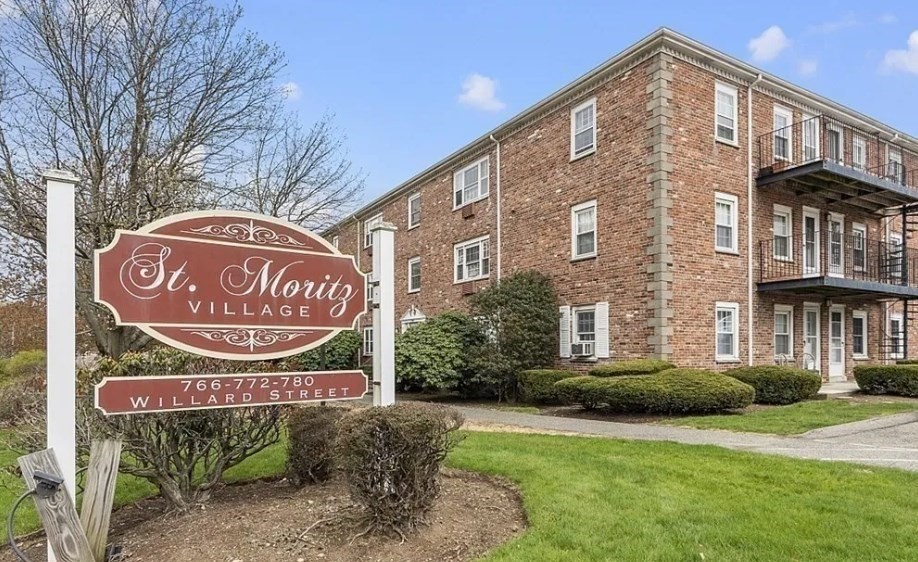
Active
$299,900
1
bds
|
1
ba
|
652
sqft
|
built
1965
766 Willard St, Quincy, MA 02169
$-656
Cash flow
-11.4%
Cash-on-Cash Return
3.1%
Cap rate
0.7%
Rent to Value Ratio
40 out of 63 properties for sale in Quincy, MA
Limited Results Shown
Create a free account, or log in to reveal all property listings and enjoy the complete experience.
Active
$829,000
3
bds
|
4
ba
|
1,916
sqft
|
built
2021
47 Parker St, Quincy, MA 02169
$-2,518
Cash flow
-15.8%
Cash-on-Cash Return
2.0%
Cap rate
0.4%
Rent to Value Ratio
Active
$299,900
1
bds
|
1
ba
|
652
sqft
|
built
1965
766 Willard St, Quincy, MA 02169
$-656
Cash flow
-11.4%
Cash-on-Cash Return
3.1%
Cap rate
0.7%
Rent to Value Ratio
Active
$329,900
1
bds
|
1
ba
|
629
sqft
|
built
1966
475-479 Sea St, Quincy, MA 02169
$-779
Cash flow
-12.3%
Cash-on-Cash Return
2.8%
Cap rate
0.6%
Rent to Value Ratio
Active
$679,000
2
bds
|
2
ba
|
1,145
sqft
|
built
2017
999 Hancock St, Quincy, MA 02169
$-2,285
Cash flow
-17.6%
Cash-on-Cash Return
1.6%
Cap rate
0.5%
Rent to Value Ratio
Active
$349,000
1
bds
|
1
ba
|
644
sqft
|
built
1985
133 Commander Shea Blvd, Quincy, MA 02171
$-1,228
Cash flow
-18.4%
Cash-on-Cash Return
1.5%
Cap rate
0.6%
Rent to Value Ratio
Active
$679,900
2
bds
|
2
ba
|
1,161
sqft
|
built
2017
999 Hancock St, Quincy, MA 02169
$-2,035
Cash flow
-15.6%
Cash-on-Cash Return
2.1%
Cap rate
0.5%
Rent to Value Ratio
Active
$995,000
2
bds
|
2
ba
|
1,362
sqft
|
built
2021
60 Newbury St, Quincy, MA 02171
$-2,159
Cash flow
-11.3%
Cash-on-Cash Return
3.1%
Cap rate
0.6%
Rent to Value Ratio
Active
$688,000
3
bds
|
3
ba
|
1,587
sqft
|
built
1989
35 Merrymount Rd, Quincy, MA 02169
$-1,910
Cash flow
-14.5%
Cash-on-Cash Return
2.3%
Cap rate
0.5%
Rent to Value Ratio

Active
$699,000
2
bds
|
3
ba
|
1,759
sqft
|
built
2018
27 Mill St, Quincy, MA 02169
$-1,755
Cash flow
-13.1%
Cash-on-Cash Return
2.7%
Cap rate
0.5%
Rent to Value Ratio
Active
$439,900
2
bds
|
1
ba
|
810
sqft
|
built
1987
21 Linden St, Quincy, MA 02170
$-1,350
Cash flow
-16.0%
Cash-on-Cash Return
2.0%
Cap rate
0.5%
Rent to Value Ratio
Active
$319,900
1
bds
|
1
ba
|
722
sqft
|
built
1988
230 Willard St, Quincy, MA 02169
$-832
Cash flow
-13.6%
Cash-on-Cash Return
2.6%
Cap rate
0.7%
Rent to Value Ratio
Active
$524,900
2
bds
|
2
ba
|
1,214
sqft
|
built
1973
215 Thomas Burgin Pkwy, Quincy, MA 02169
$-1,027
Cash flow
-10.2%
Cash-on-Cash Return
3.3%
Cap rate
0.5%
Rent to Value Ratio

Active
$419,900
2
bds
|
2
ba
|
943
sqft
|
built
1975
459 Willard St, Quincy, MA 02169
$-1,138
Cash flow
-14.1%
Cash-on-Cash Return
2.4%
Cap rate
0.6%
Rent to Value Ratio

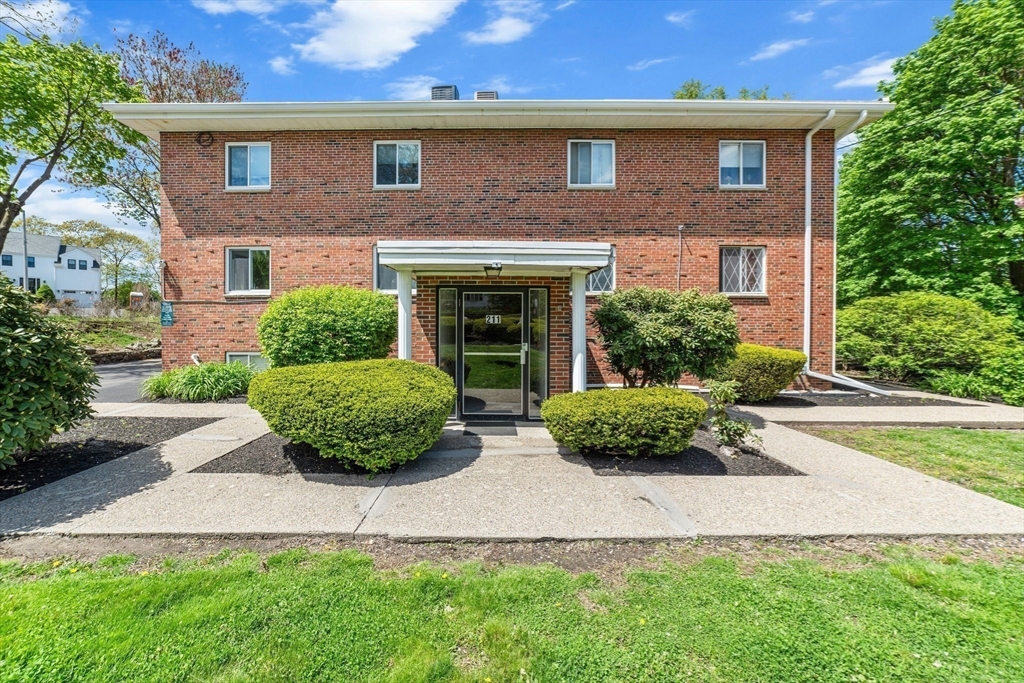
Active
$509,000
2
bds
|
2
ba
|
1,232
sqft
|
built
1972
211 West St, Quincy, MA 02169
$-1,482
Cash flow
-15.2%
Cash-on-Cash Return
2.2%
Cap rate
0.6%
Rent to Value Ratio
Active
$429,900
2
bds
|
1
ba
|
726
sqft
|
built
1960
9 Common St, Quincy, MA 02169
$-1,064
Cash flow
-12.9%
Cash-on-Cash Return
2.7%
Cap rate
0.5%
Rent to Value Ratio
Active
$276,000
1
bds
|
1
ba
|
445
sqft
|
built
1964
1025 Hancock St, Quincy, MA 02169
$-528
Cash flow
-10.0%
Cash-on-Cash Return
3.4%
Cap rate
0.7%
Rent to Value Ratio

Active
$347,900
1
bds
|
1
ba
|
644
sqft
|
built
1985
133 Commander Shea Blvd, Quincy, MA 02171
$-1,189
Cash flow
-17.8%
Cash-on-Cash Return
1.6%
Cap rate
0.6%
Rent to Value Ratio
Active
$480,000
2
bds
|
2
ba
|
1,016
sqft
|
built
1994
200 Falls Blvd, Quincy, MA 02169
$-1,455
Cash flow
-15.8%
Cash-on-Cash Return
2.0%
Cap rate
0.6%
Rent to Value Ratio
Active
$319,000
1
bds
|
1
ba
|
828
sqft
|
built
1975
58 South St, Quincy, MA 02169
$-855
Cash flow
-14.0%
Cash-on-Cash Return
2.5%
Cap rate
0.6%
Rent to Value Ratio
Active
$275,000
0
bds
|
1
ba
|
510
sqft
|
built
1985
133 Commander Shea Blvd, Quincy, MA 02171
$-938
Cash flow
-17.8%
Cash-on-Cash Return
1.6%
Cap rate
0.6%
Rent to Value Ratio
Active
$429,900
1
bds
|
1
ba
|
880
sqft
|
built
1975
77 Adams St, Quincy, MA 02169
$-1,585
Cash flow
-19.2%
Cash-on-Cash Return
1.3%
Cap rate
0.5%
Rent to Value Ratio
Active
$329,900
1
bds
|
1
ba
|
692
sqft
|
built
1988
1 Adams St, Quincy, MA 02169
$-1,188
Cash flow
-18.8%
Cash-on-Cash Return
1.4%
Cap rate
0.6%
Rent to Value Ratio
Active
$369,900
2
bds
|
2
ba
|
845
sqft
|
built
1987
35 Desmoines Rd, Quincy, MA 02169
$-974
Cash flow
-13.7%
Cash-on-Cash Return
2.5%
Cap rate
0.7%
Rent to Value Ratio
Active
$1,949,900
2
bds
|
3
ba
|
2,503
sqft
|
built
1987
2001 Marina Dr, Quincy, MA 02171
$-8,979
Cash flow
-24.0%
Cash-on-Cash Return
0.2%
Cap rate
0.3%
Rent to Value Ratio
Active
$549,000
1
bds
|
1
ba
|
820
sqft
|
built
1988
1001 Marina Dr, Quincy, MA 02171
$-1,749
Cash flow
-16.6%
Cash-on-Cash Return
1.9%
Cap rate
0.5%
Rent to Value Ratio
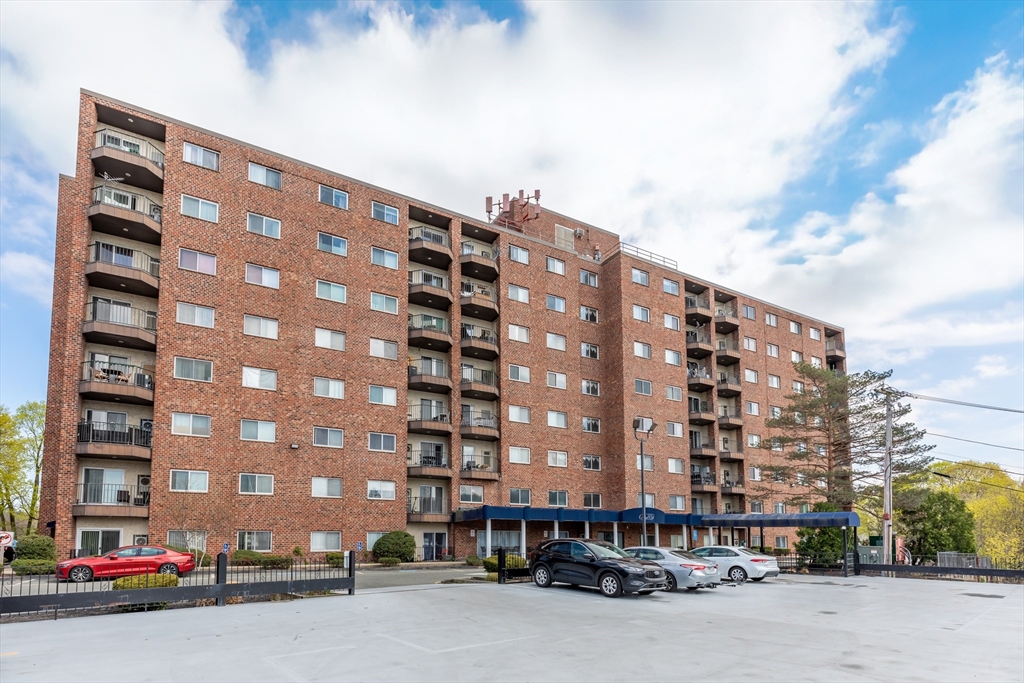
Active
$415,000
2
bds
|
2
ba
|
1,150
sqft
|
built
1972
211 West St, Quincy, MA 02169
$-1,205
Cash flow
-15.1%
Cash-on-Cash Return
2.2%
Cap rate
0.6%
Rent to Value Ratio
Active
$425,000
1
bds
|
1
ba
|
836
sqft
|
built
2004
1 Cityview Ln, Quincy, MA 02169
$-1,173
Cash flow
-14.4%
Cash-on-Cash Return
2.4%
Cap rate
0.5%
Rent to Value Ratio
Active
$668,000
2
bds
|
2
ba
|
1,213
sqft
|
built
2018
2 Cliveden St, Quincy, MA 02169
$-1,629
Cash flow
-12.7%
Cash-on-Cash Return
2.8%
Cap rate
0.5%
Rent to Value Ratio
Active
$399,000
2
bds
|
2
ba
|
865
sqft
|
built
1988
230 Willard St, Quincy, MA 02169
$-1,144
Cash flow
-15.0%
Cash-on-Cash Return
2.2%
Cap rate
0.6%
Rent to Value Ratio
Active
$679,999
3
bds
|
2
ba
|
1,675
sqft
|
built
1988
1 Adams St, Quincy, MA 02169
$-2,834
Cash flow
-21.7%
Cash-on-Cash Return
0.7%
Cap rate
0.6%
Rent to Value Ratio
Active under contract
$375,000
2
bds
|
2
ba
|
855
sqft
|
built
1988
230 Willard St, Quincy, MA 02169
$-1,106
Cash flow
-15.4%
Cash-on-Cash Return
2.1%
Cap rate
0.7%
Rent to Value Ratio
Active
$375,000
2
bds
|
1
ba
|
807
sqft
|
built
1965
766 Willard St, Quincy, MA 02169
$-958
Cash flow
-13.3%
Cash-on-Cash Return
2.6%
Cap rate
0.6%
Rent to Value Ratio
Active
$375,000
2
bds
|
2
ba
|
868
sqft
|
built
1987
90 Quincy Shore Dr, Quincy, MA 02171
$-1,022
Cash flow
-14.2%
Cash-on-Cash Return
2.4%
Cap rate
0.7%
Rent to Value Ratio

Active
$799,900
2
bds
|
2
ba
|
1,235
sqft
|
built
1988
1001 Marina Dr, Quincy, MA 02171
$-2,485
Cash flow
-16.2%
Cash-on-Cash Return
2.0%
Cap rate
0.5%
Rent to Value Ratio
Active
$399,000
1
bds
|
1
ba
|
880
sqft
|
built
1975
77 Adams St, Quincy, MA 02169
$-1,146
Cash flow
-15.0%
Cash-on-Cash Return
2.2%
Cap rate
0.6%
Rent to Value Ratio
Active
$549,000
2
bds
|
2
ba
|
1,460
sqft
|
built
2005
87 Franklin St, Quincy, MA 02169
$-1,457
Cash flow
-13.8%
Cash-on-Cash Return
2.5%
Cap rate
0.6%
Rent to Value Ratio
Active
$649,000
2
bds
|
2
ba
|
1,324
sqft
|
built
2019
11 Oak Grove Ter, Quincy, MA 02169
$-1,294
Cash flow
-10.4%
Cash-on-Cash Return
3.3%
Cap rate
0.6%
Rent to Value Ratio

Active
$719,900
3
bds
|
3
ba
|
1,520
sqft
|
built
1975
77 Adams St, Quincy, MA 02169
$-1,727
Cash flow
-12.5%
Cash-on-Cash Return
2.8%
Cap rate
0.6%
Rent to Value Ratio
Active
$589,000
2
bds
|
2
ba
|
1,364
sqft
|
built
1989
85 E Squantum St, Quincy, MA 02171
$-2,161
Cash flow
-19.1%
Cash-on-Cash Return
1.3%
Cap rate
0.5%
Rent to Value Ratio
Active
$830,000
2
bds
|
2
ba
|
1,452
sqft
|
built
1987
2001 Marina Dr, Quincy, MA 02171
$-2,717
Cash flow
-17.1%
Cash-on-Cash Return
1.8%
Cap rate
0.5%
Rent to Value Ratio