Quincy, MA Investment Properties for Sale
Browse homes for sale and investment properties in Quincy, MA. Refine your search by price, property type, or more.
Best cash flowing properties in Quincy, MA
Active
$779,000
5
bds
|
4
ba
|
2,037
sqft
|
built
1950
426 Sea St, Quincy, MA 02169
$-2,046
Cash flow
-13.7%
Cash-on-Cash Return
2.5%
Cap rate
0.4%
Rent to Value Ratio
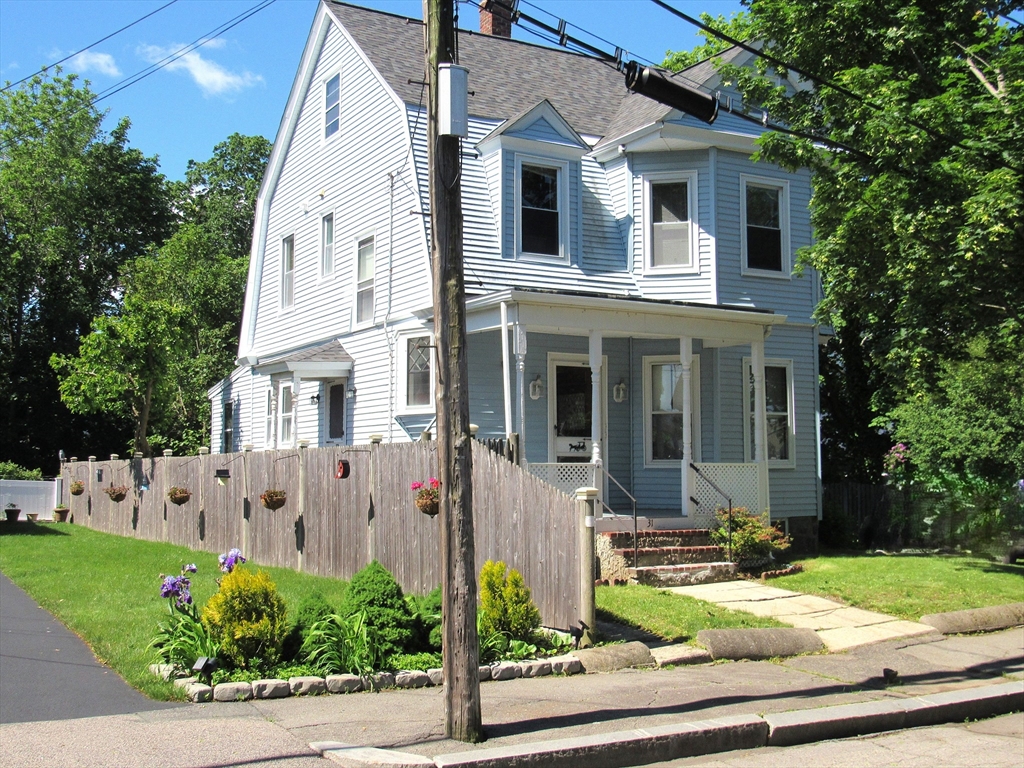
Active
$799,900
3
bds
|
2
ba
|
1,866
sqft
|
built
1900
31 Graham St, Quincy, MA 02169
$-2,530
Cash flow
-16.5%
Cash-on-Cash Return
1.9%
Cap rate
0.4%
Rent to Value Ratio
13 out of 16 properties for sale in Quincy, MA
Limited Results Shown
Create a free account, or log in to reveal all property listings and enjoy the complete experience.
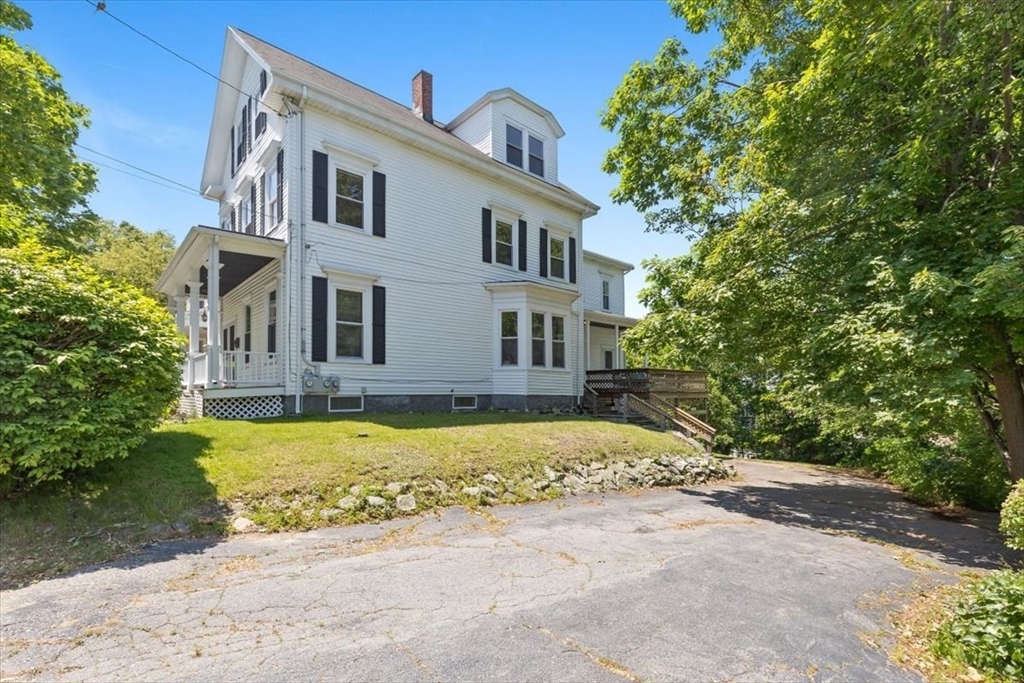
Active
$1,199,000
5
bds
|
2
ba
|
3,064
sqft
|
built
1900
107 Lincoln Ave, Quincy, MA 02170
$-4,641
Cash flow
-20.2%
Cash-on-Cash Return
1.0%
Cap rate
0.3%
Rent to Value Ratio
Active
$799,900
3
bds
|
2
ba
|
1,866
sqft
|
built
1900
31 Graham St, Quincy, MA 02169
$-2,530
Cash flow
-16.5%
Cash-on-Cash Return
1.9%
Cap rate
0.4%
Rent to Value Ratio
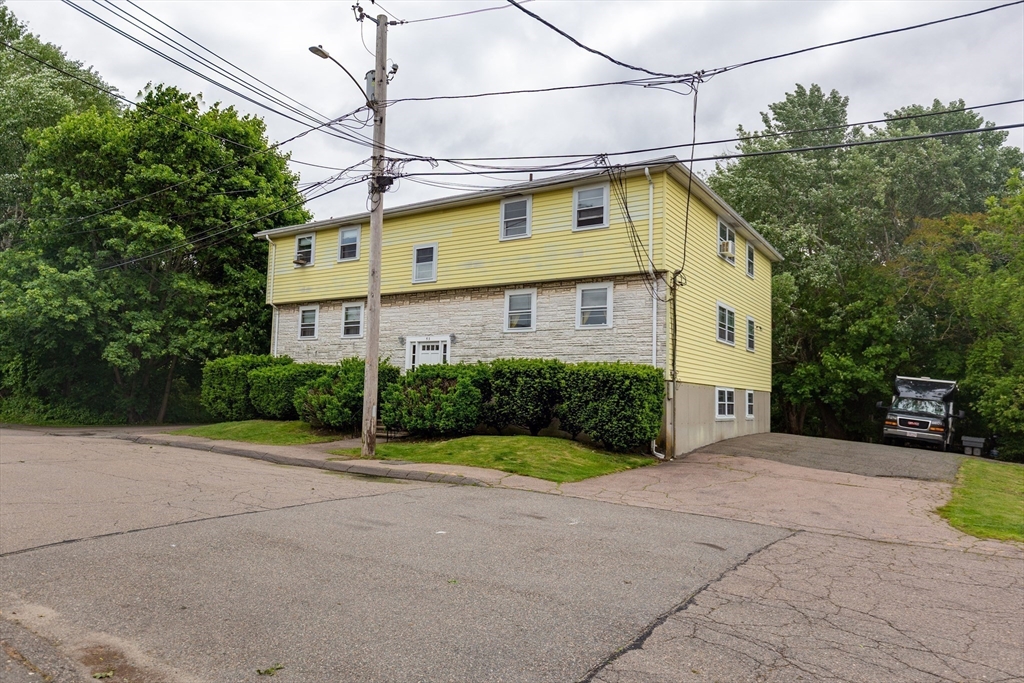
Active
$2,250,000
10
bds
|
6
ba
|
5,232
sqft
|
built
1980
51 Stoughton St, Quincy, MA 02169
$-9,993
Cash flow
-23.2%
Cash-on-Cash Return
0.3%
Cap rate
0.1%
Rent to Value Ratio
Active
$1,200,000
4
bds
|
2
ba
|
2,400
sqft
|
built
1960
309 Farrington St, Quincy, MA 02170
$-5,077
Cash flow
-22.1%
Cash-on-Cash Return
0.6%
Cap rate
0.2%
Rent to Value Ratio
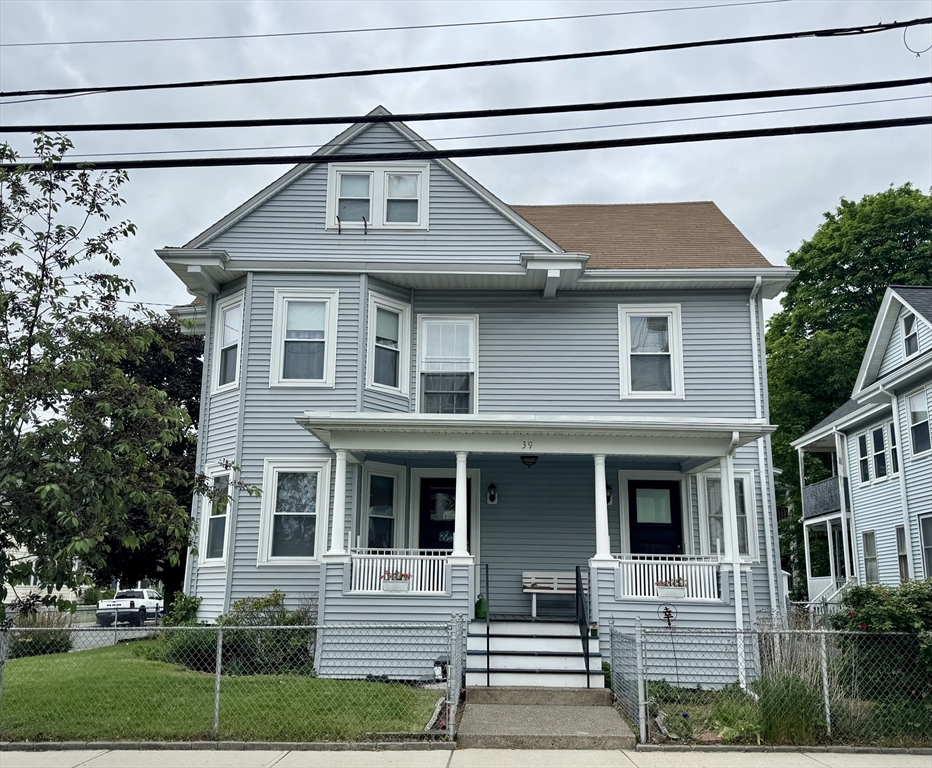
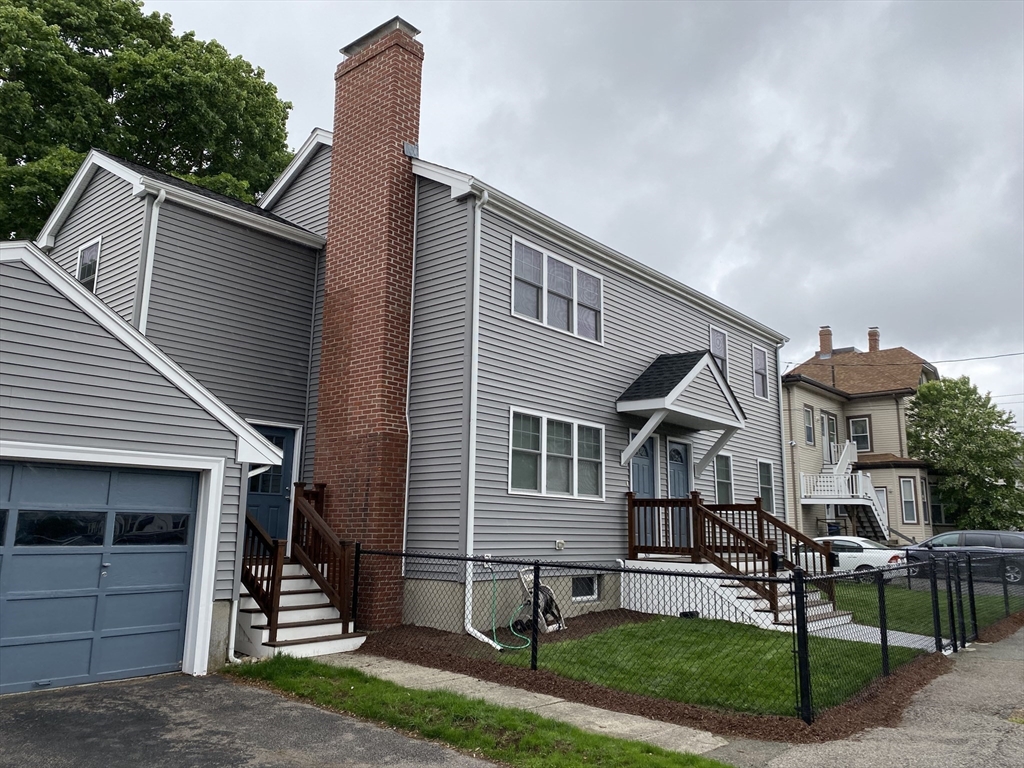
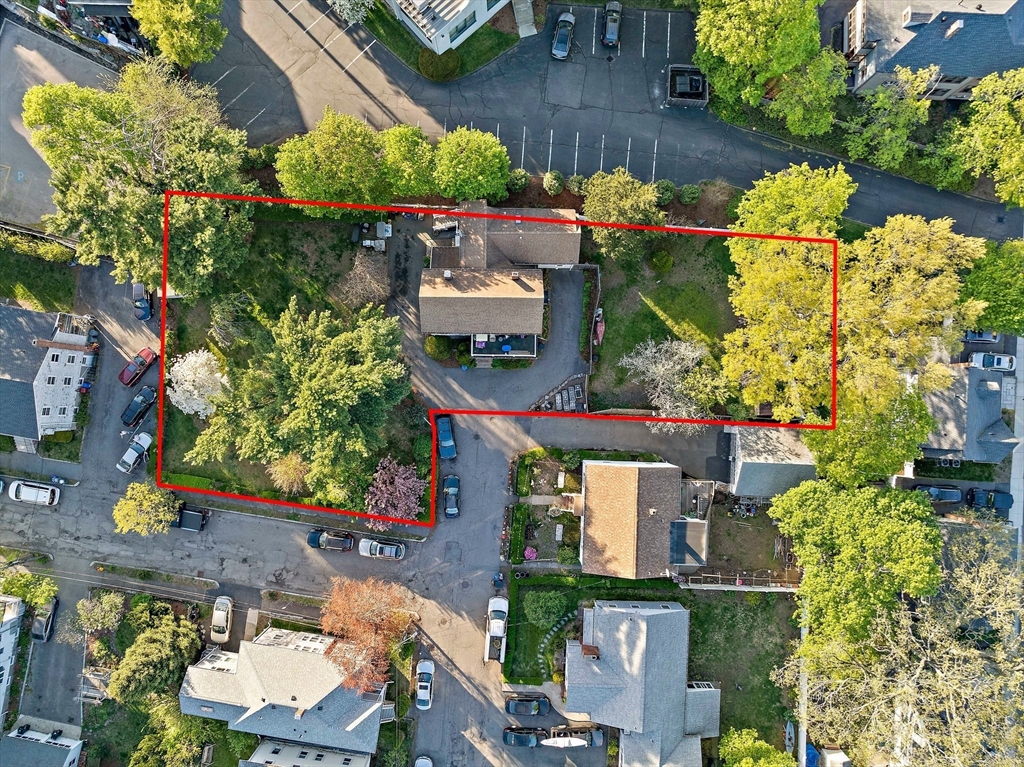
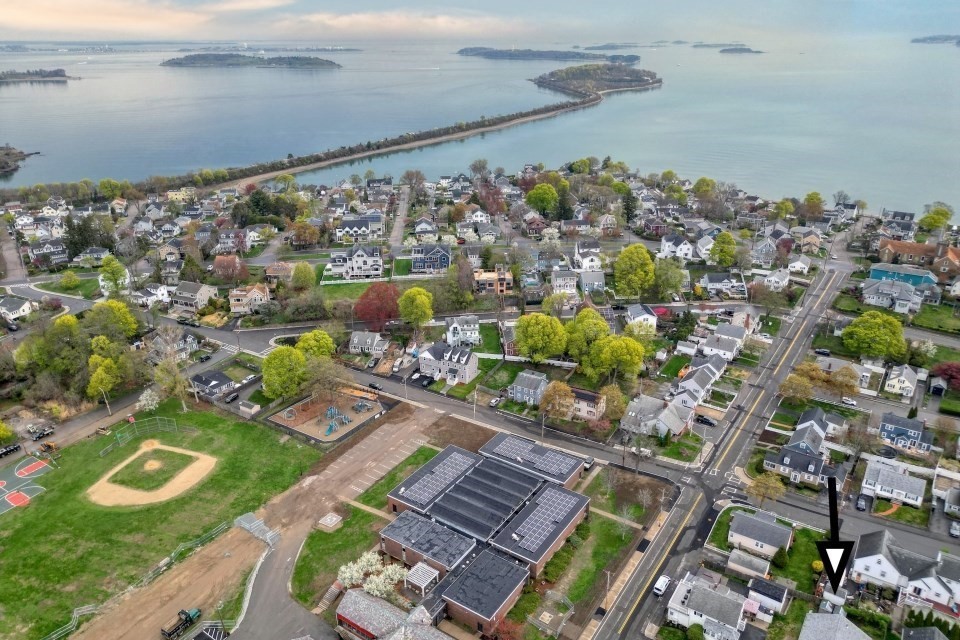
Active
$1,275,000
8
bds
|
3
ba
|
3,614
sqft
|
built
1900
39 Newbury Ave, Quincy, MA 02171
$-5,195
Cash flow
-21.3%
Cash-on-Cash Return
0.8%
Cap rate
0.2%
Rent to Value Ratio
Active
$1,390,000
4
bds
|
2
ba
|
2,294
sqft
|
built
1880
2 Hammond Ct, Quincy, MA 02169
$-5,225
Cash flow
-19.6%
Cash-on-Cash Return
1.2%
Cap rate
0.2%
Rent to Value Ratio
Active under contract
$858,000
4
bds
|
3
ba
|
2,436
sqft
|
built
1940
8 Richfield St, Quincy, MA 02171
$-3,445
Cash flow
-20.9%
Cash-on-Cash Return
0.9%
Cap rate
0.2%
Rent to Value Ratio
Active
$779,000
5
bds
|
4
ba
|
2,037
sqft
|
built
1950
426 Sea St, Quincy, MA 02169
$-2,046
Cash flow
-13.7%
Cash-on-Cash Return
2.5%
Cap rate
0.4%
Rent to Value Ratio
Active
$1,250,000
6
bds
|
4
ba
|
2,798
sqft
|
built
2006
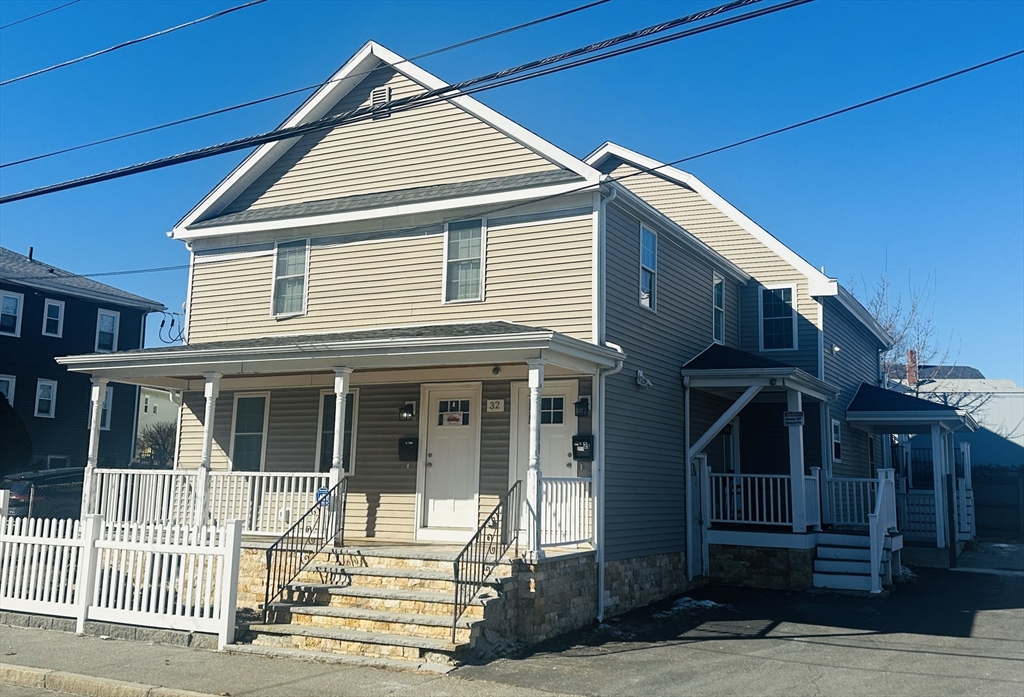
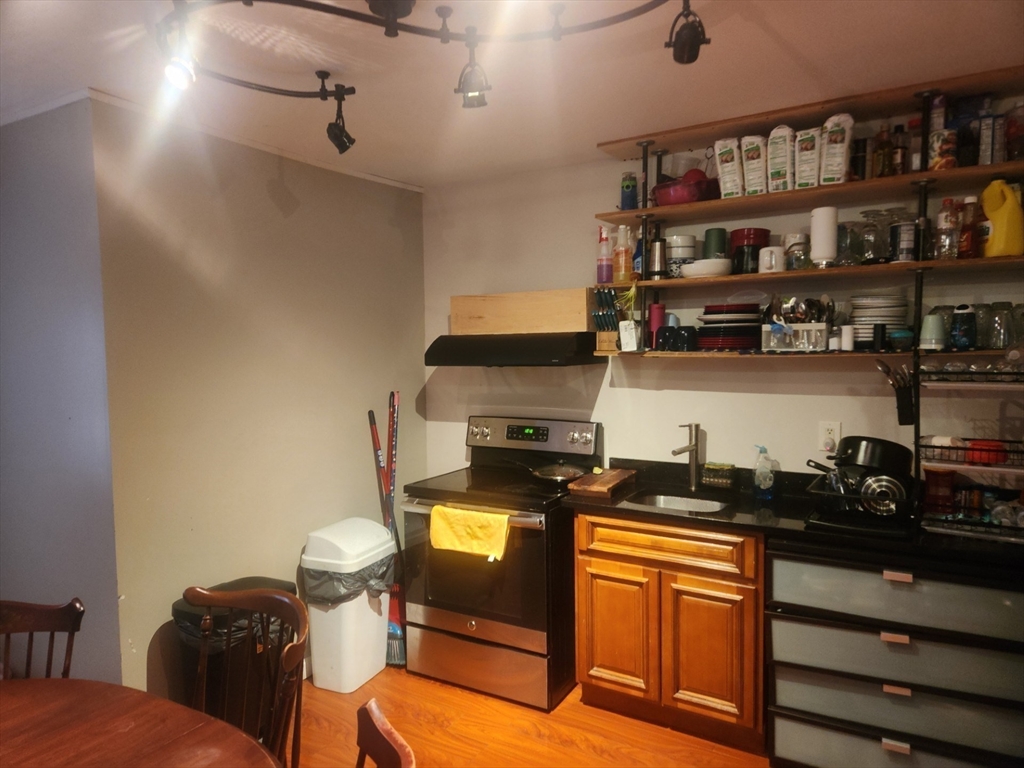
32 Sumner St, Quincy, MA 02169
$-4,448
Cash flow
-18.6%
Cash-on-Cash Return
1.4%
Cap rate
0.3%
Rent to Value Ratio
Active
$920,000
5
bds
|
4
ba
|
2,552
sqft
|
built
1890
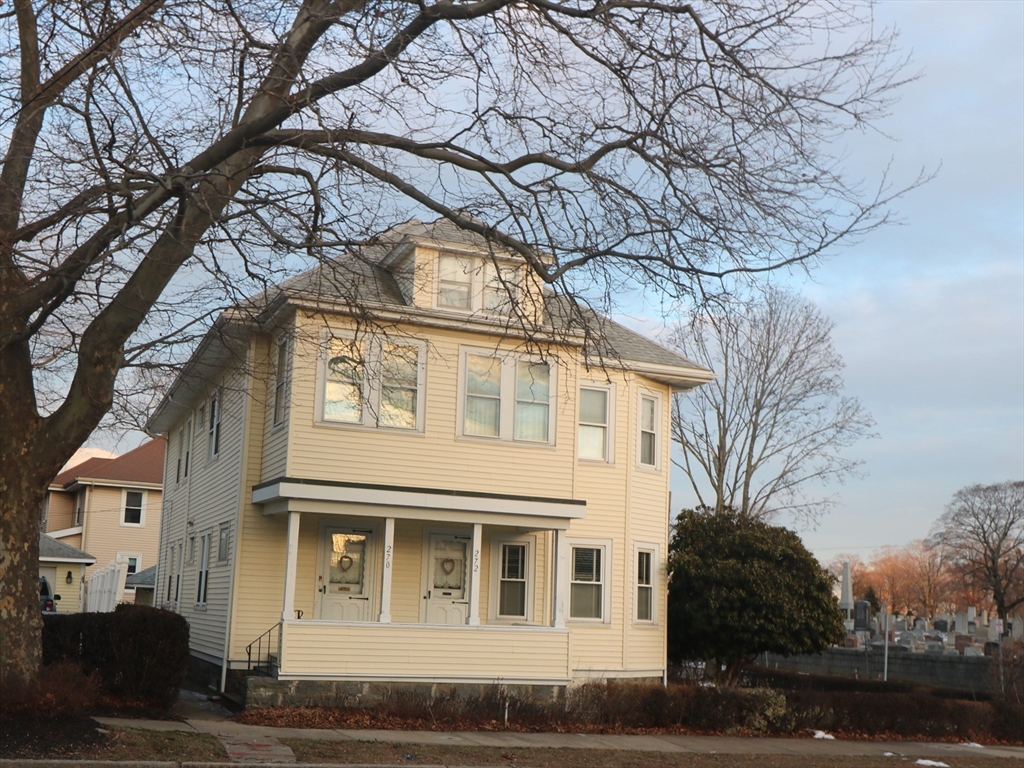
187 Washington St, Quincy, MA 02169
$-3,022
Cash flow
-17.1%
Cash-on-Cash Return
1.7%
Cap rate
0.3%
Rent to Value Ratio

Active
$1,300,000
7
bds
|
3
ba
|
2,223
sqft
|
built
1890
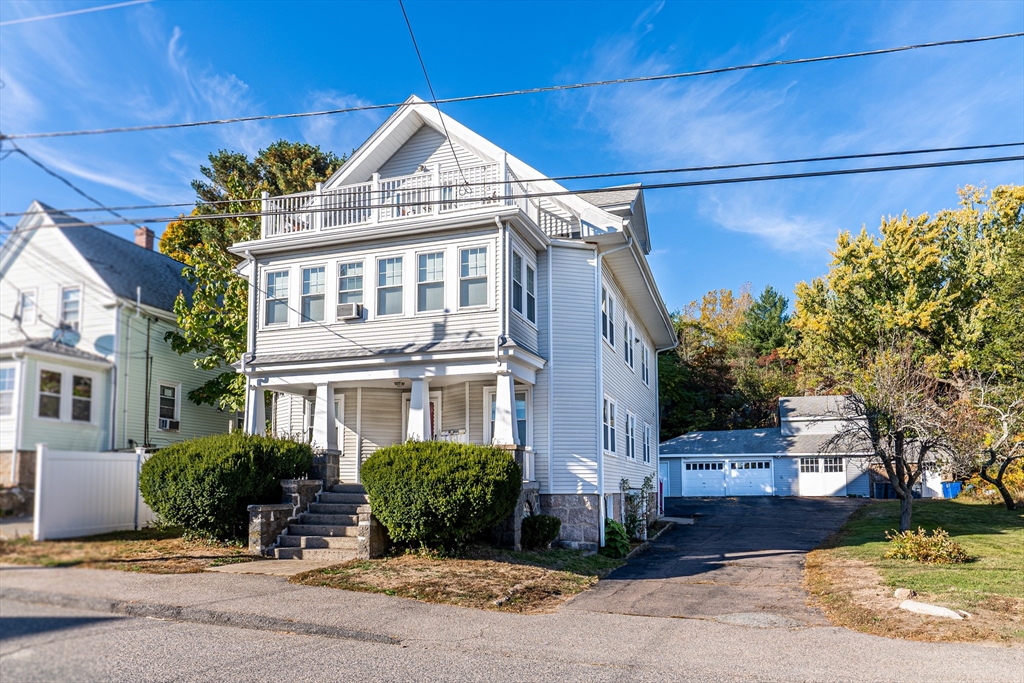
59 Germain Ave, Quincy, MA 02169
$-4,309
Cash flow
-17.3%
Cash-on-Cash Return
1.7%
Cap rate
0.3%
Rent to Value Ratio
Active
$999,000
6
bds
|
2
ba
|
2,530
sqft
|
built
1898
270 Southern Artery, Quincy, MA 02169
$-3,409
Cash flow
-17.8%
Cash-on-Cash Return
1.6%
Cap rate
0.3%
Rent to Value Ratio
Active
$1,499,000
7
bds
|
5
ba
|
2,802
sqft
|
built
1918
69 Suomi Rd, Quincy, MA 02169
$-4,881
Cash flow
-17.0%
Cash-on-Cash Return
1.8%
Cap rate
0.3%
Rent to Value Ratio