Saint Paul, MN Investment Properties for Sale
Browse homes for sale and investment properties in Saint Paul, MN. Refine your search by price, property type, or more.
Best cash flowing properties in Saint Paul, MN
Active
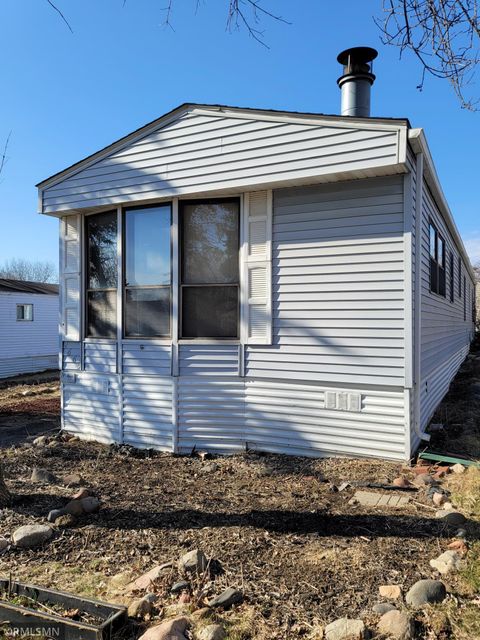
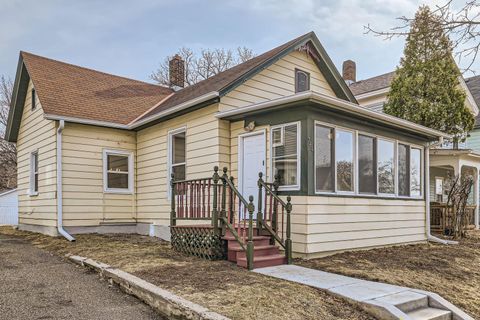
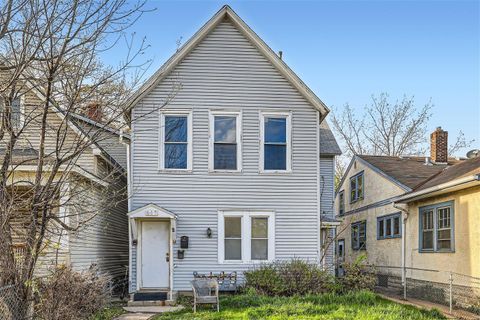
$58,000
2
bds
|
1
ba
|
1,056
sqft
|
built
1984
2665 Benlana Ct, Saint Paul, MN 55119
$1,104
Cash flow
22.2%
Cash-on-Cash Return
22.8%
Cap rate
2.8%
Rent to Value Ratio
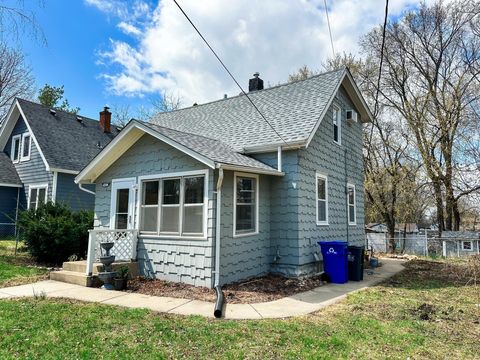
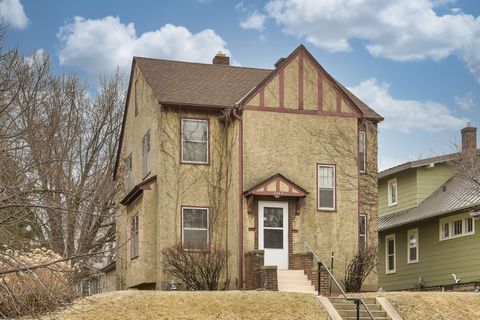
Active
$113,400
3
bds
|
2
ba
|
1,133
sqft
|
built
1889
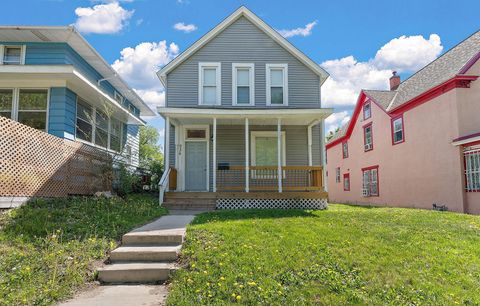
906 Wilson Ave, Saint Paul, MN 55106
$264
Cash flow
12.1%
Cash-on-Cash Return
8.5%
Cap rate
1.9%
Rent to Value Ratio
624 out of 729 properties for sale in Saint Paul, MN
Limited Results Shown
Create a free account, or log in to reveal all property listings and enjoy the complete experience.
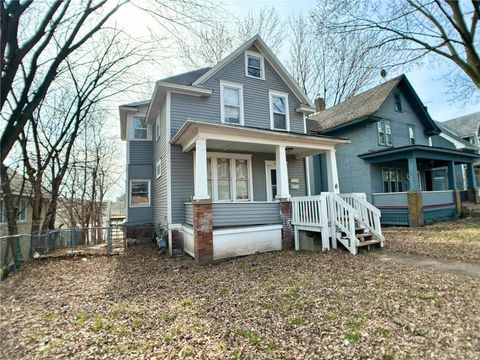
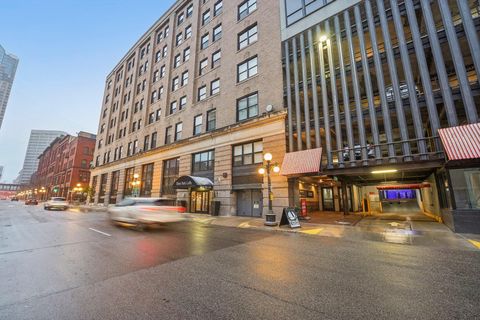
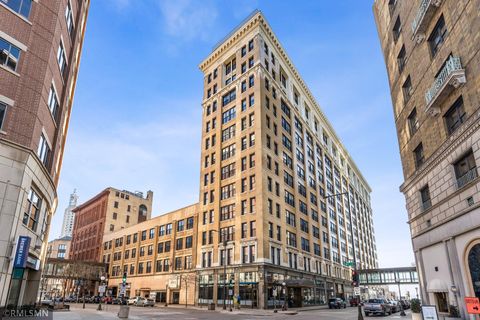
Active
$99,000
bds
|
1
ba
|
381
sqft
|
built
1908
488 Wabasha St N, Saint Paul, MN 55102
$8
Cash flow
0.4%
Cash-on-Cash Return
5.8%
Cap rate
1.3%
Rent to Value Ratio
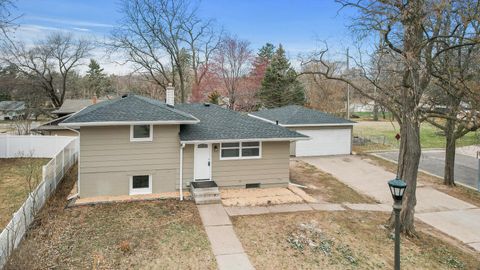
Active
$239,900
3
bds
|
2
ba
|
1,340
sqft
|
built
1922
865 Kennard St, Saint Paul, MN 55106
$-35
Cash flow
-0.8%
Cash-on-Cash Return
5.5%
Cap rate
0.8%
Rent to Value Ratio

Active
$209,900
2
bds
|
1
ba
|
943
sqft
|
built
1982
4326 Buckingham Ct, Saint Paul, MN 55127
$-135
Cash flow
-3.4%
Cash-on-Cash Return
4.9%
Cap rate
1.0%
Rent to Value Ratio
Active
$212,600
2
bds
|
2
ba
|
1,376
sqft
|
built
1886
620 Cook Ave E, Saint Paul, MN 55130
$-495
Cash flow
-12.1%
Cash-on-Cash Return
2.9%
Cap rate
0.7%
Rent to Value Ratio
Active
$1,000,000
8
bds
|
6
ba
|
6,024
sqft
|
built
1911
834 Goodrich Ave, Saint Paul, MN 55105
$-1,539
Cash flow
-8.0%
Cash-on-Cash Return
3.8%
Cap rate
0.7%
Rent to Value Ratio
Active
$245,900
2
bds
|
1
ba
|
883
sqft
|
built
1949
2049 Montreal Ave, Saint Paul, MN 55116
$-642
Cash flow
-13.6%
Cash-on-Cash Return
2.5%
Cap rate
0.7%
Rent to Value Ratio
Active
$2,350,000
6
bds
|
6
ba
|
5,823
sqft
|
built
1890
683 Osceola Ave, Saint Paul, MN 55105
$-8,635
Cash flow
-19.2%
Cash-on-Cash Return
1.3%
Cap rate
0.3%
Rent to Value Ratio

Active
$780,000
4
bds
|
2
ba
|
2,727
sqft
|
built
1926
25 Benhill Rd, Saint Paul, MN 55105
$-1,868
Cash flow
-12.5%
Cash-on-Cash Return
2.8%
Cap rate
0.4%
Rent to Value Ratio
Active
$899,000
3
bds
|
3
ba
|
3,846
sqft
|
built
2001
6 Pearson Pl, Saint Paul, MN 55127
$-2,083
Cash flow
-12.1%
Cash-on-Cash Return
2.9%
Cap rate
0.5%
Rent to Value Ratio
Active
$340,000
4
bds
|
2
ba
|
1,950
sqft
|
built
1883
936 Westminster St, Saint Paul, MN 55130
$-796
Cash flow
-12.2%
Cash-on-Cash Return
2.9%
Cap rate
0.4%
Rent to Value Ratio
Active
$210,000
6
bds
|
2
ba
|
1,976
sqft
|
built
1906
880 York Ave, Saint Paul, MN 55106
$102
Cash flow
2.5%
Cash-on-Cash Return
6.3%
Cap rate
1.0%
Rent to Value Ratio
Active
$455,000
5
bds
|
3
ba
|
3,342
sqft
|
built
1946
2411 Mc Menemy St, Saint Paul, MN 55117
$-422
Cash flow
-4.8%
Cash-on-Cash Return
4.6%
Cap rate
0.7%
Rent to Value Ratio
Active
$340,000
5
bds
|
3
ba
|
1,935
sqft
|
built
1947
602 Orange Ave E, Saint Paul, MN 55130
$-774
Cash flow
-11.9%
Cash-on-Cash Return
2.9%
Cap rate
0.5%
Rent to Value Ratio
Active
$219,900
2
bds
|
1
ba
|
940
sqft
|
built
1900
364 Bates Ave, Saint Paul, MN 55106
$-267
Cash flow
-6.3%
Cash-on-Cash Return
4.2%
Cap rate
0.7%
Rent to Value Ratio

Active
$170,000
2
bds
|
1
ba
|
742
sqft
|
built
1922
188 Acker St E, Saint Paul, MN 55117
$-56
Cash flow
-1.7%
Cash-on-Cash Return
5.3%
Cap rate
0.8%
Rent to Value Ratio

Active
$99,900
1
bds
|
1
ba
|
713
sqft
|
built
1915
523 Jackson St, Saint Paul, MN 55101
$-437
Cash flow
-22.8%
Cash-on-Cash Return
0.4%
Cap rate
1.2%
Rent to Value Ratio
Active
$315,000
4
bds
|
2
ba
|
1,200
sqft
|
built
1972
237 Sigurd St, Saint Paul, MN 55106
$-491
Cash flow
-8.1%
Cash-on-Cash Return
3.8%
Cap rate
0.6%
Rent to Value Ratio
Active
$375,000
2
bds
|
2
ba
|
1,668
sqft
|
built
1929
1362 Saint Clair Ave, Saint Paul, MN 55105
$-1,046
Cash flow
-14.6%
Cash-on-Cash Return
2.3%
Cap rate
0.5%
Rent to Value Ratio
Active
$200,000
1
bds
|
1
ba
|
720
sqft
|
built
1905
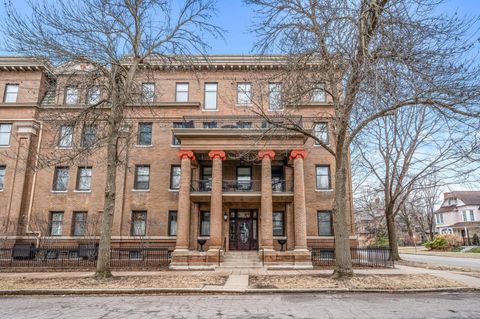
406 Wacouta St, Saint Paul, MN 55101
$-758
Cash flow
-19.8%
Cash-on-Cash Return
1.1%
Cap rate
0.8%
Rent to Value Ratio
Active
$269,000
5
bds
|
3
ba
|
2,256
sqft
|
built
1893
617 Maryland Ave E, Saint Paul, MN 55130
$-563
Cash flow
-10.9%
Cash-on-Cash Return
3.2%
Cap rate
0.7%
Rent to Value Ratio
Active
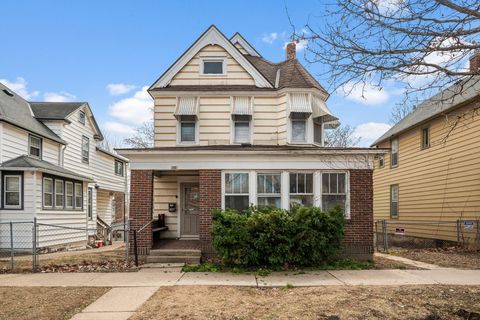
$113,400
3
bds
|
2
ba
|
1,133
sqft
|
built
1889
906 Wilson Ave, Saint Paul, MN 55106
$264
Cash flow
12.1%
Cash-on-Cash Return
8.5%
Cap rate
1.9%
Rent to Value Ratio
Active
$805,000
3
bds
|
3
ba
|
3,456
sqft
|
built
1918
15 Benhill Rd, Saint Paul, MN 55105
$-2,076
Cash flow
-13.5%
Cash-on-Cash Return
2.6%
Cap rate
0.5%
Rent to Value Ratio
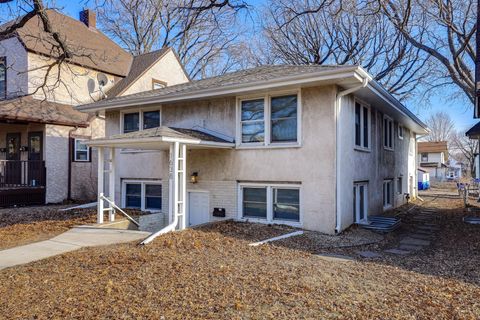
Active
$58,000
2
bds
|
1
ba
|
1,056
sqft
|
built
1984
2665 Benlana Ct, Saint Paul, MN 55119
$1,104
Cash flow
22.2%
Cash-on-Cash Return
22.8%
Cap rate
2.8%
Rent to Value Ratio

Active
$125,909
2
bds
|
1
ba
|
807
sqft
|
built
1987
78 10th St E, Saint Paul, MN 55101
$-661
Cash flow
-27.4%
Cash-on-Cash Return
-0.6%
Cap rate
1.2%
Rent to Value Ratio
Active
$1,799,000
3
bds
|
4
ba
|
5,120
sqft
|
built
1955
4 W Shore Rd, Saint Paul, MN 55127
$-3,932
Cash flow
-11.4%
Cash-on-Cash Return
3.1%
Cap rate
0.5%
Rent to Value Ratio

Active
$118,950
2
bds
|
1
ba
|
900
sqft
|
built
1972
4130 Rahn Rd, Saint Paul, MN 55122
$-139
Cash flow
-6.1%
Cash-on-Cash Return
4.3%
Cap rate
1.3%
Rent to Value Ratio

Active
$222,000
3
bds
|
2
ba
|
1,462
sqft
|
built
1888
959 Greenbrier St, Saint Paul, MN 55106
$71
Cash flow
1.7%
Cash-on-Cash Return
6.1%
Cap rate
0.9%
Rent to Value Ratio
Active
$184,900
1
bds
|
1
ba
|
648
sqft
|
built
2006
406 Wacouta St, Saint Paul, MN 55101
$-744
Cash flow
-21.0%
Cash-on-Cash Return
0.9%
Cap rate
0.8%
Rent to Value Ratio

Active
$99,900
1
bds
|
1
ba
|
540
sqft
|
built
1908
488 Wabasha St N, Saint Paul, MN 55102
$-243
Cash flow
-12.7%
Cash-on-Cash Return
2.8%
Cap rate
1.2%
Rent to Value Ratio

Active
$599,900
2
bds
|
2
ba
|
1,583
sqft
|
built
2007
240 Spring St, Saint Paul, MN 55102
$-2,037
Cash flow
-17.7%
Cash-on-Cash Return
1.6%
Cap rate
0.5%
Rent to Value Ratio
Active
$475,000
3
bds
|
1
ba
|
1,828
sqft
|
built
1904
438 Portland Ave, Saint Paul, MN 55102
$-1,449
Cash flow
-15.9%
Cash-on-Cash Return
2.0%
Cap rate
0.7%
Rent to Value Ratio

Active
$139,900
2
bds
|
1
ba
|
807
sqft
|
built
1987
78 10th St E, Saint Paul, MN 55101
$-646
Cash flow
-24.1%
Cash-on-Cash Return
0.1%
Cap rate
1.1%
Rent to Value Ratio
Active
$284,000
4
bds
|
2
ba
|
2,743
sqft
|
built
1885
618 Magnolia Ave E, Saint Paul, MN 55130
$-601
Cash flow
-11.0%
Cash-on-Cash Return
3.1%
Cap rate
0.6%
Rent to Value Ratio
Active
$150,000
1
bds
|
1
ba
|
778
sqft
|
built
1896
350 Saint Peter St, Saint Paul, MN 55102
$-292
Cash flow
-10.2%
Cash-on-Cash Return
3.3%
Cap rate
1.2%
Rent to Value Ratio

Active
$125,950
2
bds
|
1
ba
|
900
sqft
|
built
1972
4110 Rahn Rd, Saint Paul, MN 55122
$-173
Cash flow
-7.2%
Cash-on-Cash Return
4.0%
Cap rate
1.2%
Rent to Value Ratio
Active
$185,000
2
bds
|
1
ba
|
960
sqft
|
built
1987
993 Heritage Ct E, Saint Paul, MN 55127
$-19
Cash flow
-0.5%
Cash-on-Cash Return
5.6%
Cap rate
1.1%
Rent to Value Ratio
Active
$519,900
6
bds
|
4
ba
|
2,576
sqft
|
built
1959
1638 Marshall Ave, Saint Paul, MN 55104
$-1,680
Cash flow
-16.9%
Cash-on-Cash Return
1.8%
Cap rate
0.4%
Rent to Value Ratio

Active
$225,000
1
bds
|
1
ba
|
778
sqft
|
built
2004
270 4th St E, Saint Paul, MN 55101
$-853
Cash flow
-19.8%
Cash-on-Cash Return
1.1%
Cap rate
0.8%
Rent to Value Ratio
Active
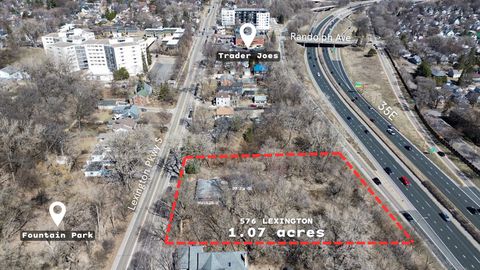
$749,900
2
bds
|
2
ba
|
1,258
sqft
|
built
1953
576 Lexington Pkwy S, Saint Paul, MN 55116
$-2,212
Cash flow
-15.4%
Cash-on-Cash Return
2.1%
Cap rate
0.3%
Rent to Value Ratio

Active
$124,900
1
bds
|
1
ba
|
685
sqft
|
built
2006
1776 Maryland Ave E, Saint Paul, MN 55106
$-39
Cash flow
-1.6%
Cash-on-Cash Return
5.3%
Cap rate
1.1%
Rent to Value Ratio