Saint Paul, MN Investment Properties for Sale
Browse homes for sale and investment properties in Saint Paul, MN. Refine your search by price, property type, or more.
Best cash flowing properties in Saint Paul, MN
Active
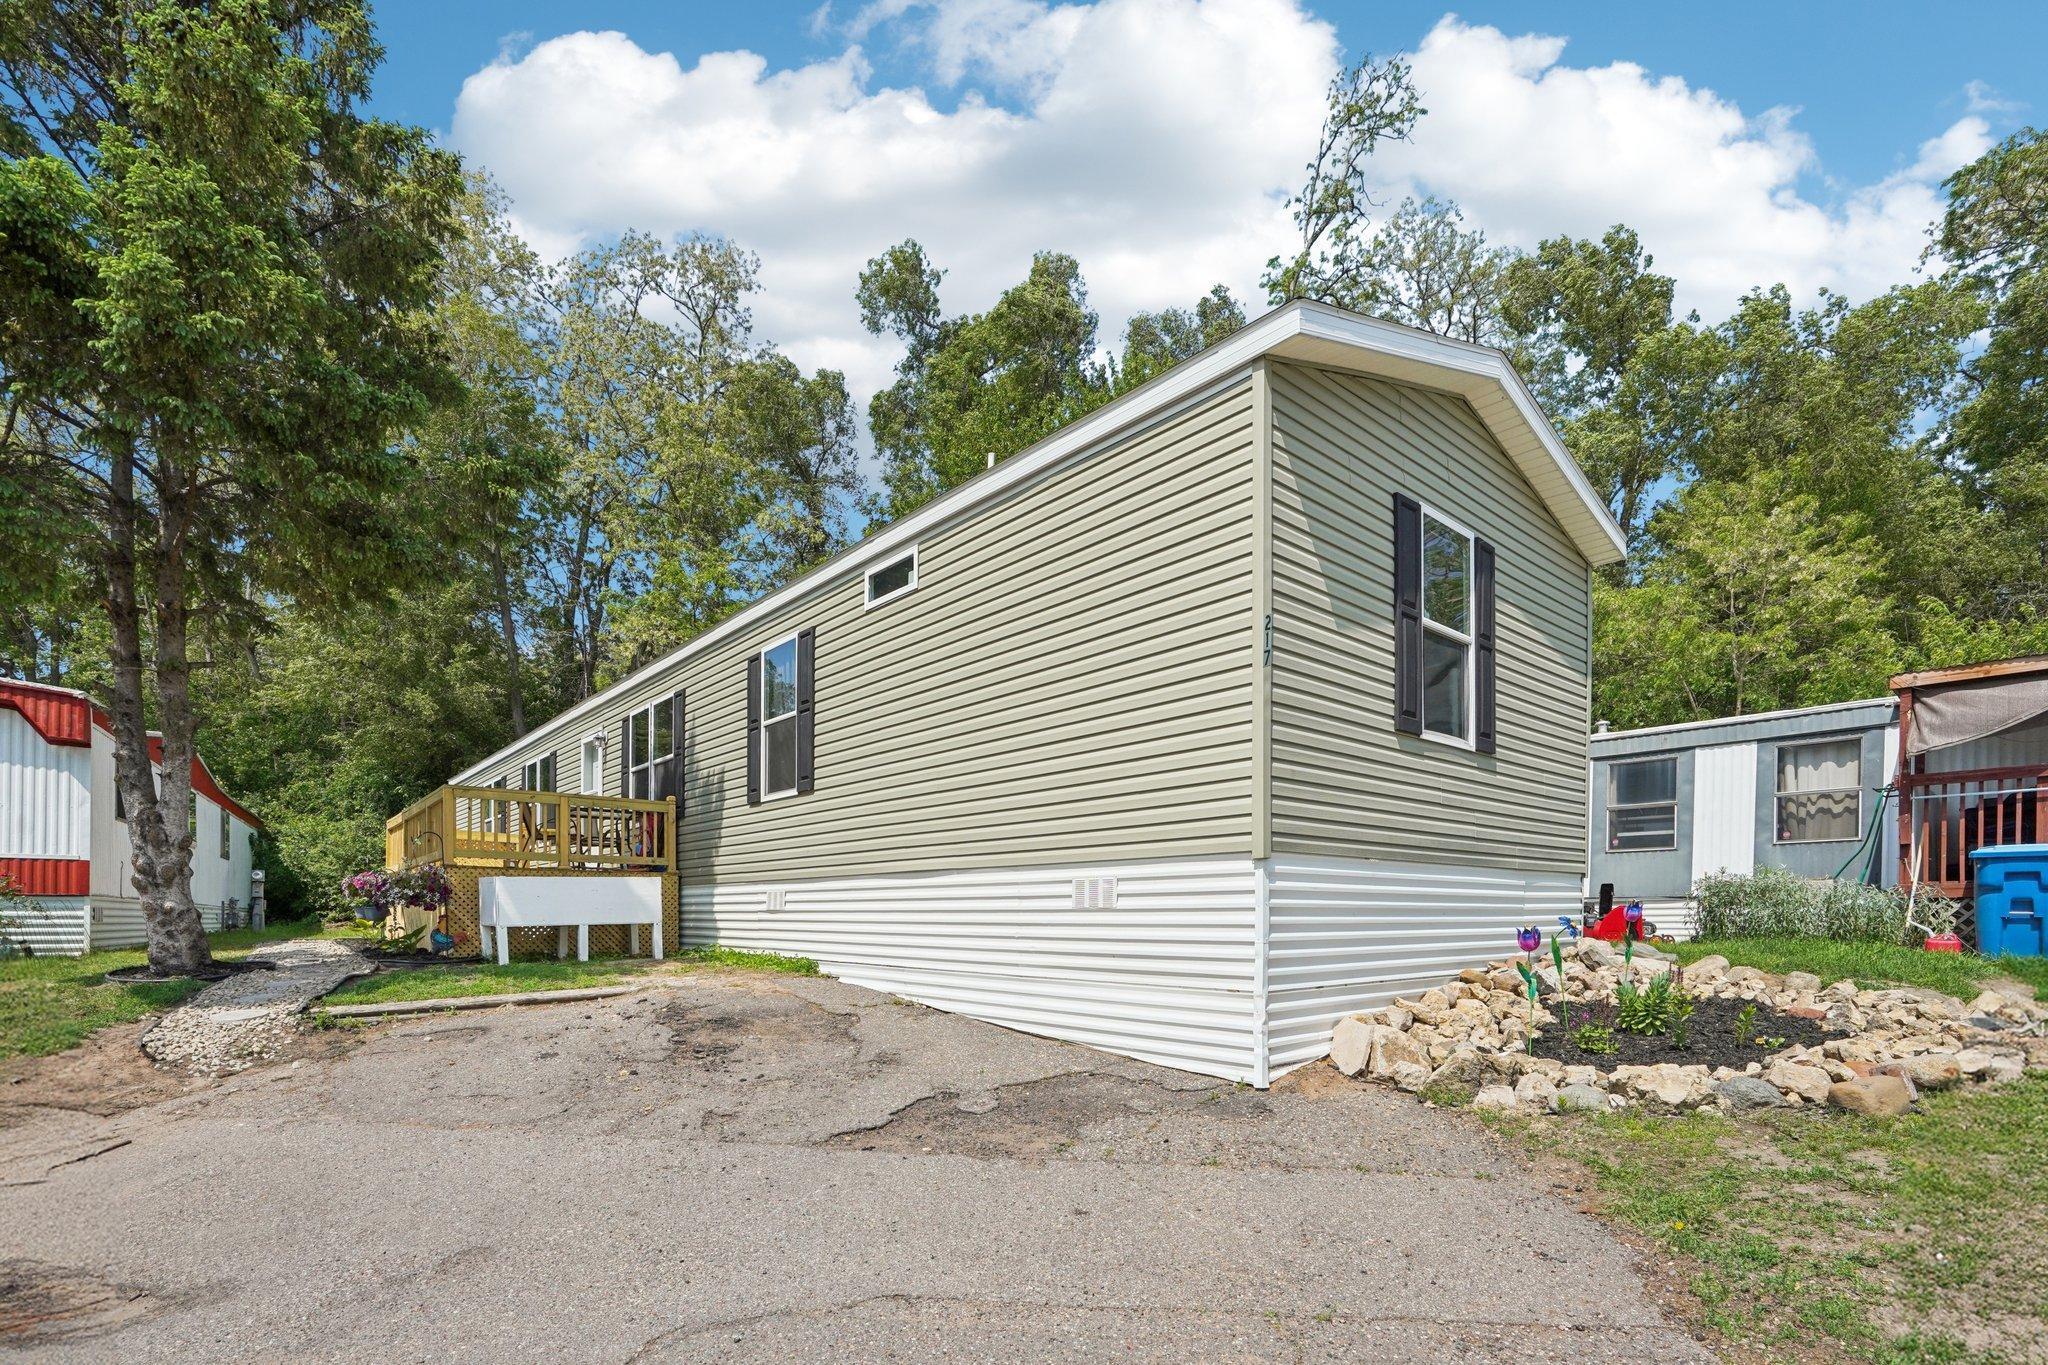
$125,000
3
bds
|
2
ba
|
1,216
sqft
|
built
2022
217 Mayfair Rd, Saint Paul, MN 55127
$725
Cash flow
30.3%
Cash-on-Cash Return
13.2%
Cap rate
1.6%
Rent to Value Ratio
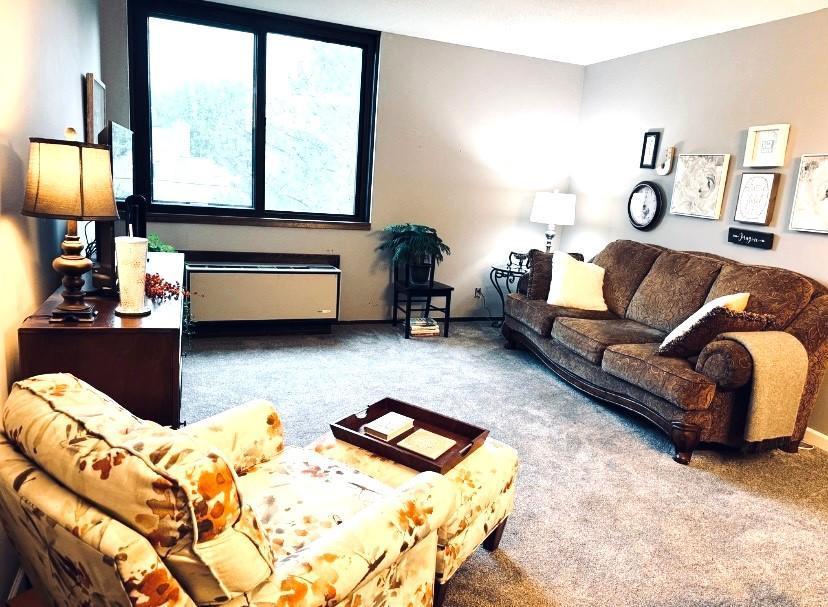
Active
$97,900
1
bds
|
1
ba
|
667
sqft
|
built
1978
1181 Edgcumbe Rd, Saint Paul, MN 55105
$-32
Cash flow
-1.7%
Cash-on-Cash Return
5.9%
Cap rate
1.2%
Rent to Value Ratio
601 out of 696 properties for sale in Saint Paul, MN
Limited Results Shown
Create a free account, or log in to reveal all property listings and enjoy the complete experience.
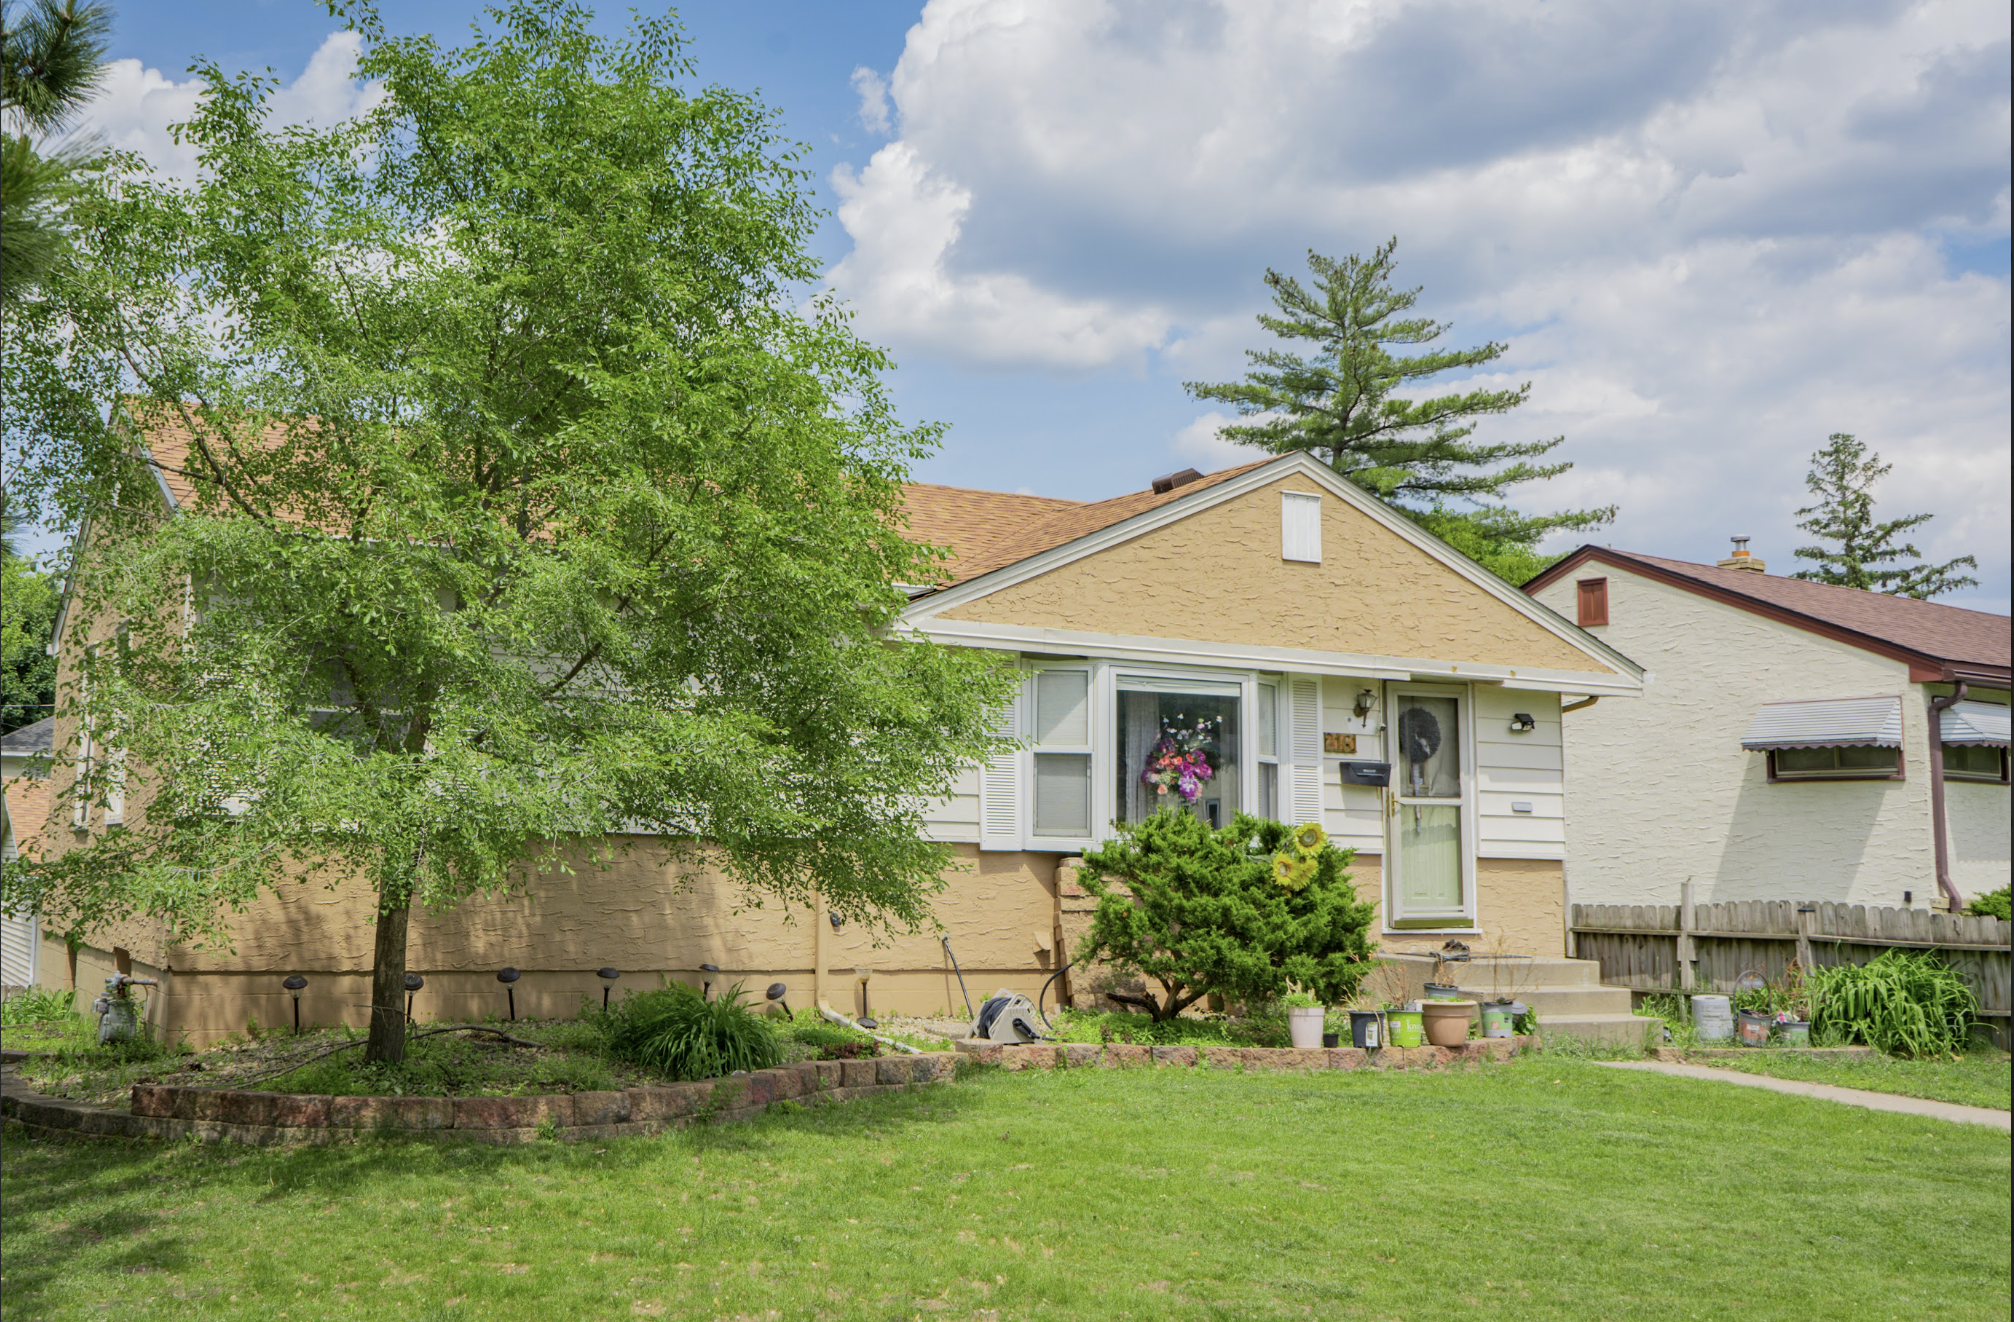
Active
$330,000
5
bds
|
2
ba
|
2,002
sqft
|
built
1962
2161 Ross Ave E, Saint Paul, MN 55119
$-543
Cash flow
-8.6%
Cash-on-Cash Return
4.3%
Cap rate
0.7%
Rent to Value Ratio
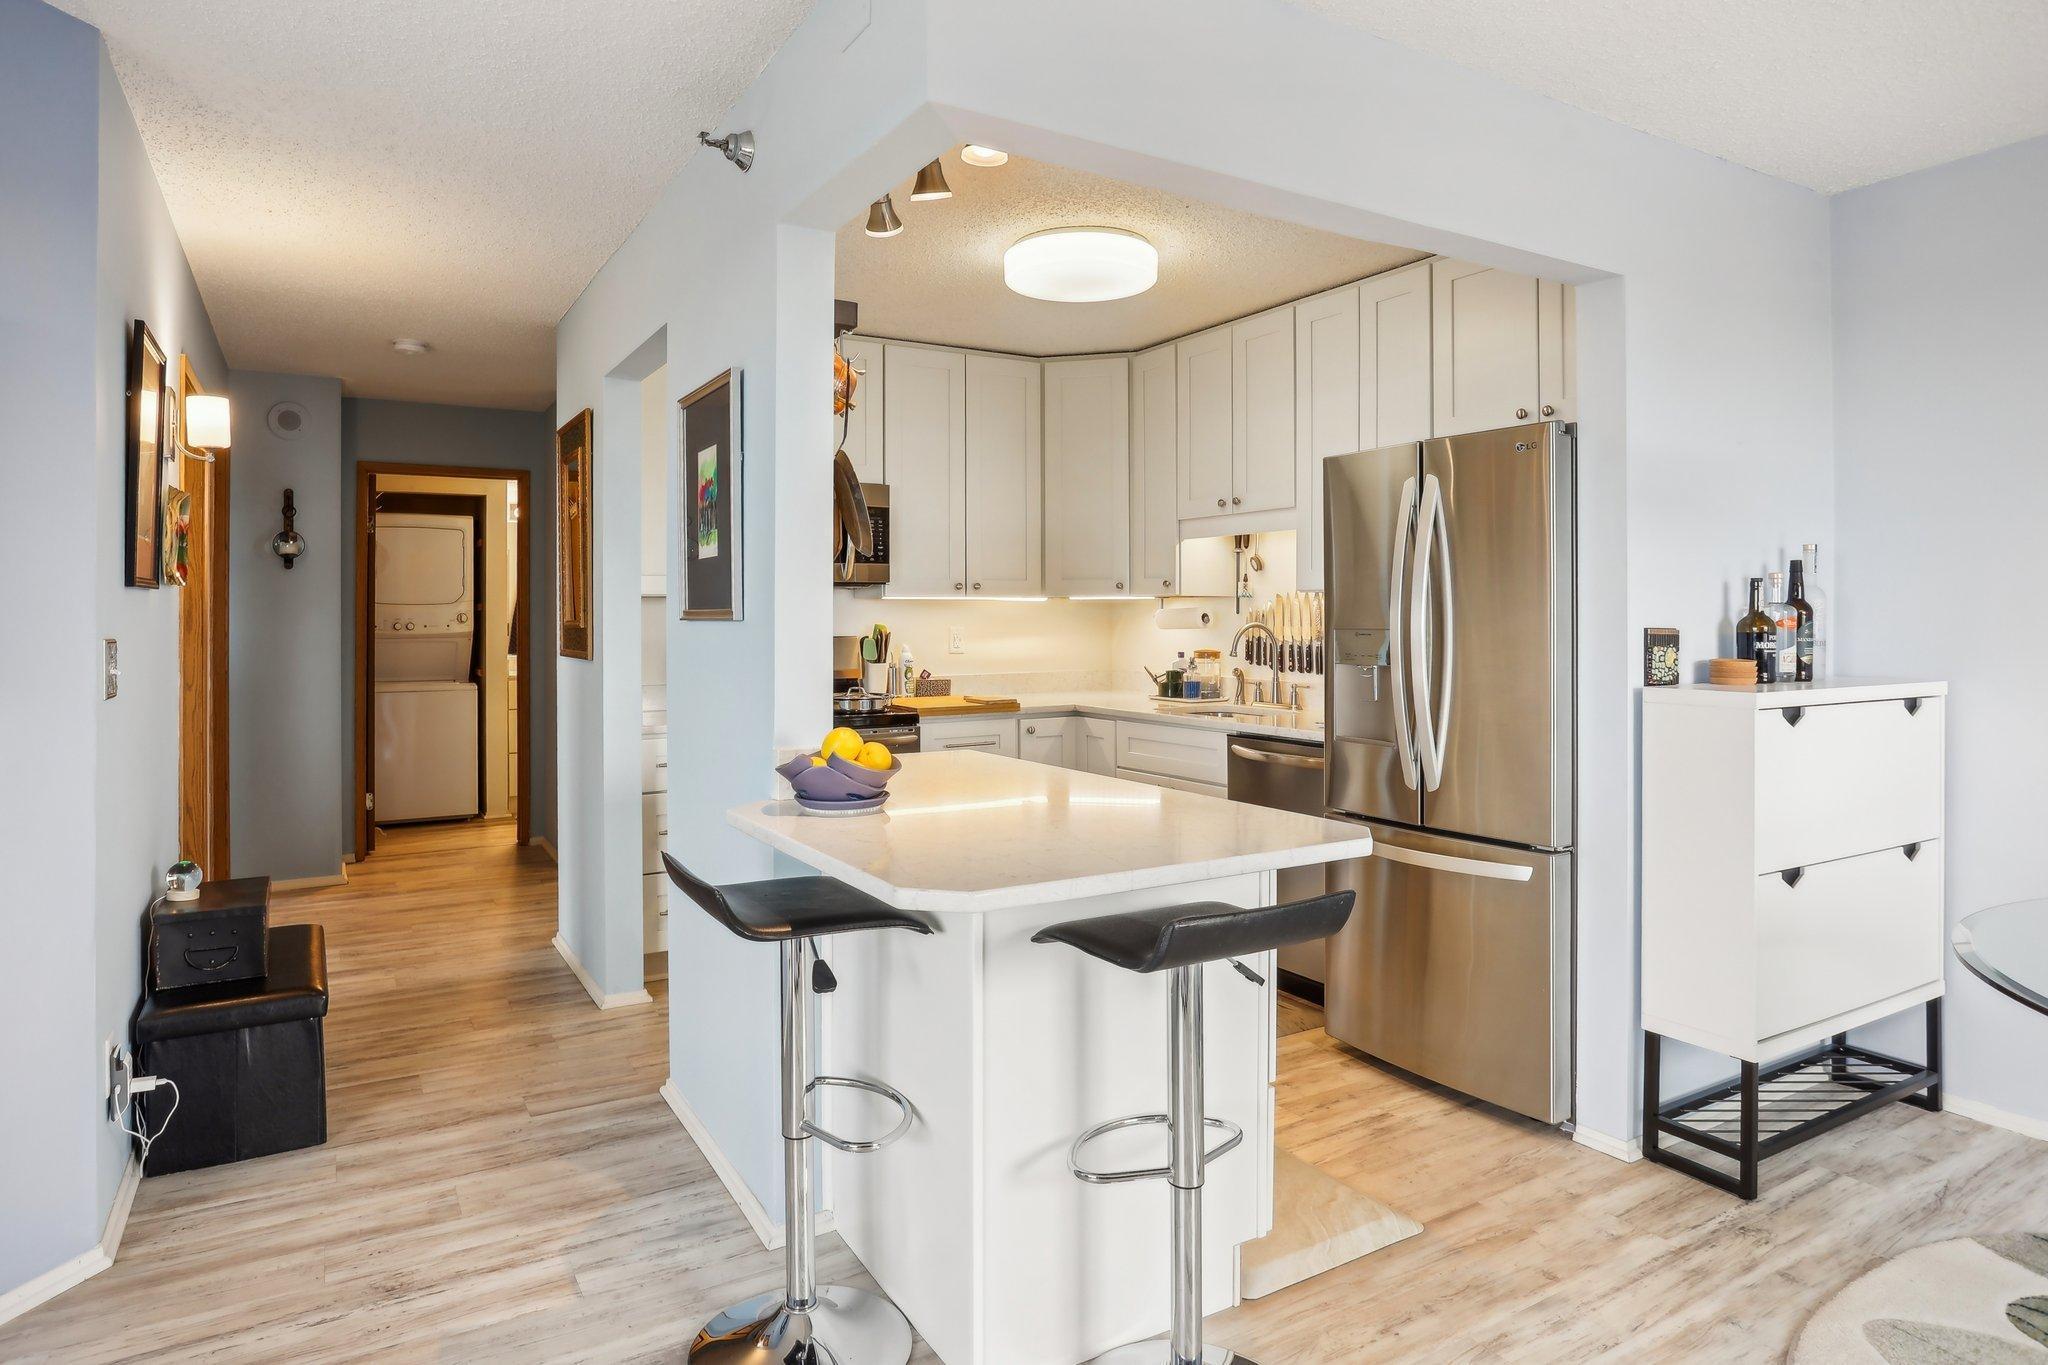
Active
$174,500
2
bds
|
1
ba
|
918
sqft
|
built
1987
78 10th St E, Saint Paul, MN 55101
$-823
Cash flow
-24.6%
Cash-on-Cash Return
0.6%
Cap rate
1.0%
Rent to Value Ratio
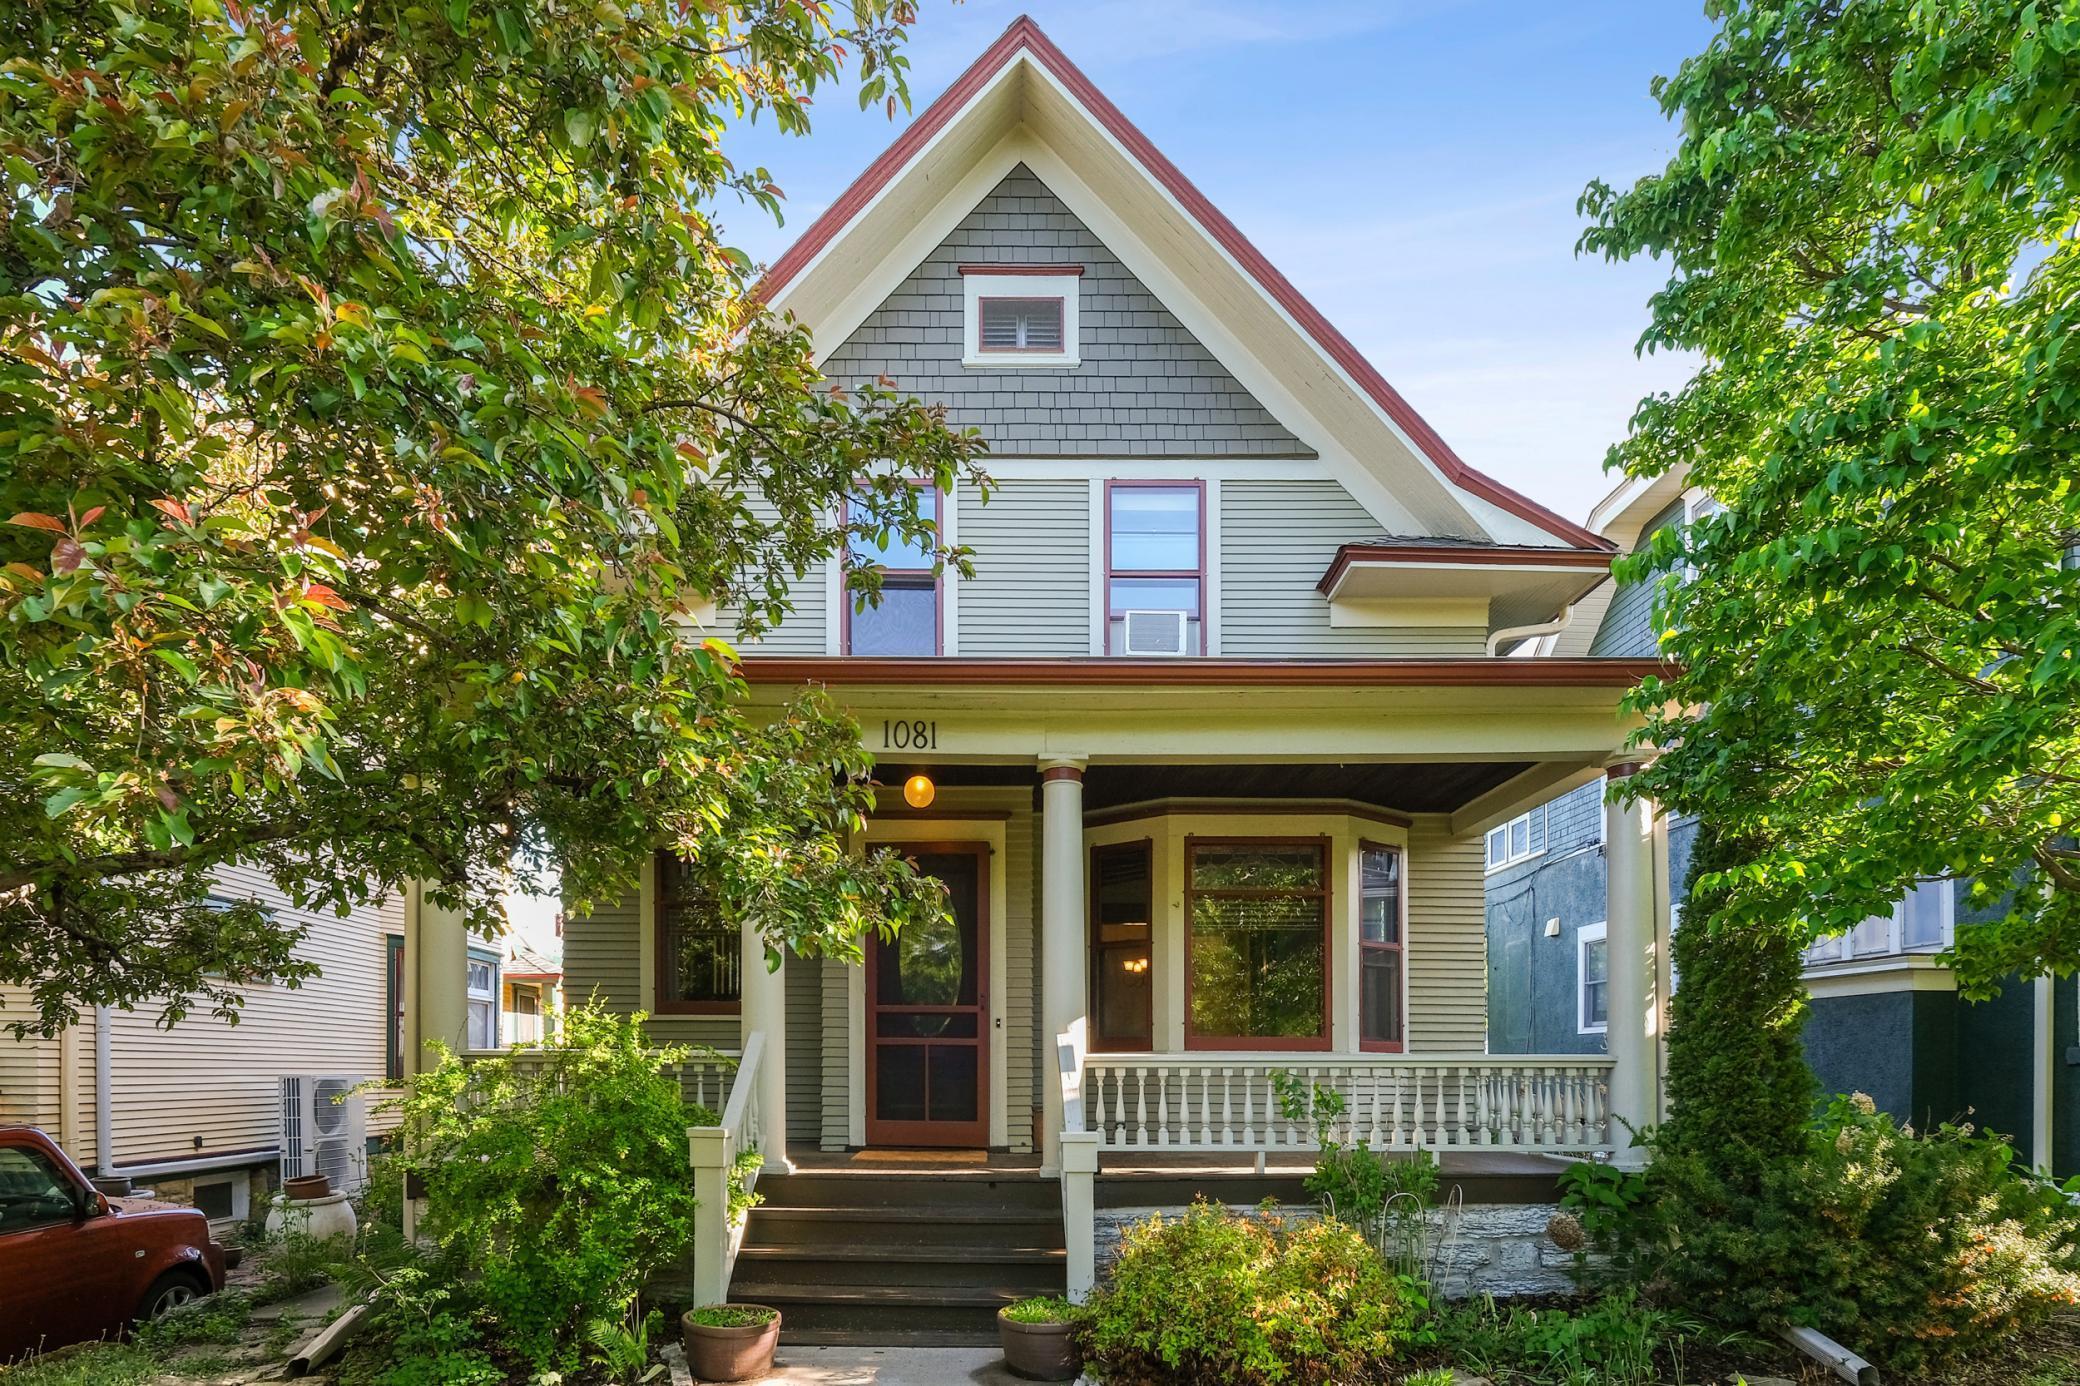
Pending
$585,000
3
bds
|
3
ba
|
2,293
sqft
|
built
1908
1081 Lincoln Ave, Saint Paul, MN 55105
$-1,335
Cash flow
-11.9%
Cash-on-Cash Return
3.5%
Cap rate
0.6%
Rent to Value Ratio
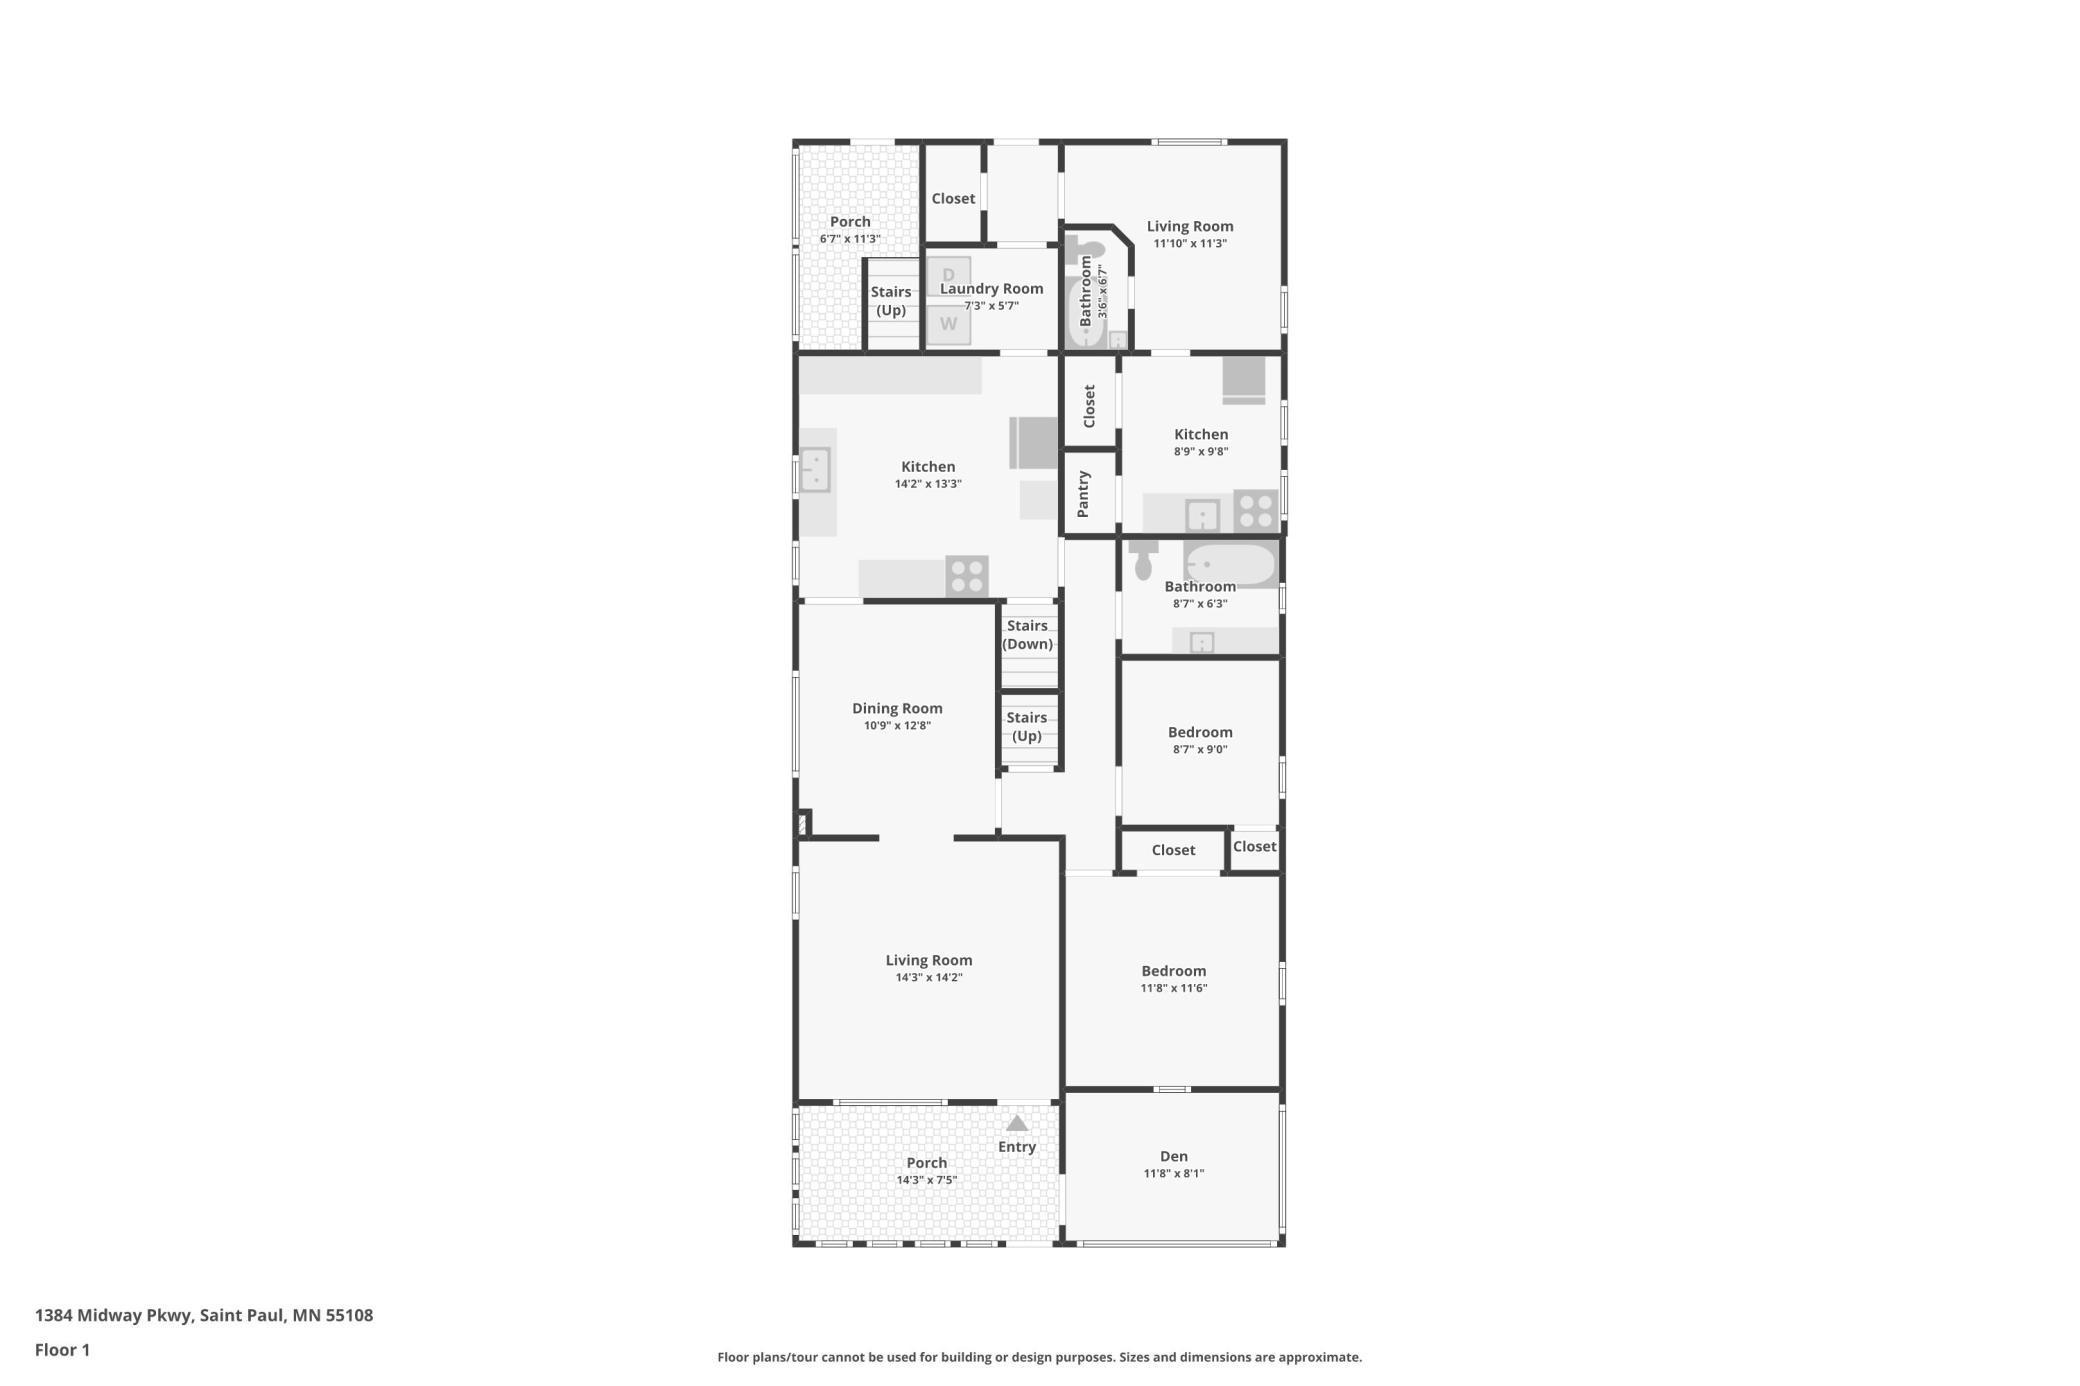
Active
$439,900
5
bds
|
3
ba
|
3,300
sqft
|
built
1912
1384 Midway Pkwy, Saint Paul, MN 55108
$-1,417
Cash flow
-16.8%
Cash-on-Cash Return
2.4%
Cap rate
0.5%
Rent to Value Ratio
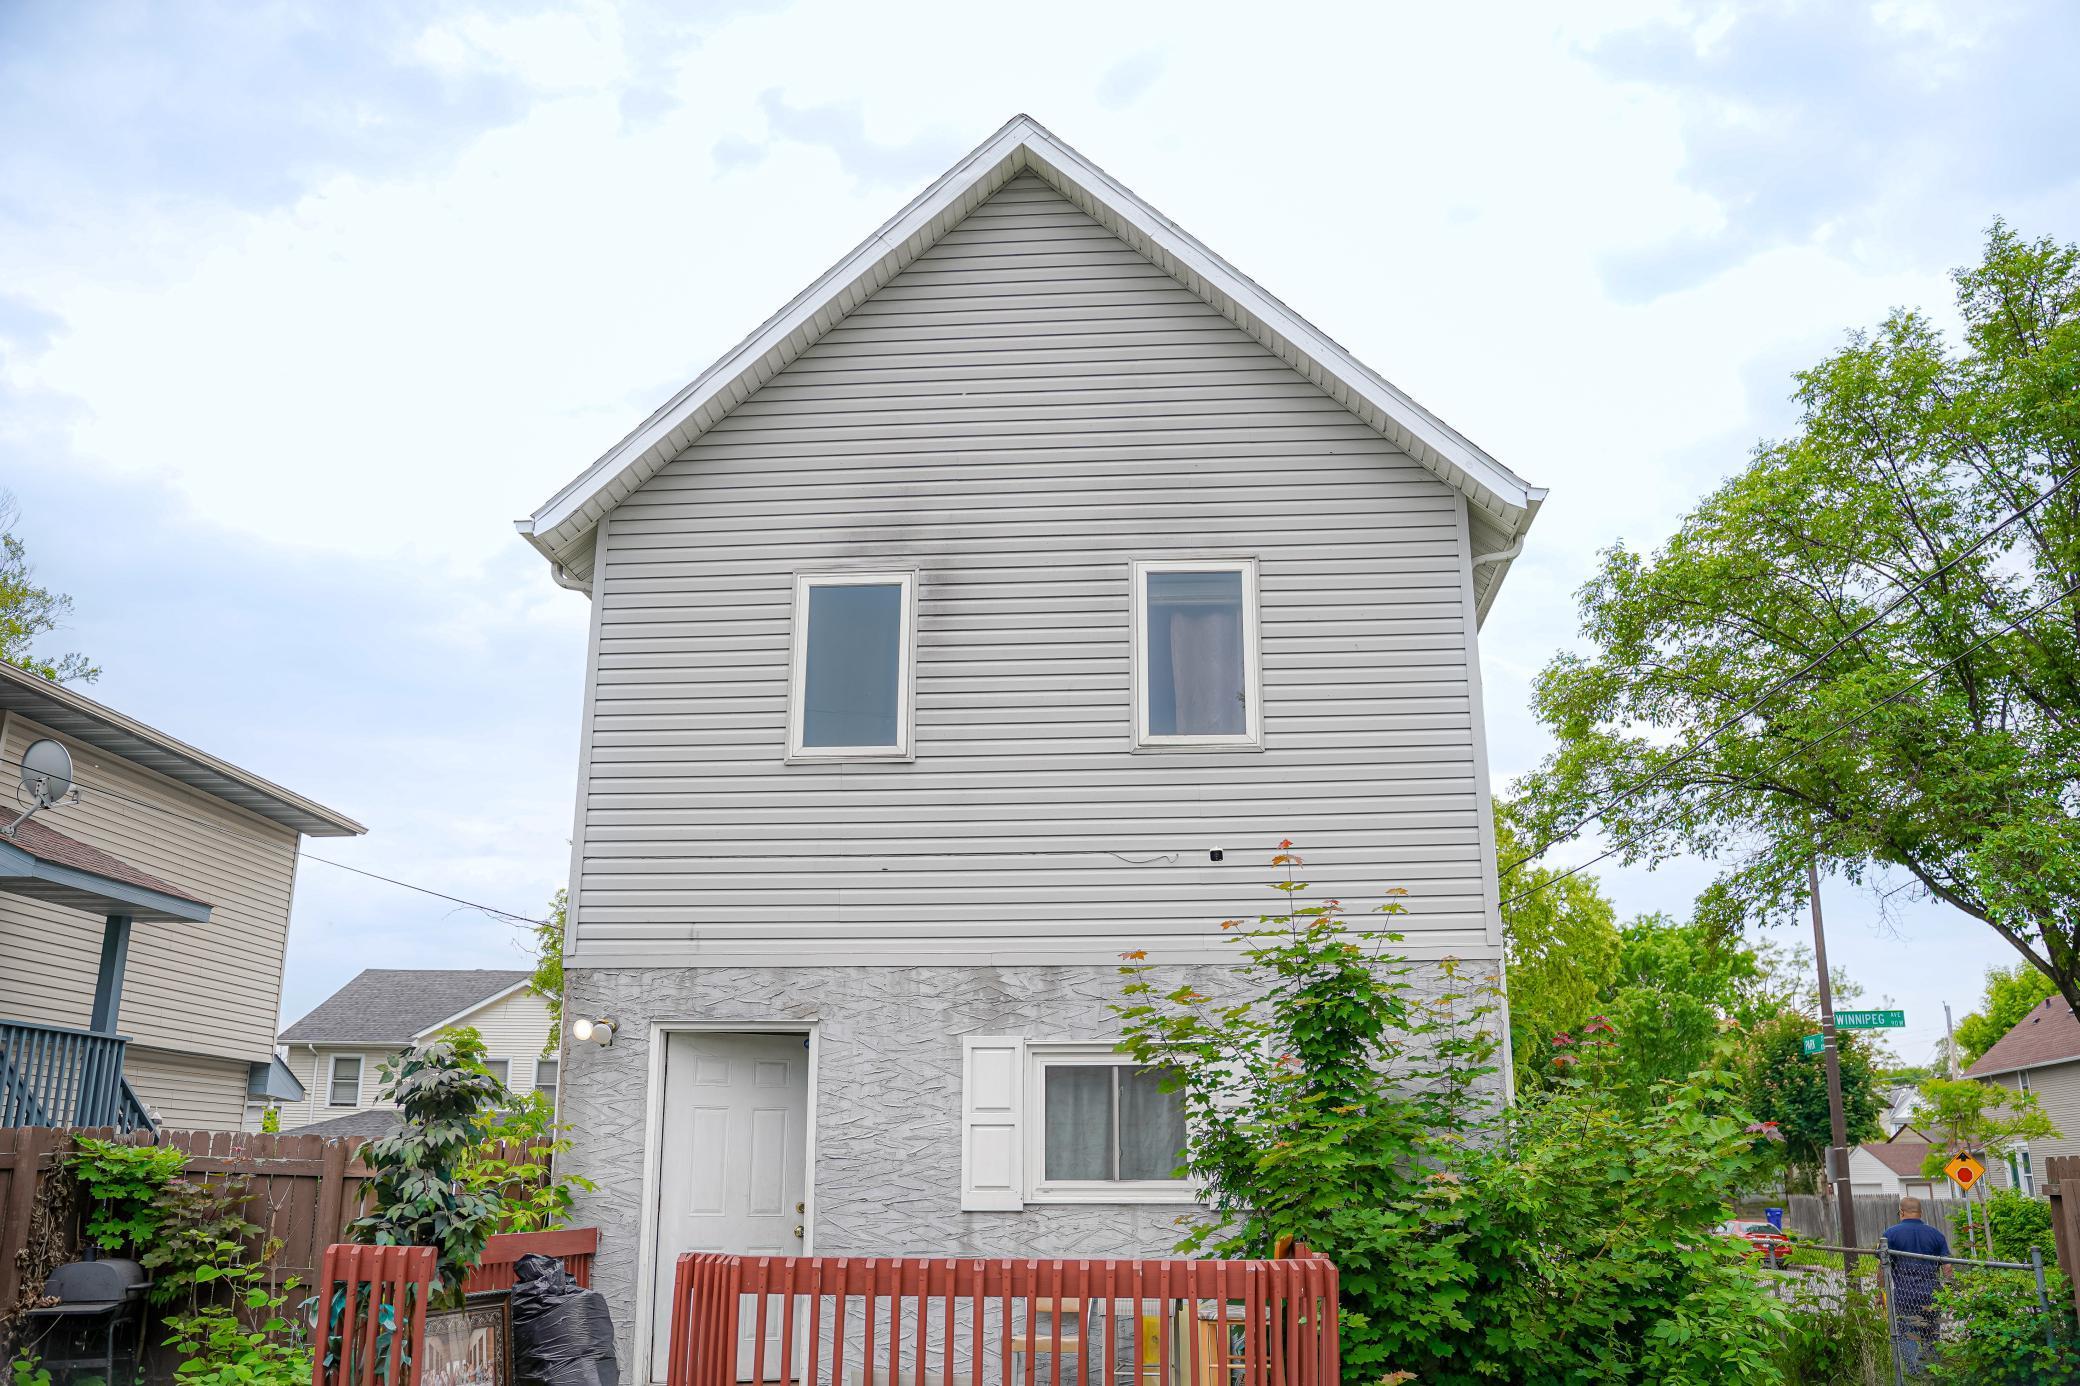
Active
$199,900
4
bds
|
2
ba
|
1,188
sqft
|
built
1879
89 Winnipeg Ave, Saint Paul, MN 55117
$-70
Cash flow
-1.8%
Cash-on-Cash Return
5.9%
Cap rate
0.9%
Rent to Value Ratio
Active
$325,000
2
bds
|
2
ba
|
1,325
sqft
|
built
2003
2566 Ellis Ave, Saint Paul, MN 55114
$-1,146
Cash flow
-18.4%
Cash-on-Cash Return
2.1%
Cap rate
0.7%
Rent to Value Ratio
Active
$550,000
4
bds
|
2
ba
|
2,080
sqft
|
built
1925
2292 Valentine Ave, Saint Paul, MN 55108
$-1,924
Cash flow
-18.3%
Cash-on-Cash Return
2.1%
Cap rate
0.5%
Rent to Value Ratio
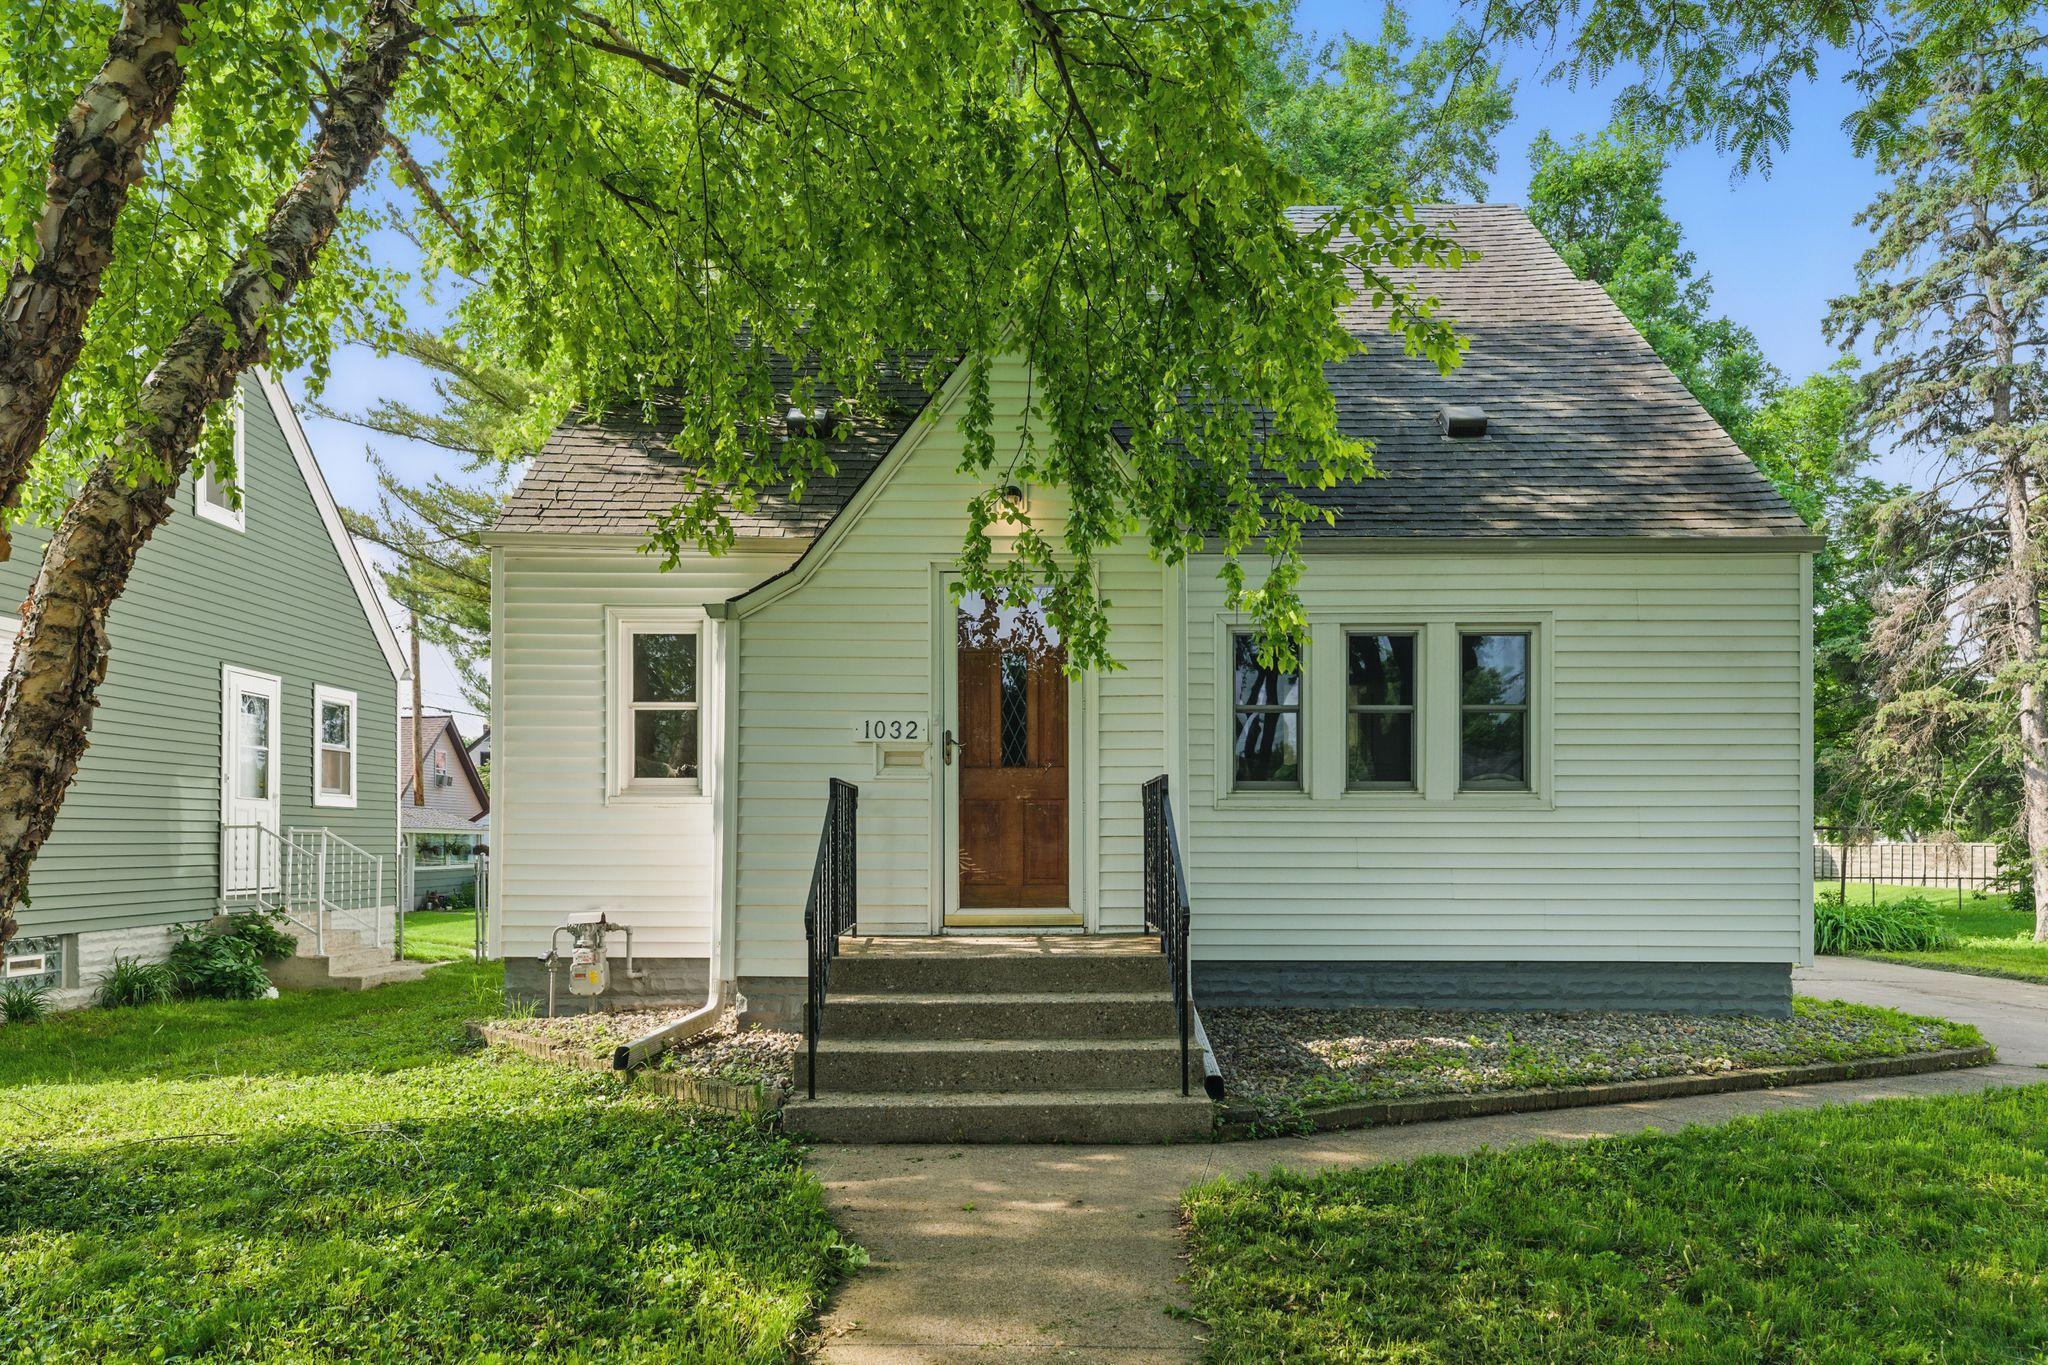
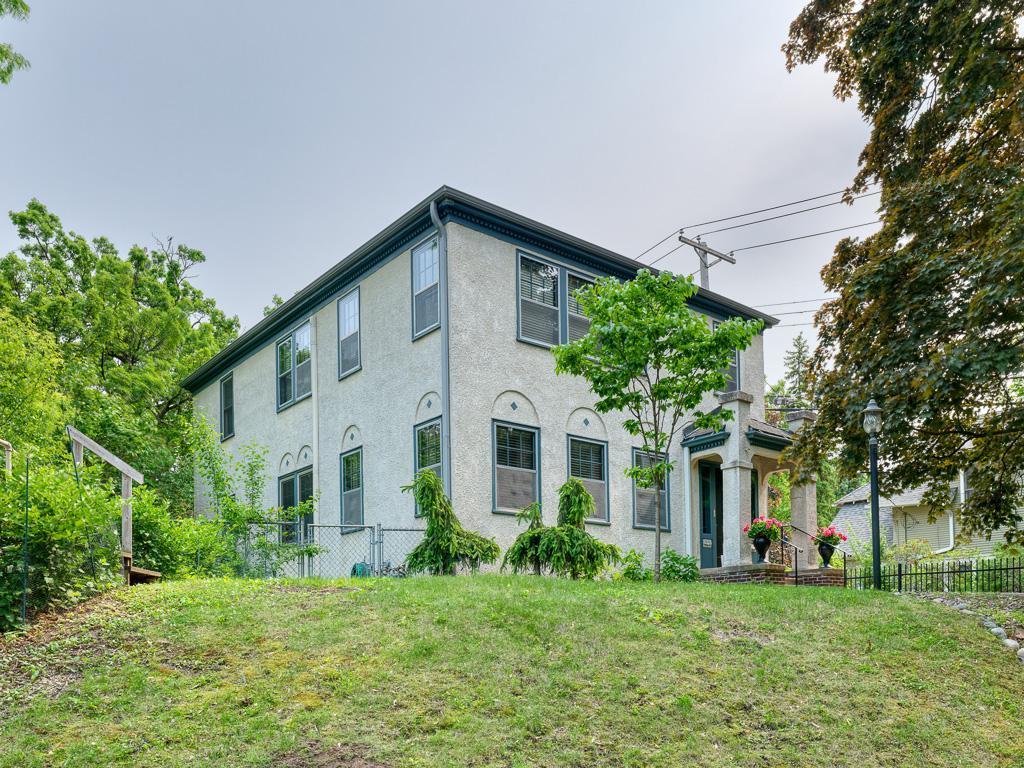
Active
$375,000
4
bds
|
1
ba
|
1,888
sqft
|
built
1939
1032 Scheffer Ave, Saint Paul, MN 55102
$-566
Cash flow
-7.9%
Cash-on-Cash Return
4.5%
Cap rate
0.7%
Rent to Value Ratio
Active
$169,000
1
bds
|
1
ba
|
863
sqft
|
built
2001
445 Wacouta St, Saint Paul, MN 55101
$-537
Cash flow
-16.6%
Cash-on-Cash Return
2.5%
Cap rate
0.9%
Rent to Value Ratio
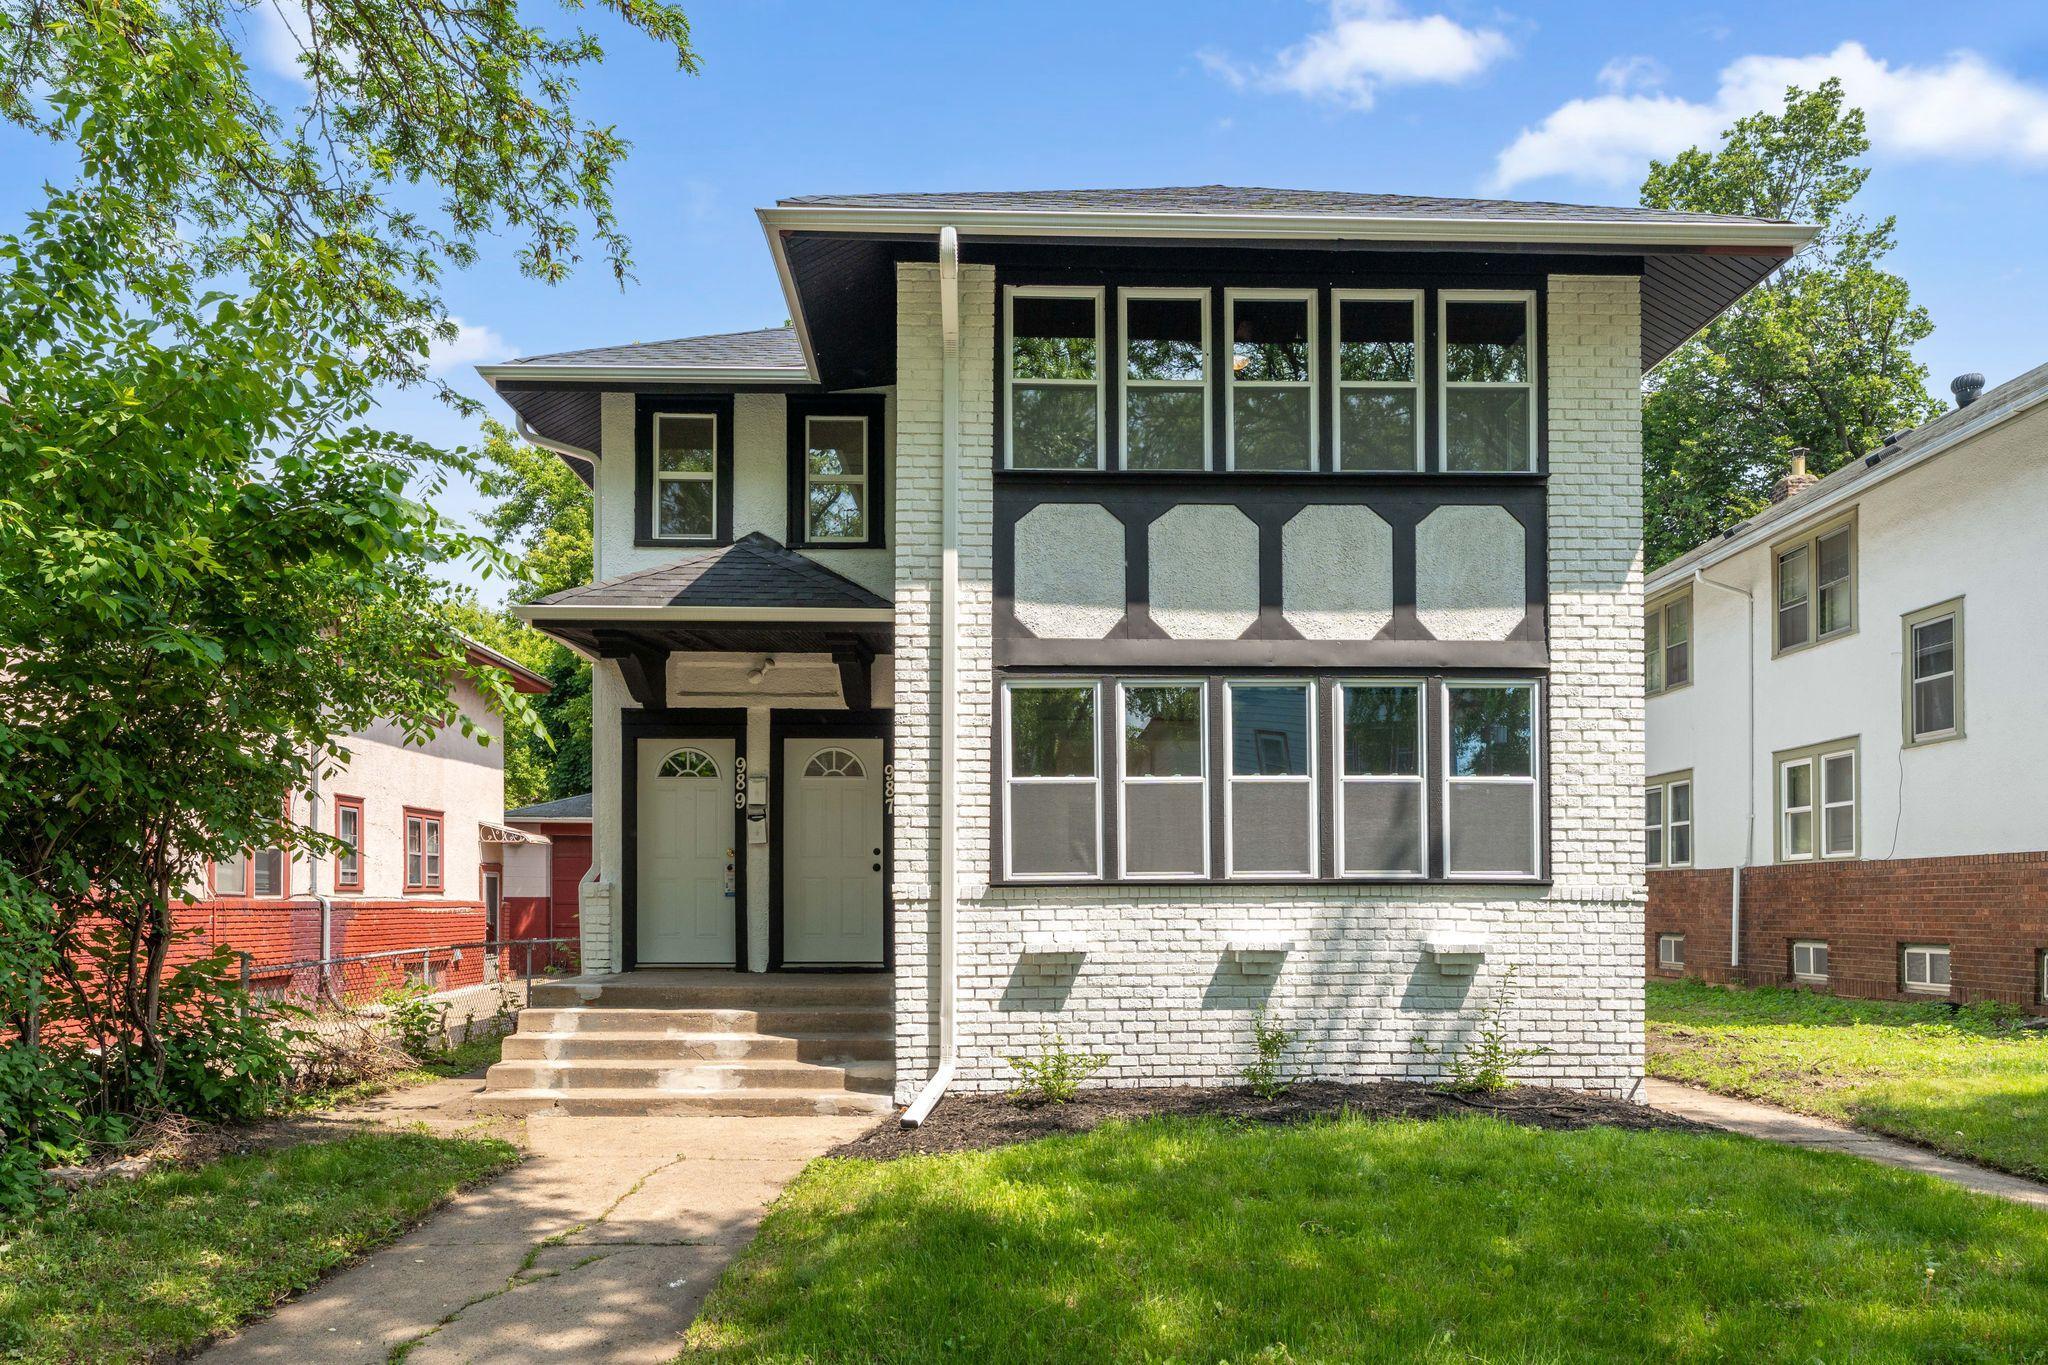
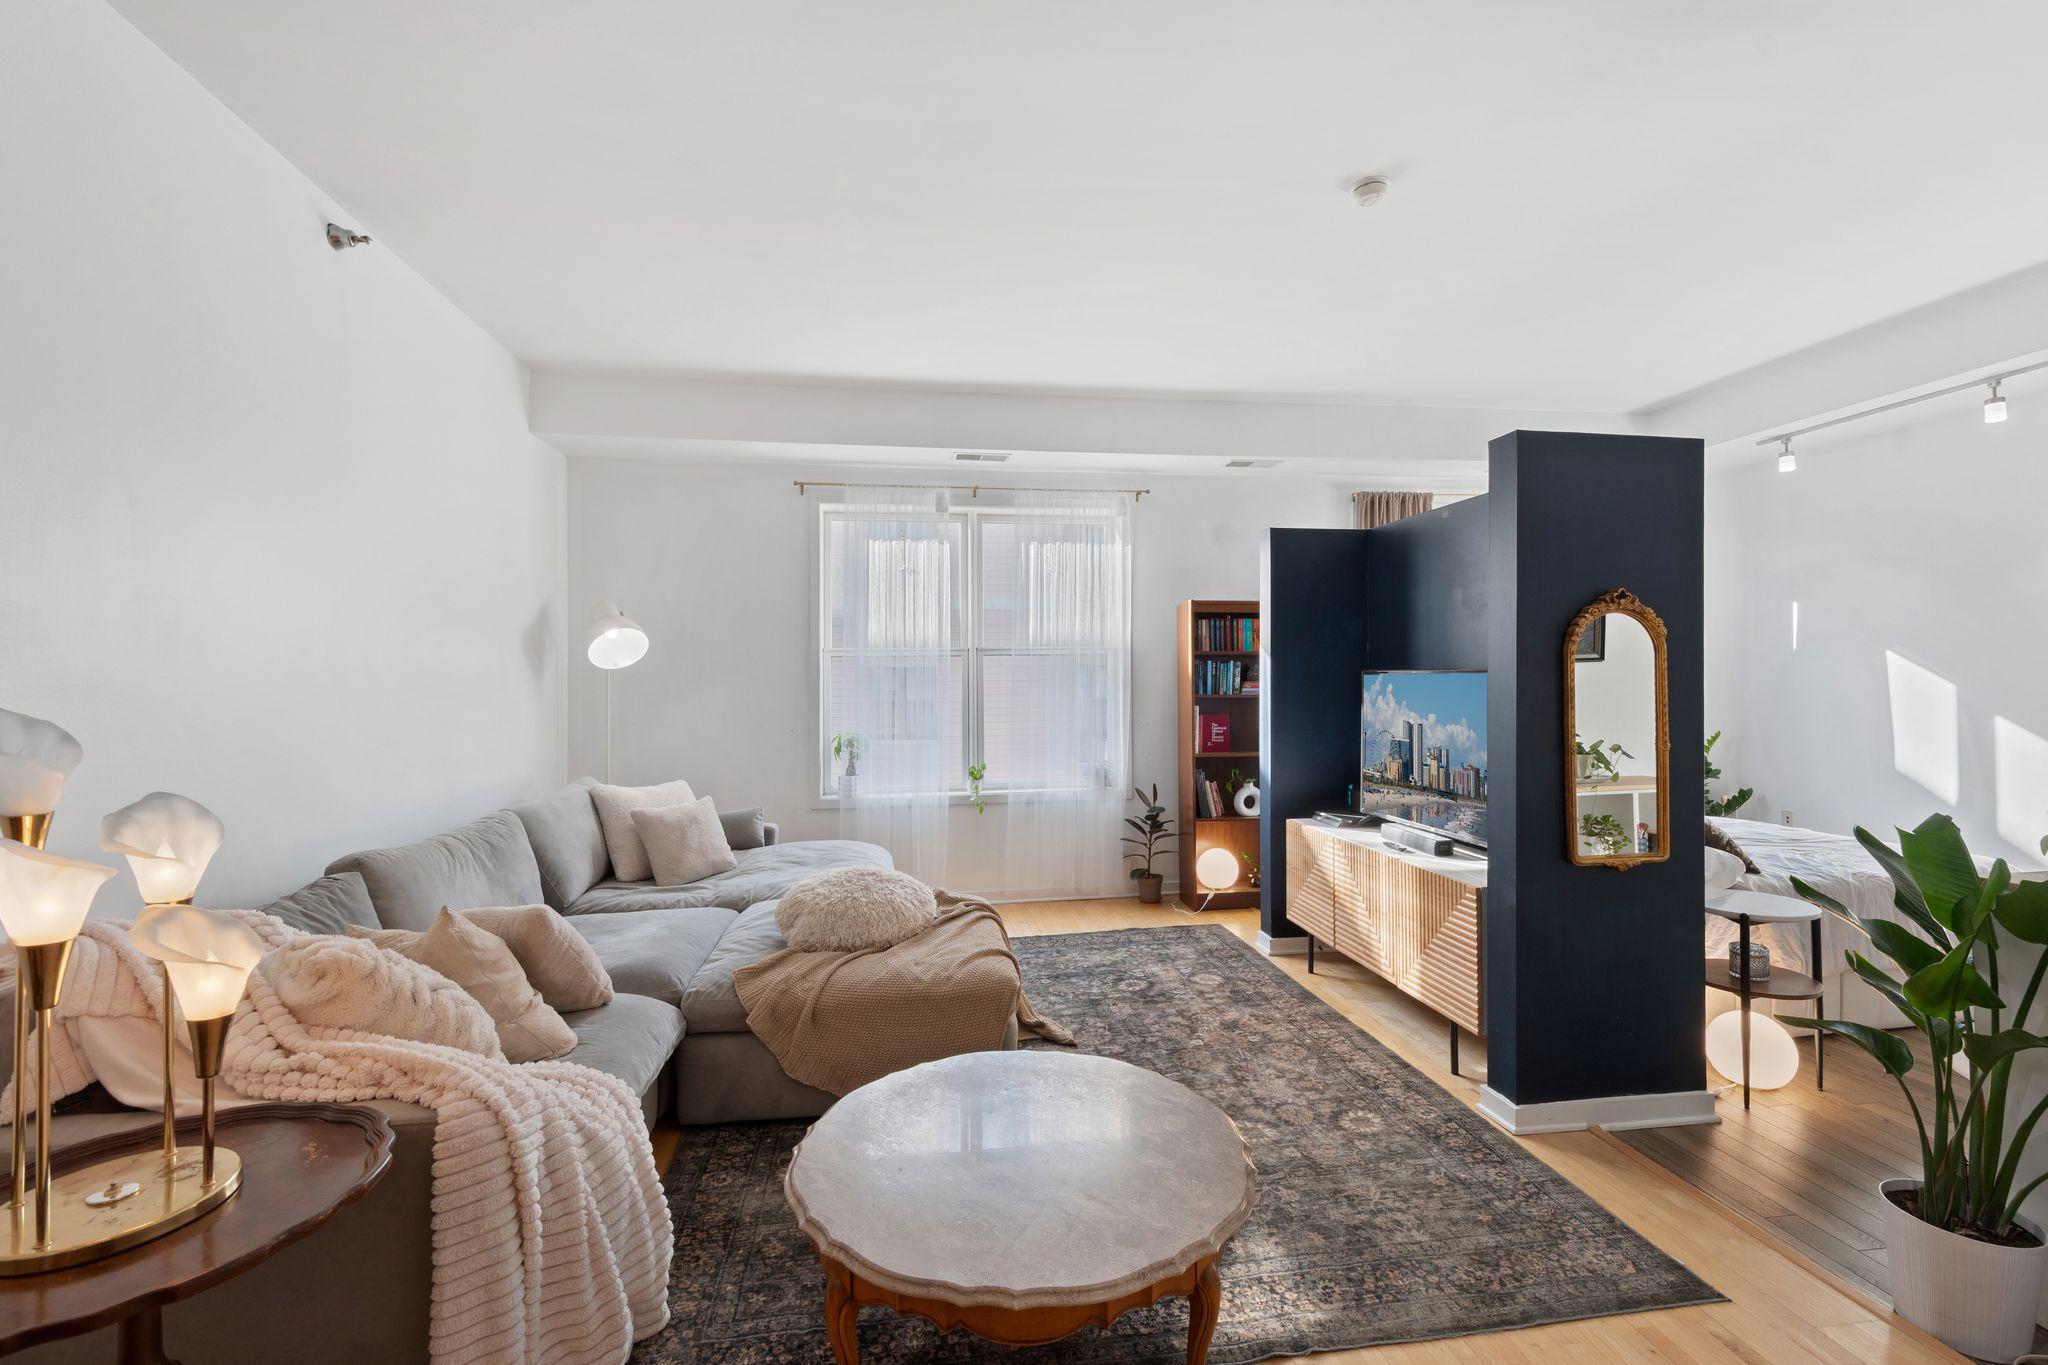
Active
$545,000
6
bds
|
2
ba
|
3,296
sqft
|
built
1921
987 Dayton Ave, Saint Paul, MN 55104
$-1,845
Cash flow
-17.7%
Cash-on-Cash Return
2.2%
Cap rate
0.4%
Rent to Value Ratio
Pending
$350,000
4
bds
|
3
ba
|
2,087
sqft
|
built
1986
1716 Cottage Ave E, Saint Paul, MN 55106
$-706
Cash flow
-10.5%
Cash-on-Cash Return
3.9%
Cap rate
0.6%
Rent to Value Ratio
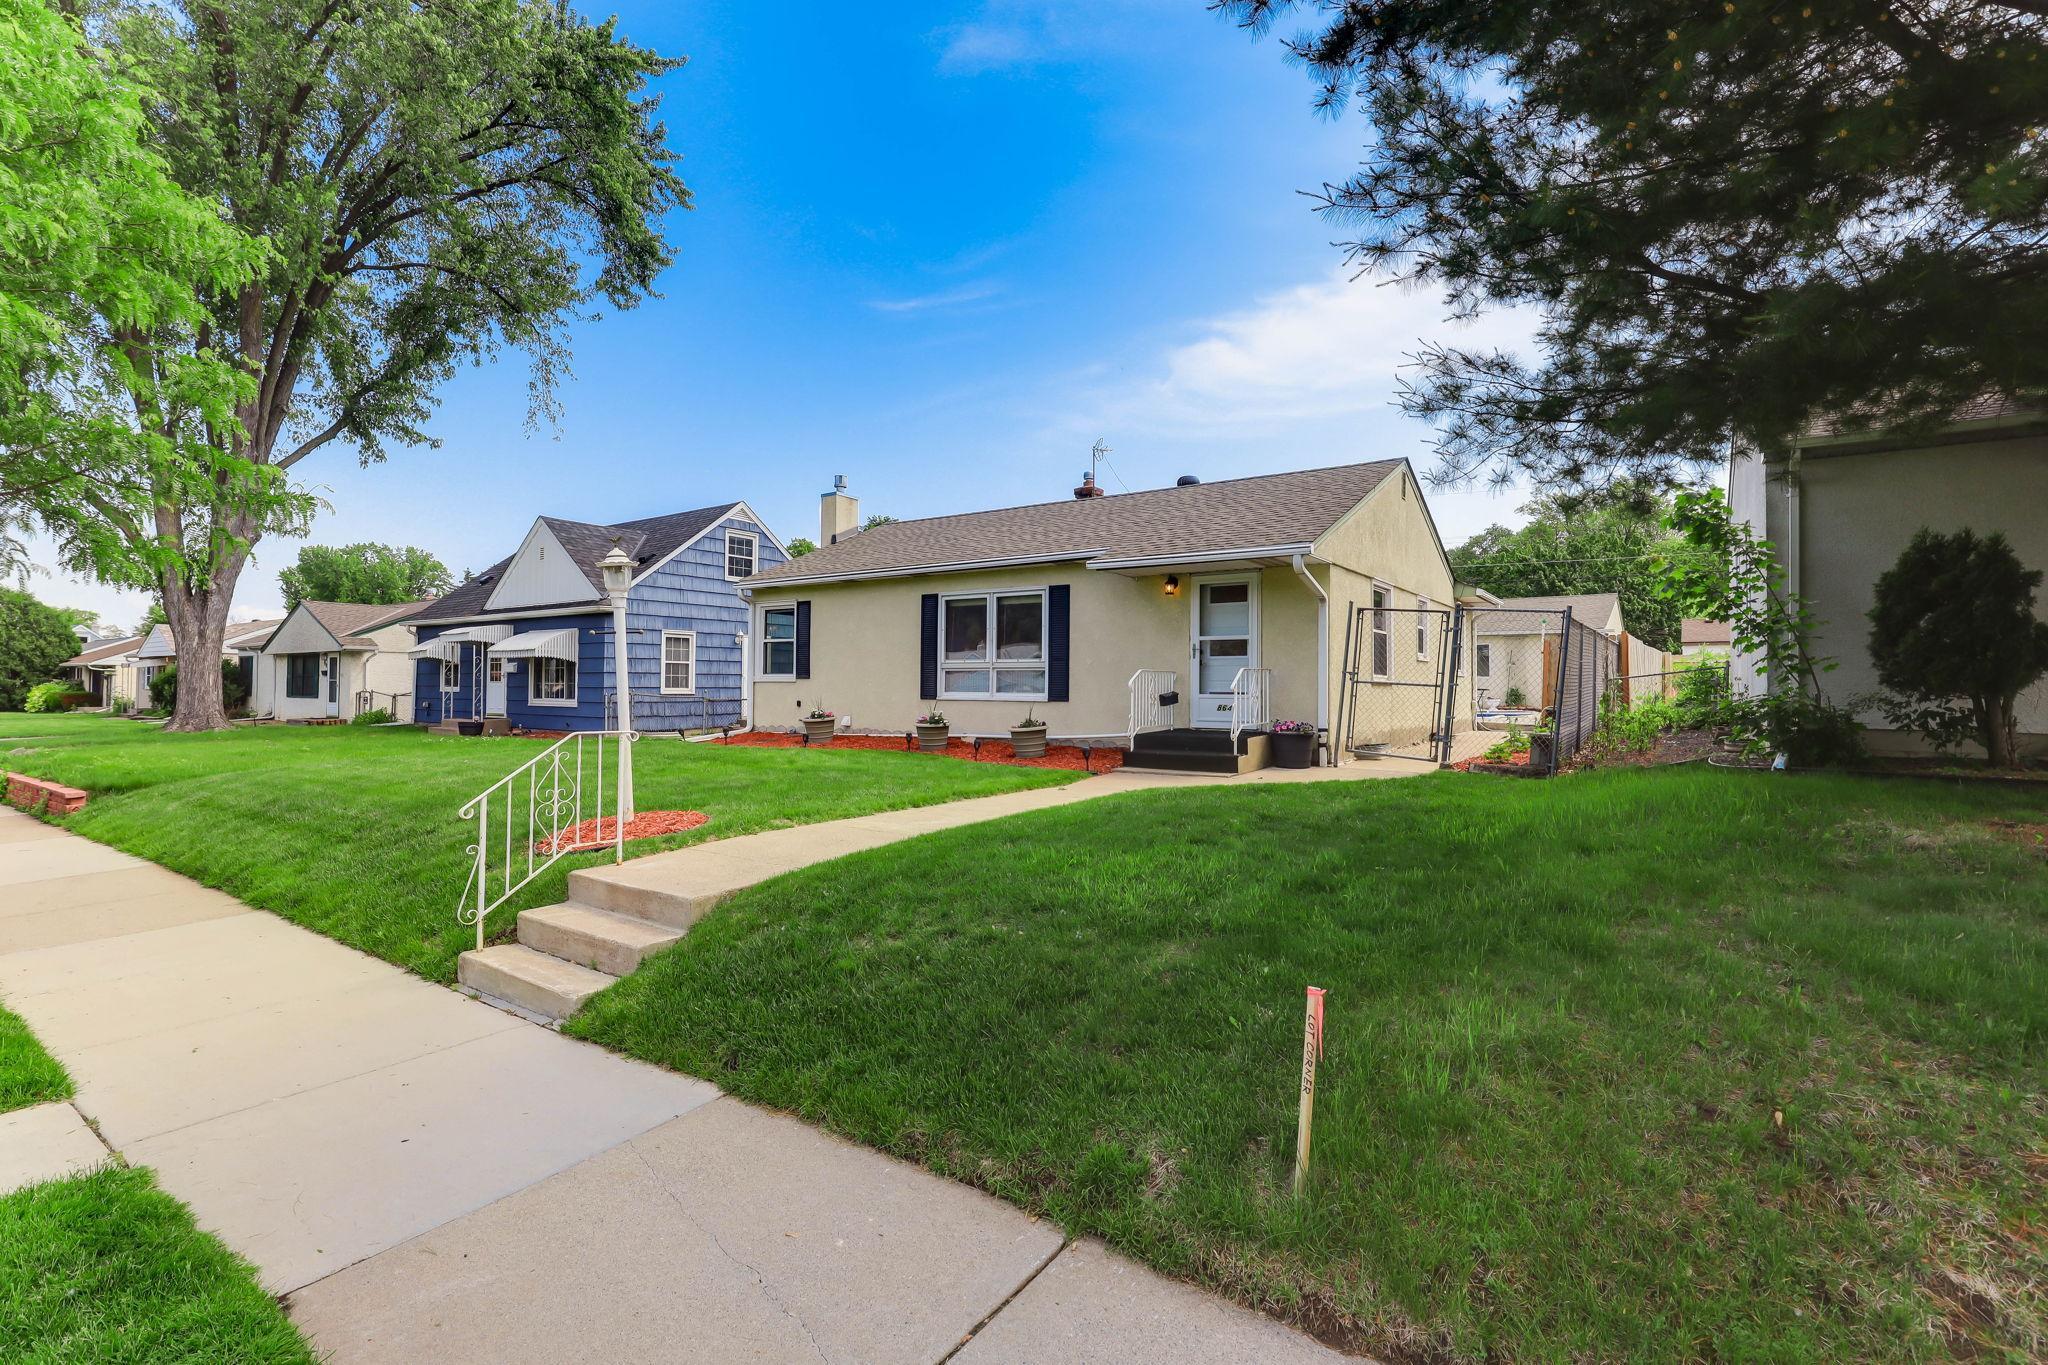
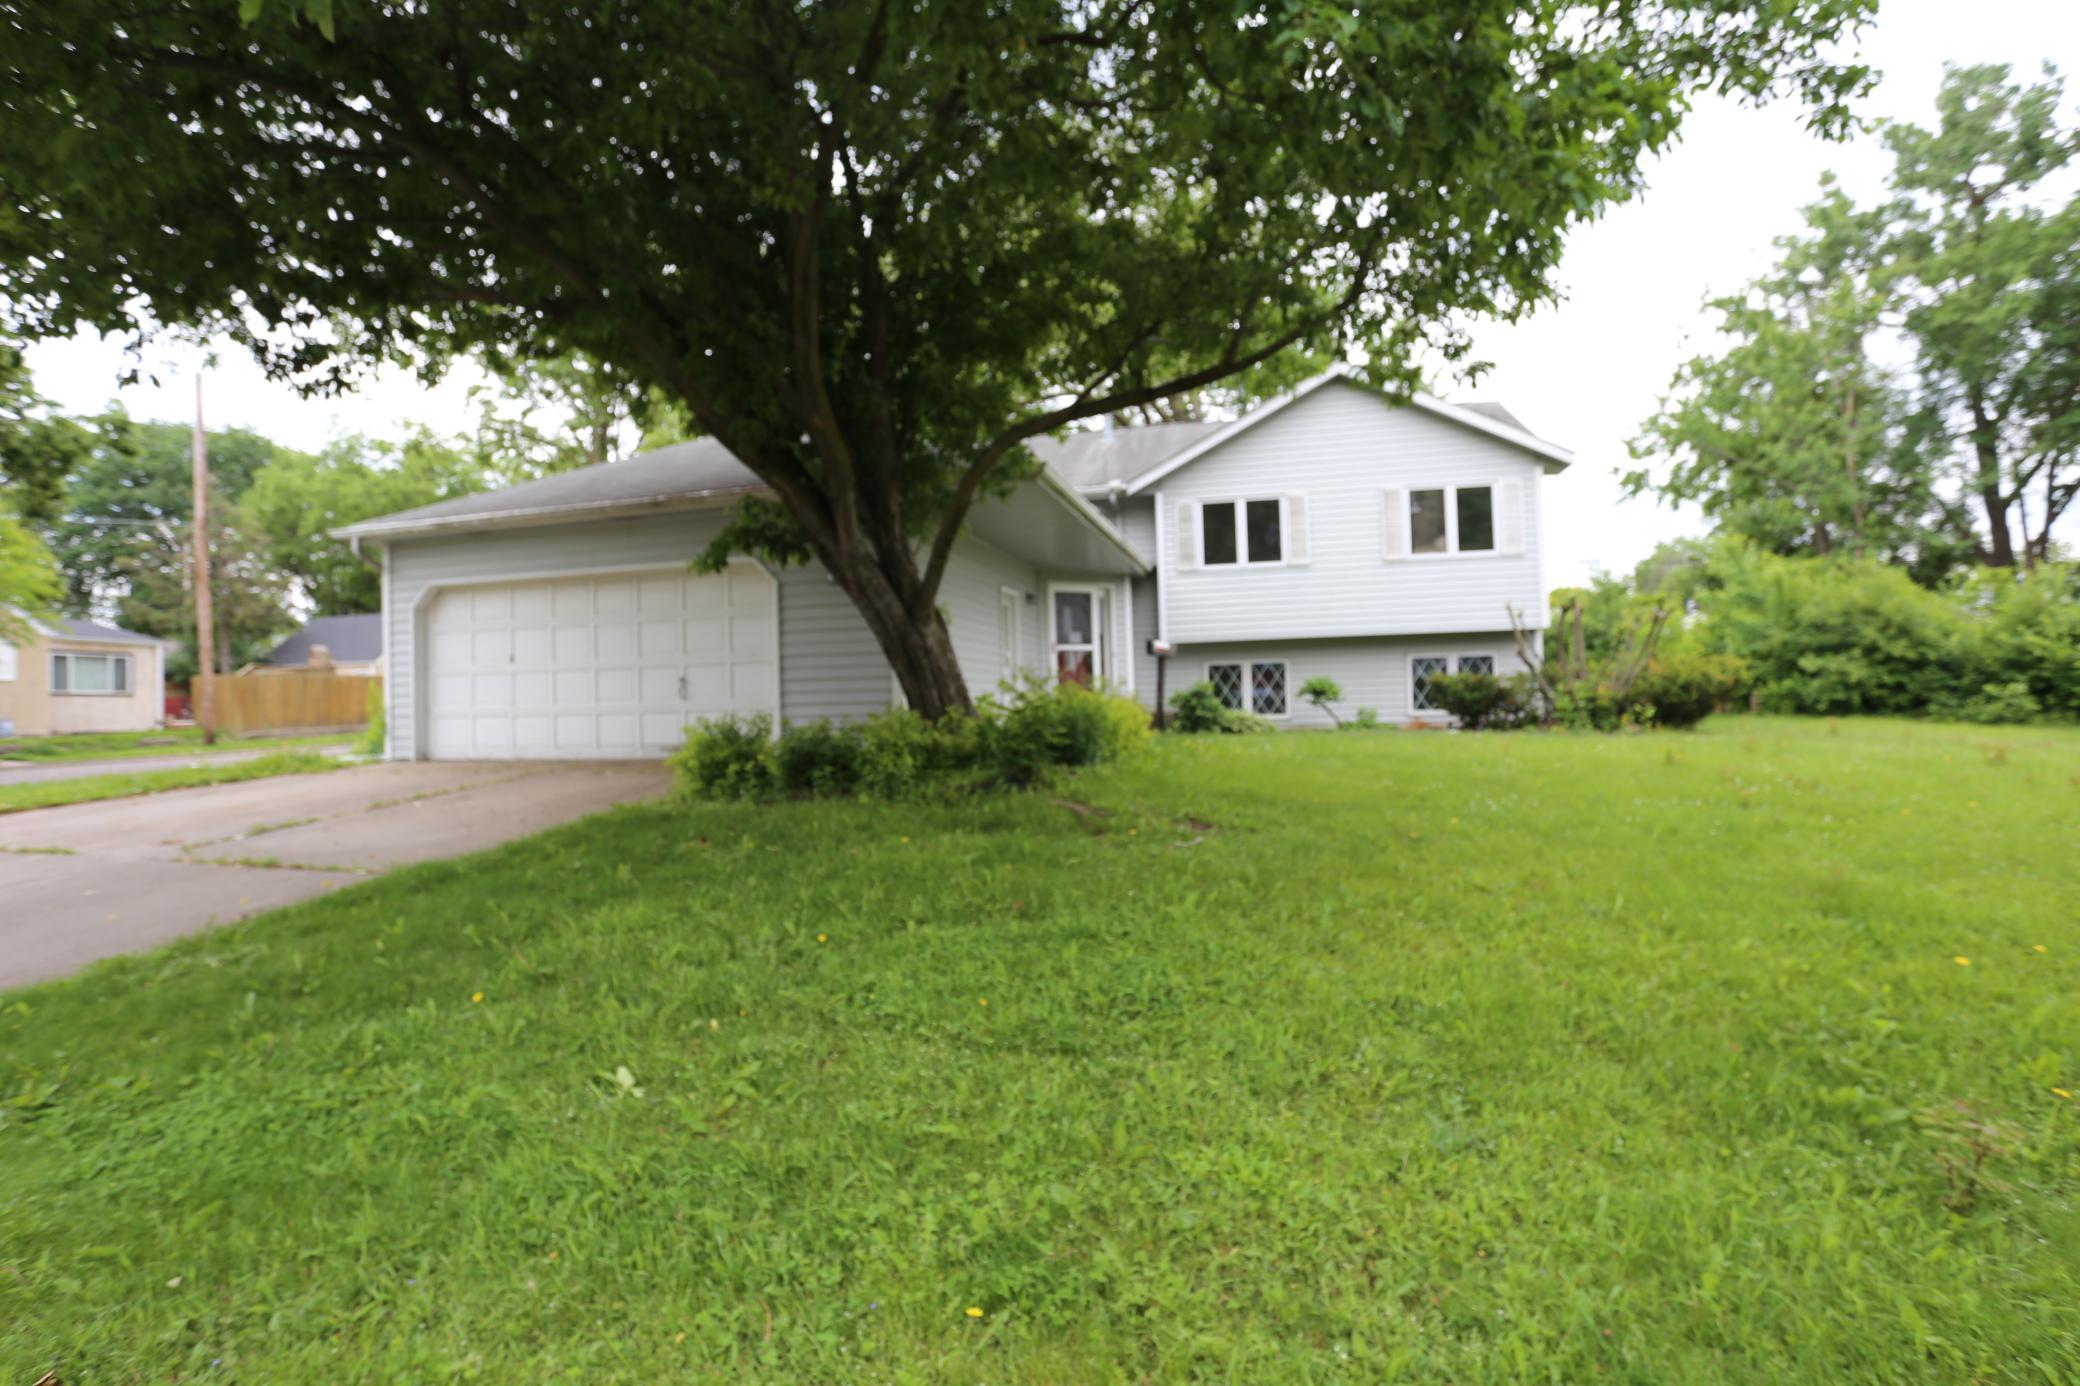
Pending
$309,000
2
bds
|
2
ba
|
2,203
sqft
|
built
1953
864 Howard St N, Saint Paul, MN 55119
$-386
Cash flow
-6.5%
Cash-on-Cash Return
4.8%
Cap rate
0.7%
Rent to Value Ratio
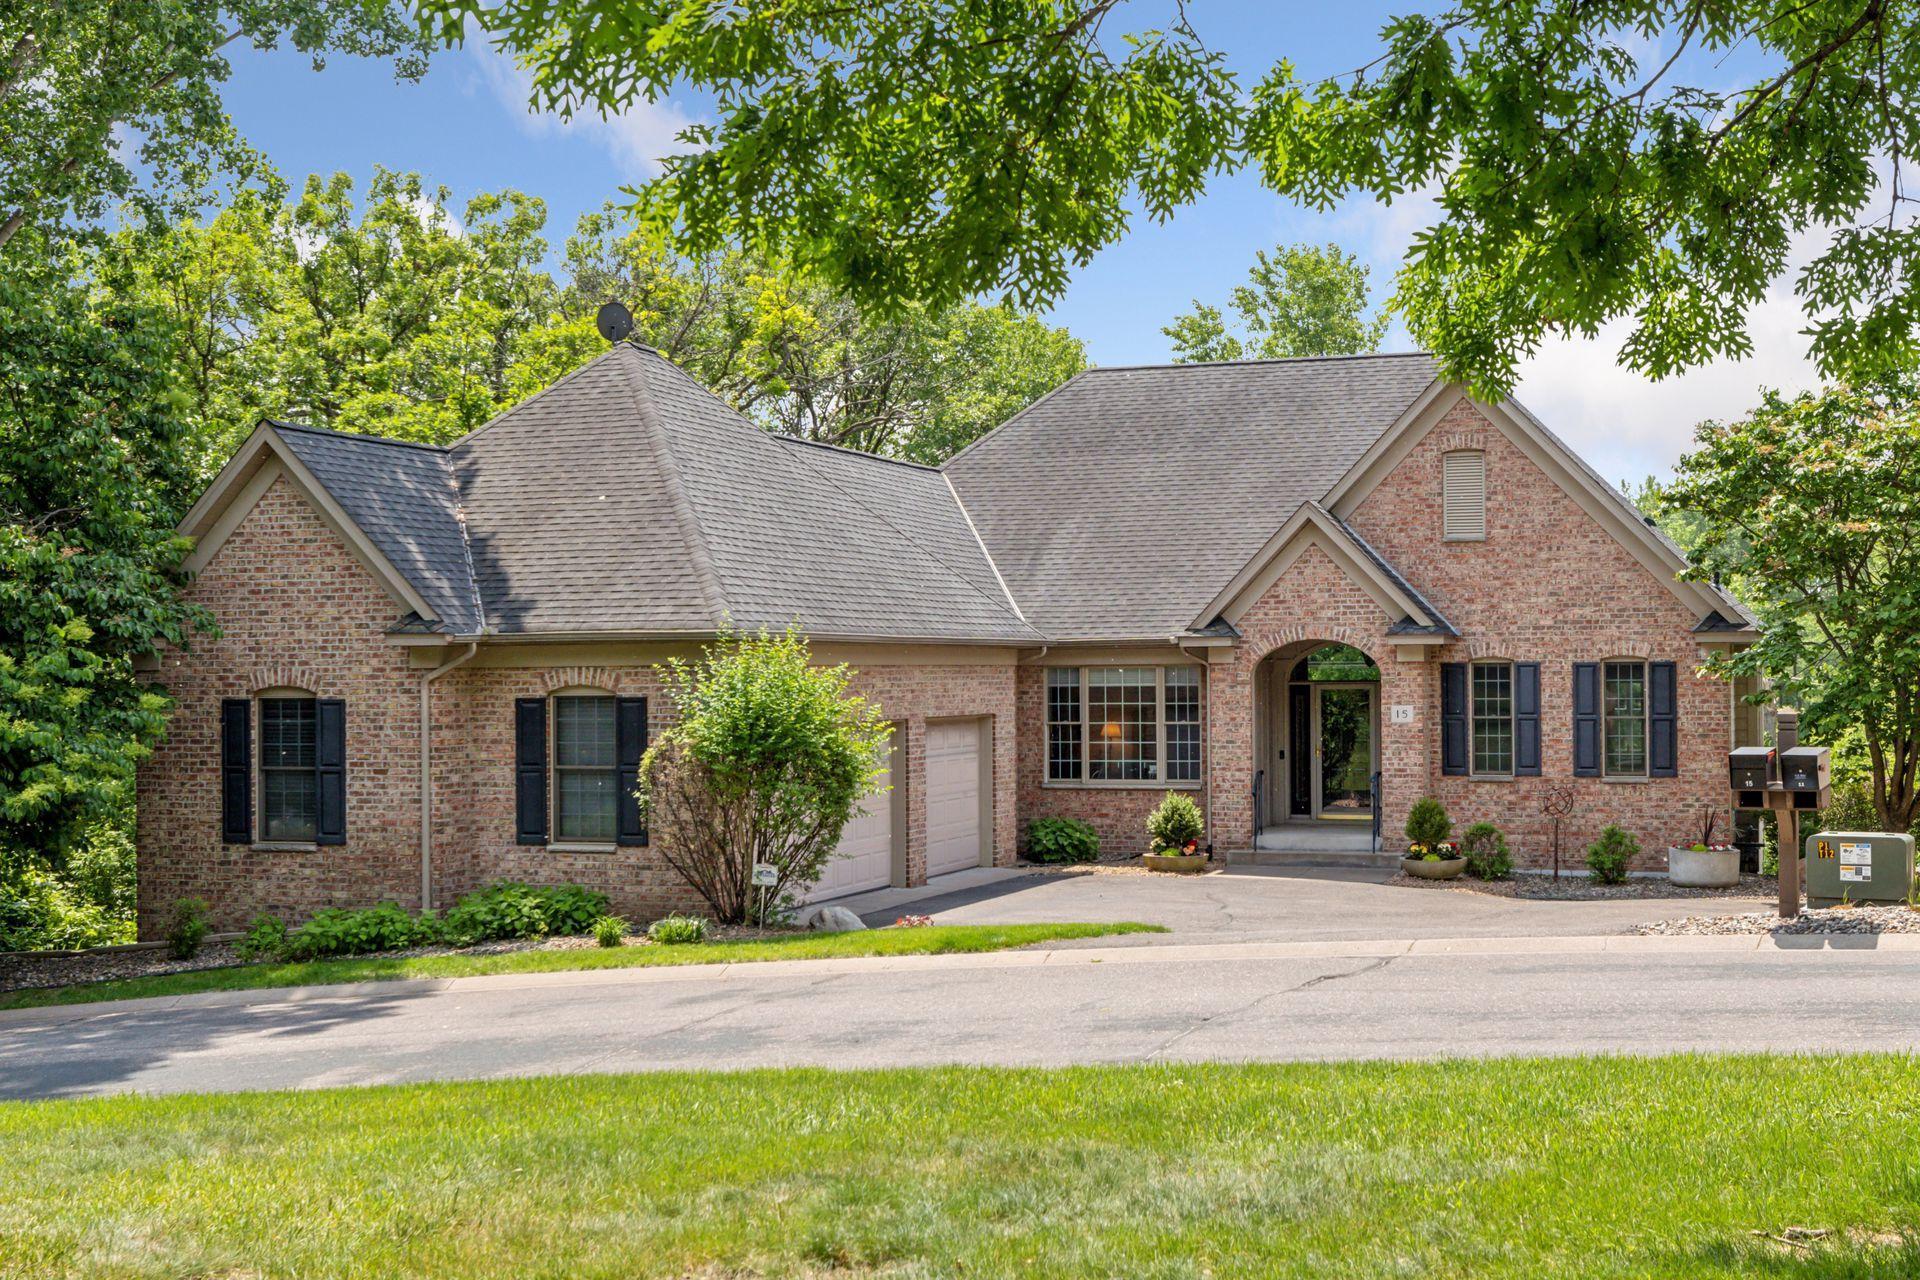
Pending
$875,000
3
bds
|
3
ba
|
3,323
sqft
|
built
2000
15 Knoll Rd, Saint Paul, MN 55127
$-3,229
Cash flow
-19.3%
Cash-on-Cash Return
1.9%
Cap rate
0.4%
Rent to Value Ratio
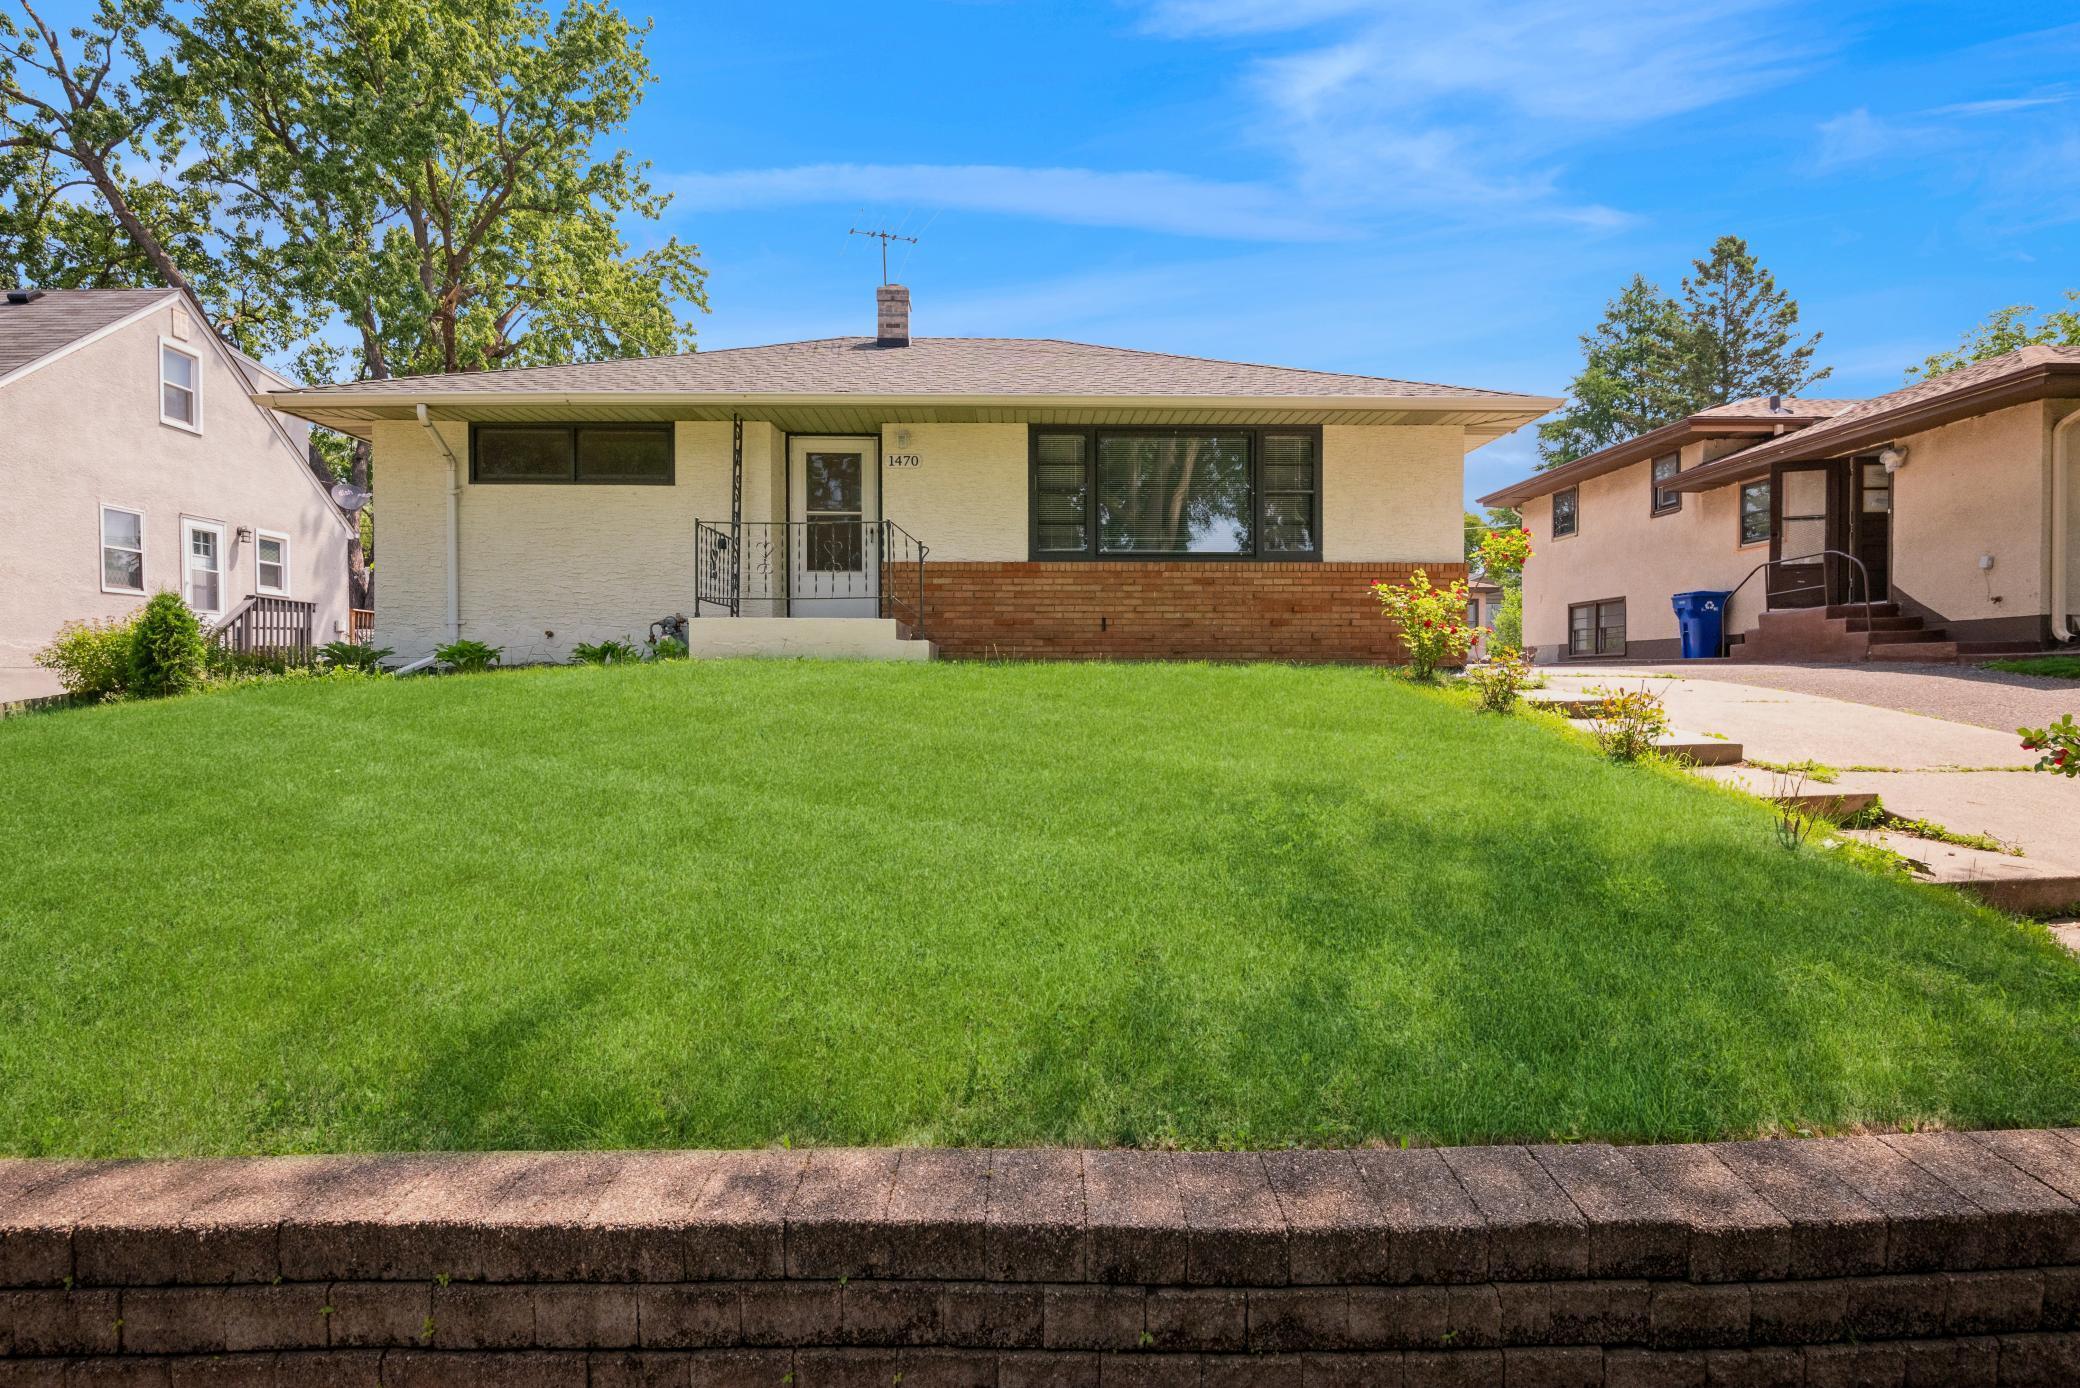
Pending
$314,900
3
bds
|
1
ba
|
1,500
sqft
|
built
1954
1470 Kent St, Saint Paul, MN 55117
$-474
Cash flow
-7.9%
Cash-on-Cash Return
4.5%
Cap rate
0.7%
Rent to Value Ratio
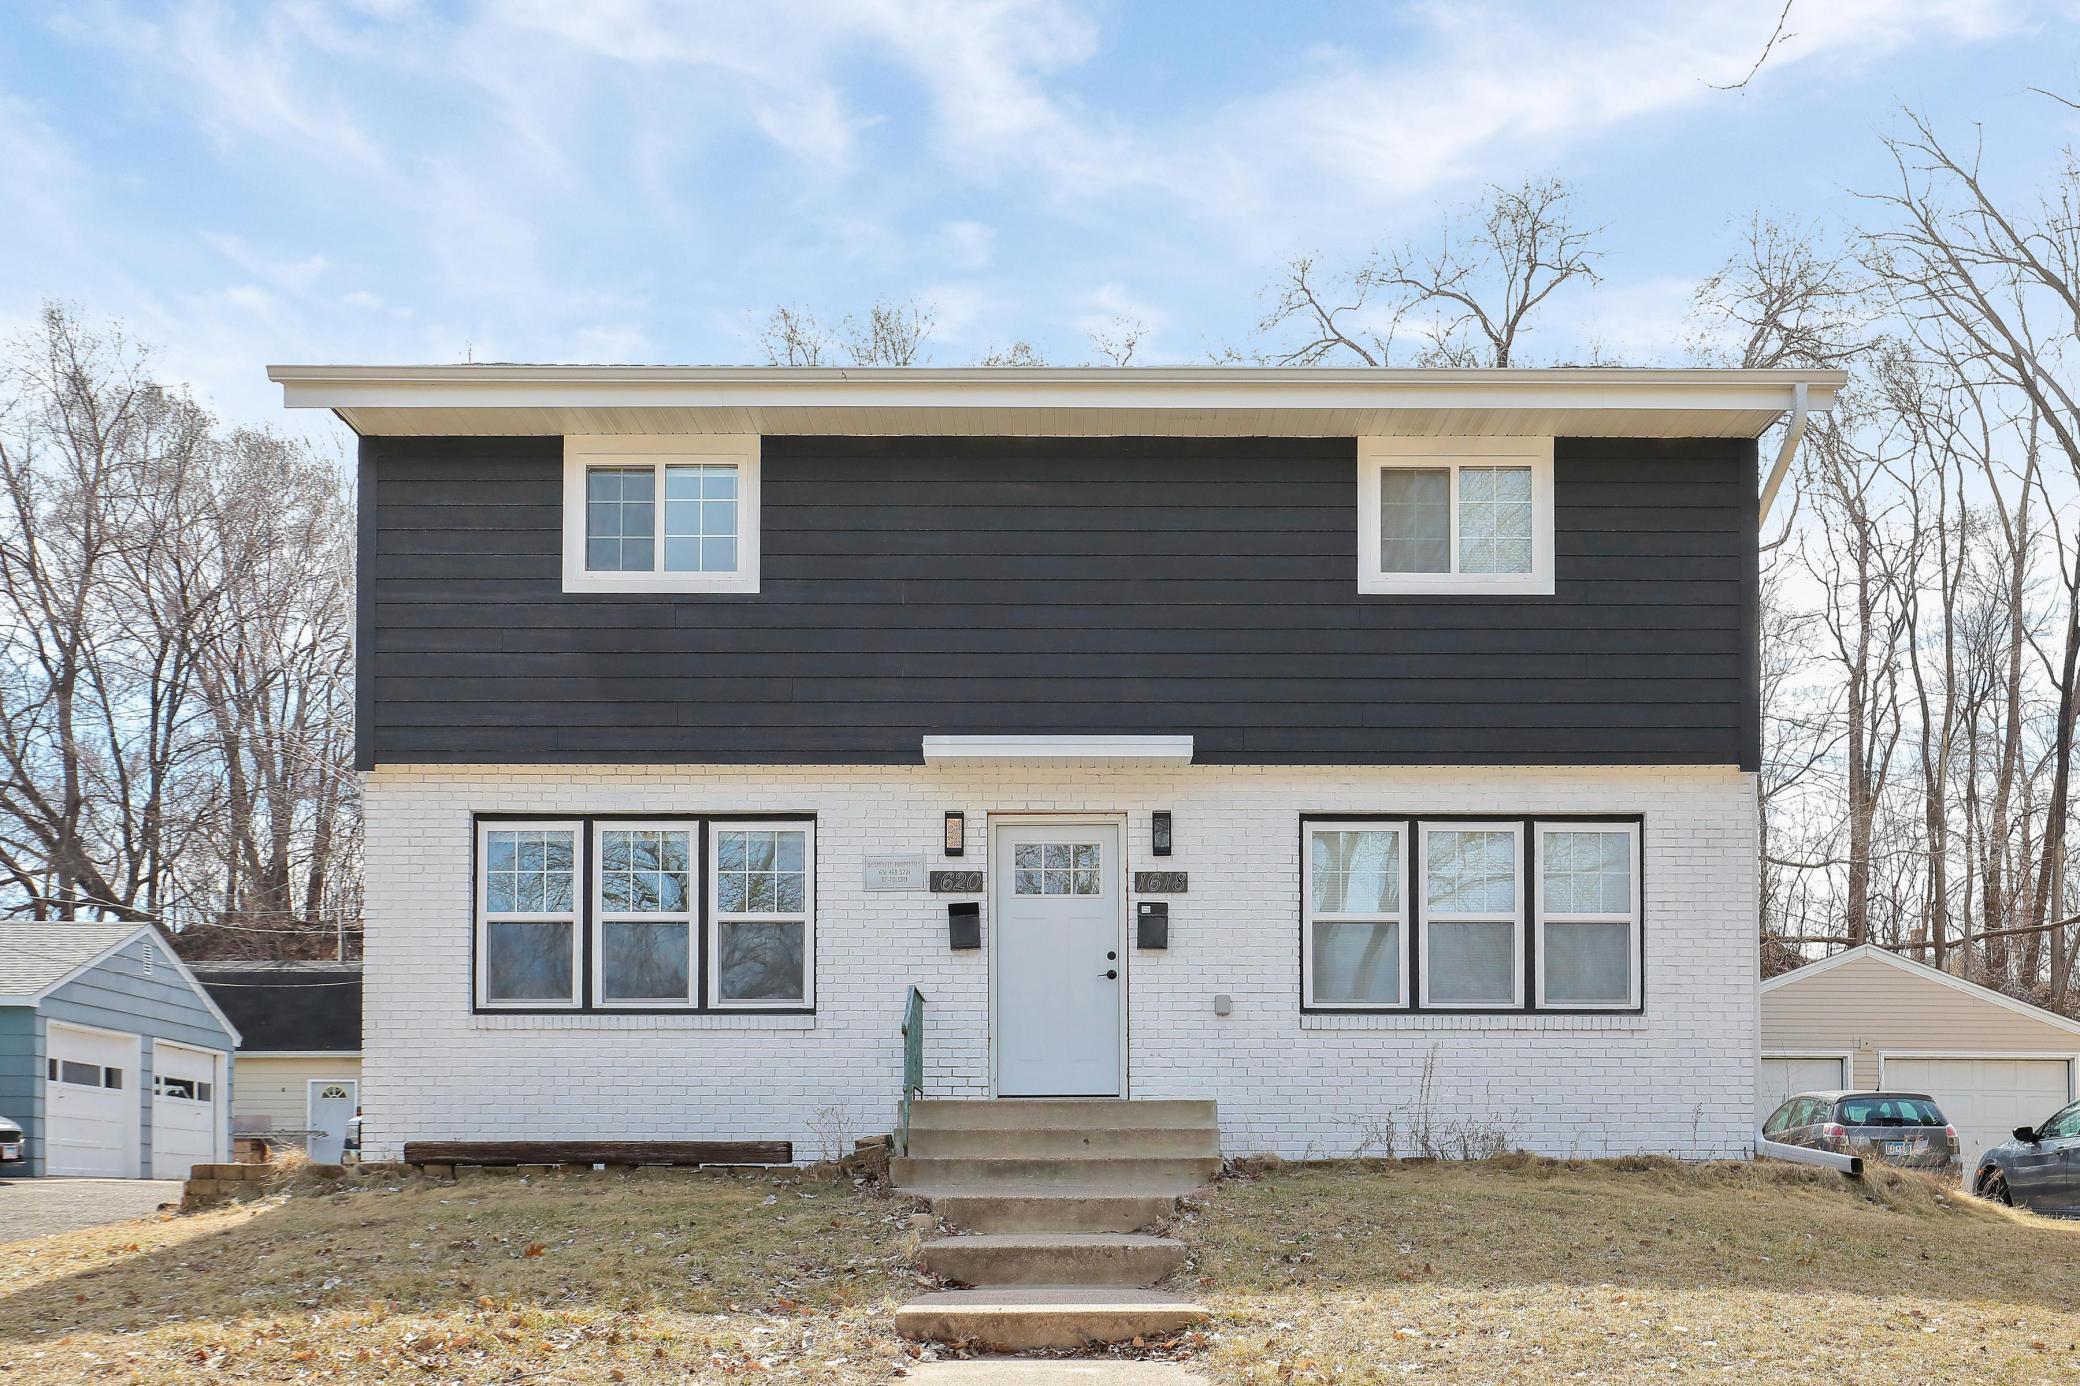
Active
$525,000
6
bds
|
2
ba
|
2,200
sqft
|
built
1968
1618 Stillwater Ave, Saint Paul, MN 55106
$-1,890
Cash flow
-18.8%
Cash-on-Cash Return
2.0%
Cap rate
0.4%
Rent to Value Ratio
Active
$429,900
4
bds
|
3
ba
|
2,020
sqft
|
built
1983
953 Oak View Ct, Saint Paul, MN 55119
$-880
Cash flow
-10.7%
Cash-on-Cash Return
3.8%
Cap rate
0.6%
Rent to Value Ratio
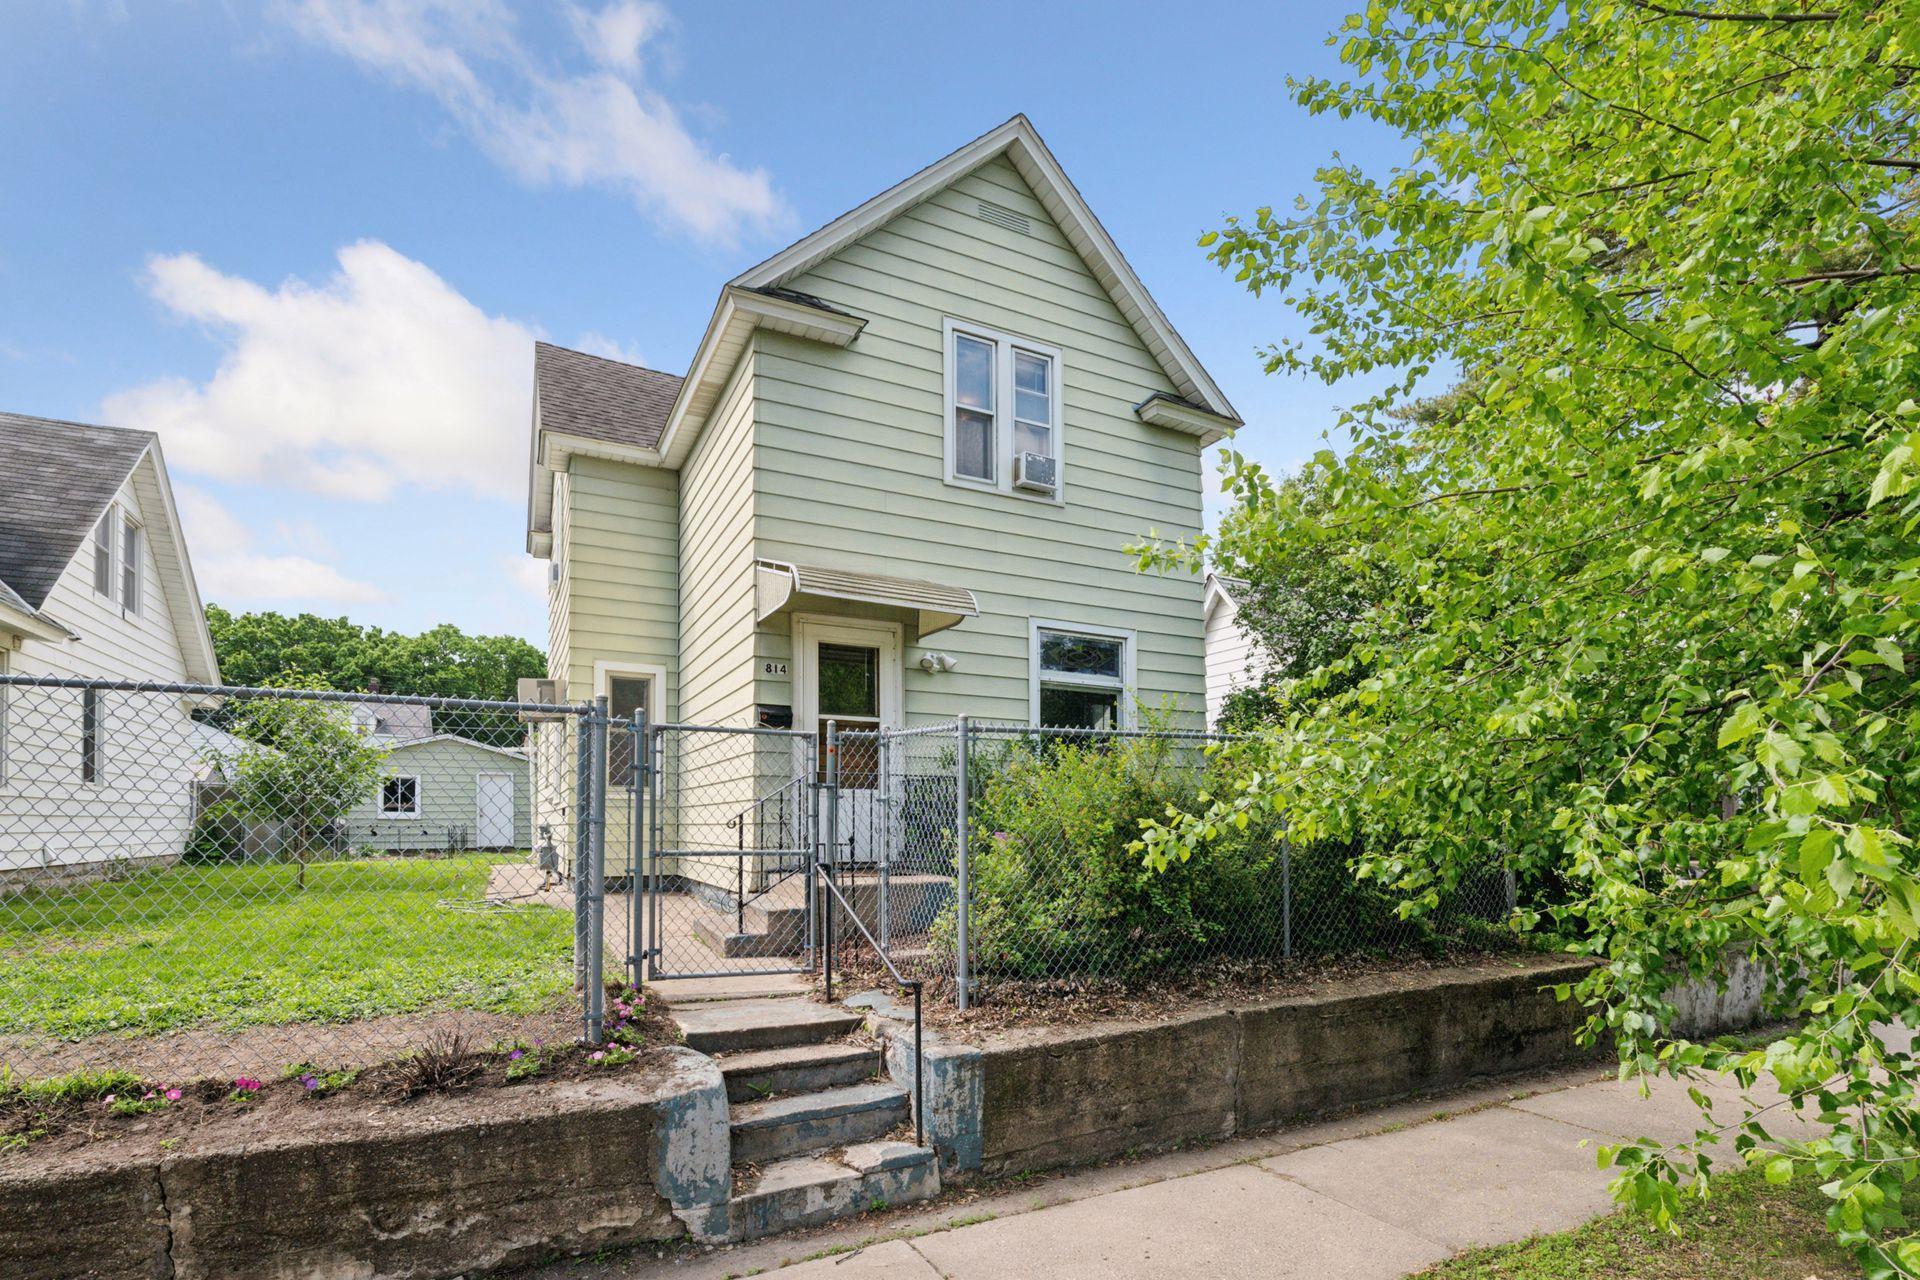
Active
$210,000
4
bds
|
2
ba
|
1,170
sqft
|
built
1913
814 Englewood Ave, Saint Paul, MN 55104
$-115
Cash flow
-2.9%
Cash-on-Cash Return
5.6%
Cap rate
0.9%
Rent to Value Ratio
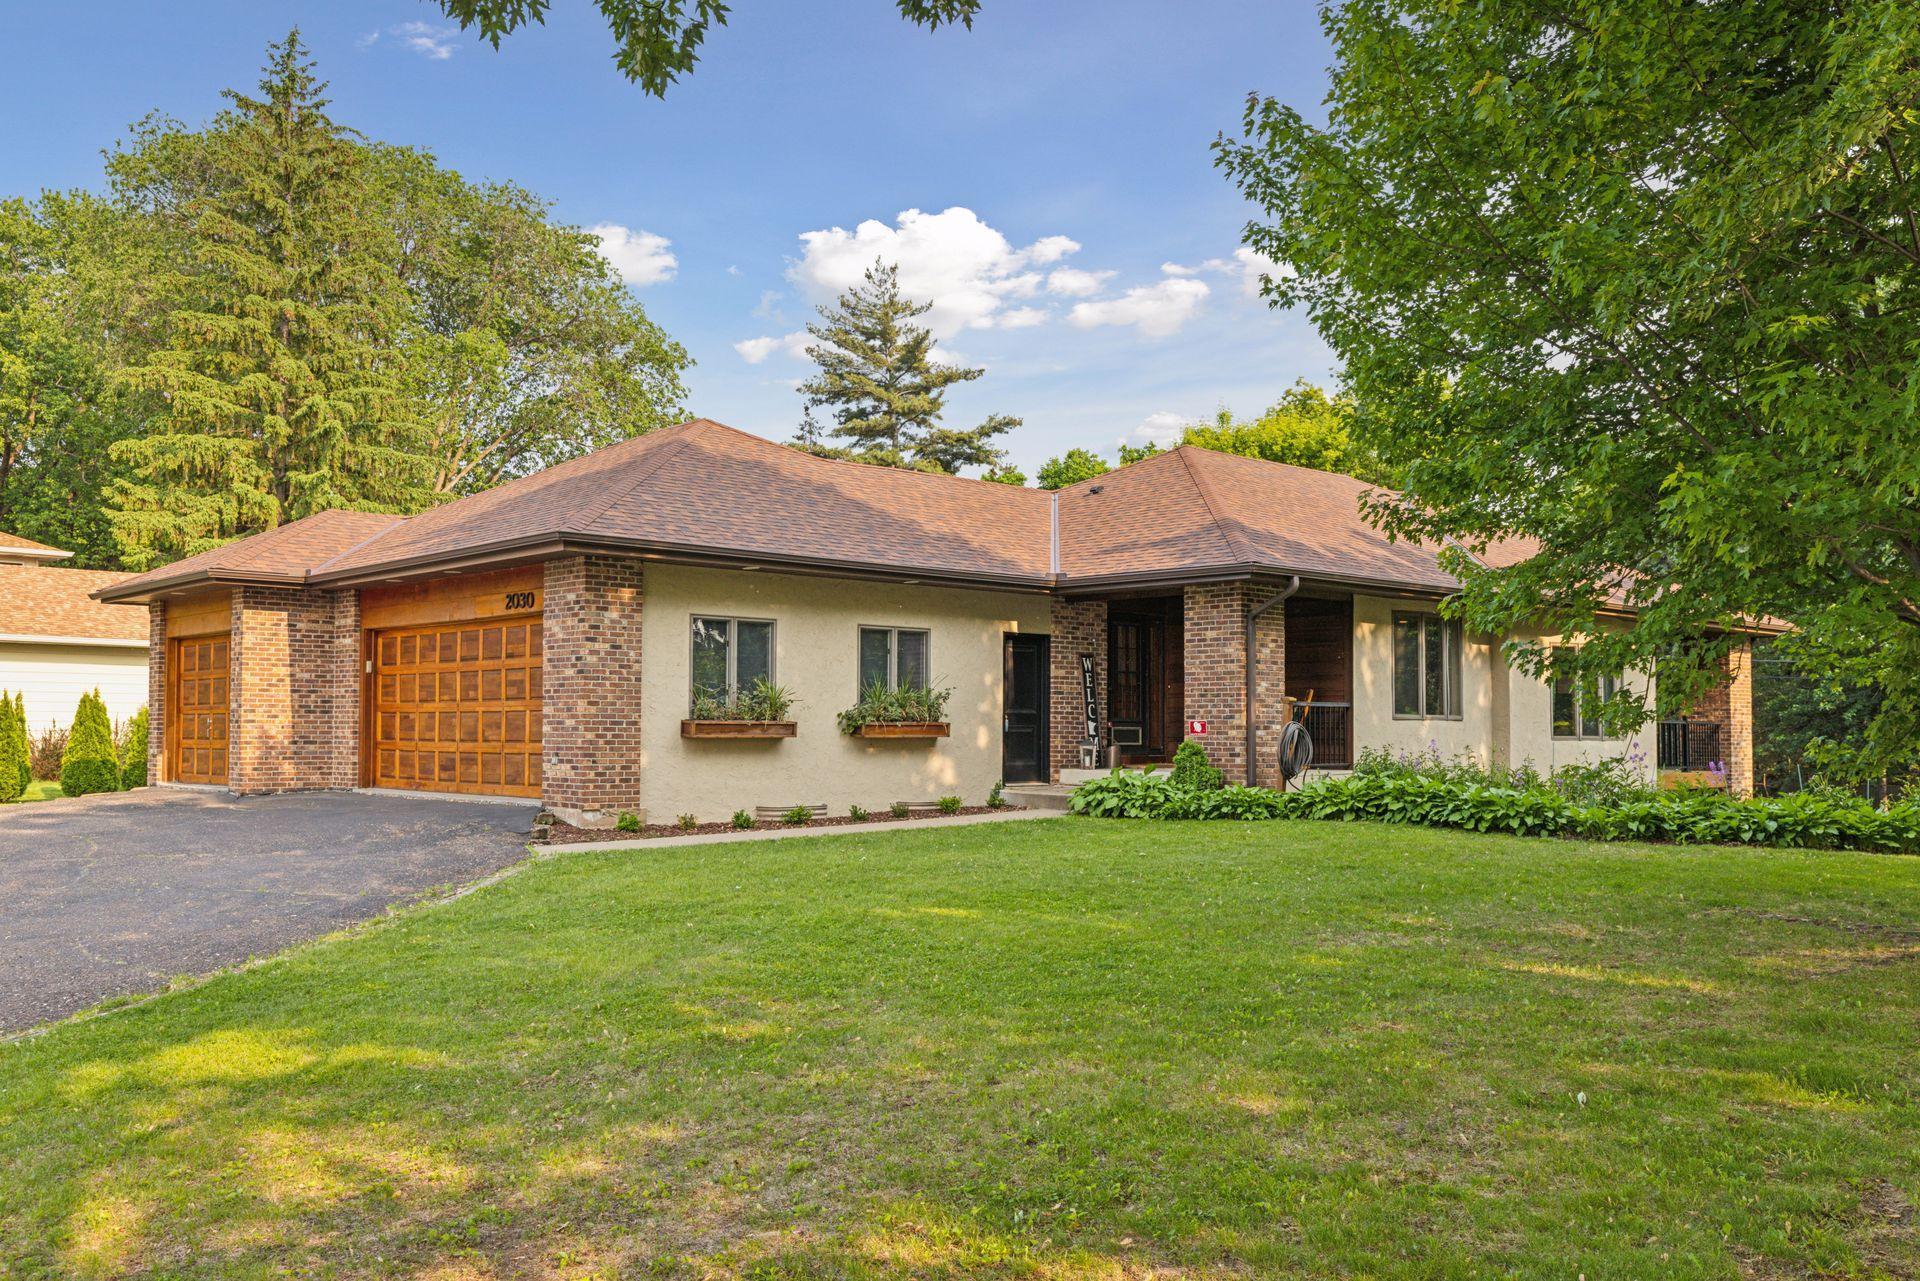
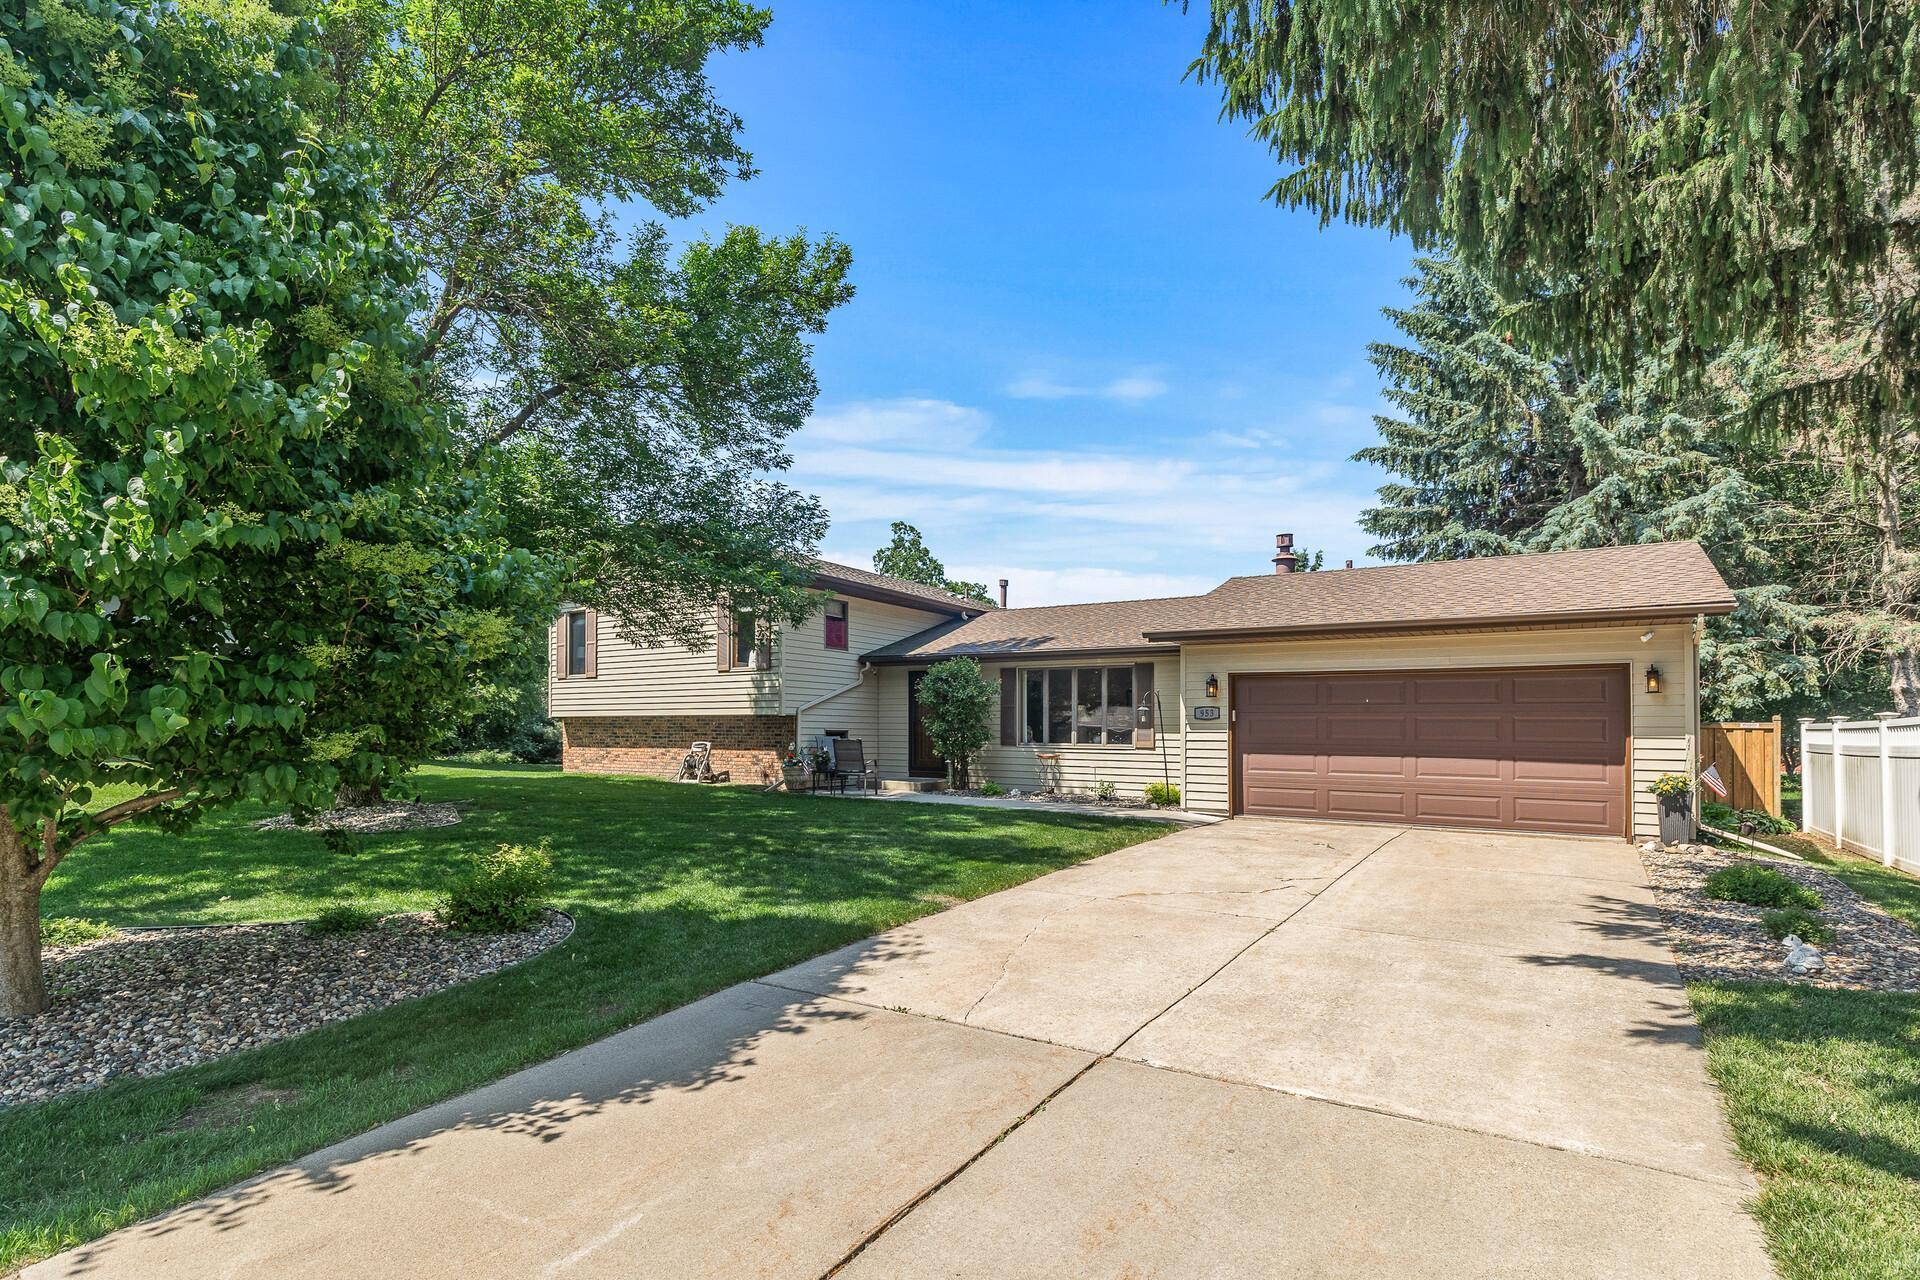
Pending
$625,000
3
bds
|
3
ba
|
2,575
sqft
|
built
1986
2030 County Road B W, Saint Paul, MN 55113
$-1,350
Cash flow
-11.3%
Cash-on-Cash Return
3.7%
Cap rate
0.6%
Rent to Value Ratio
Pending
$585,000
5
bds
|
3
ba
|
2,372
sqft
|
built
1942
869 Kenneth St, Saint Paul, MN 55116
$-1,365
Cash flow
-12.2%
Cash-on-Cash Return
3.5%
Cap rate
0.6%
Rent to Value Ratio
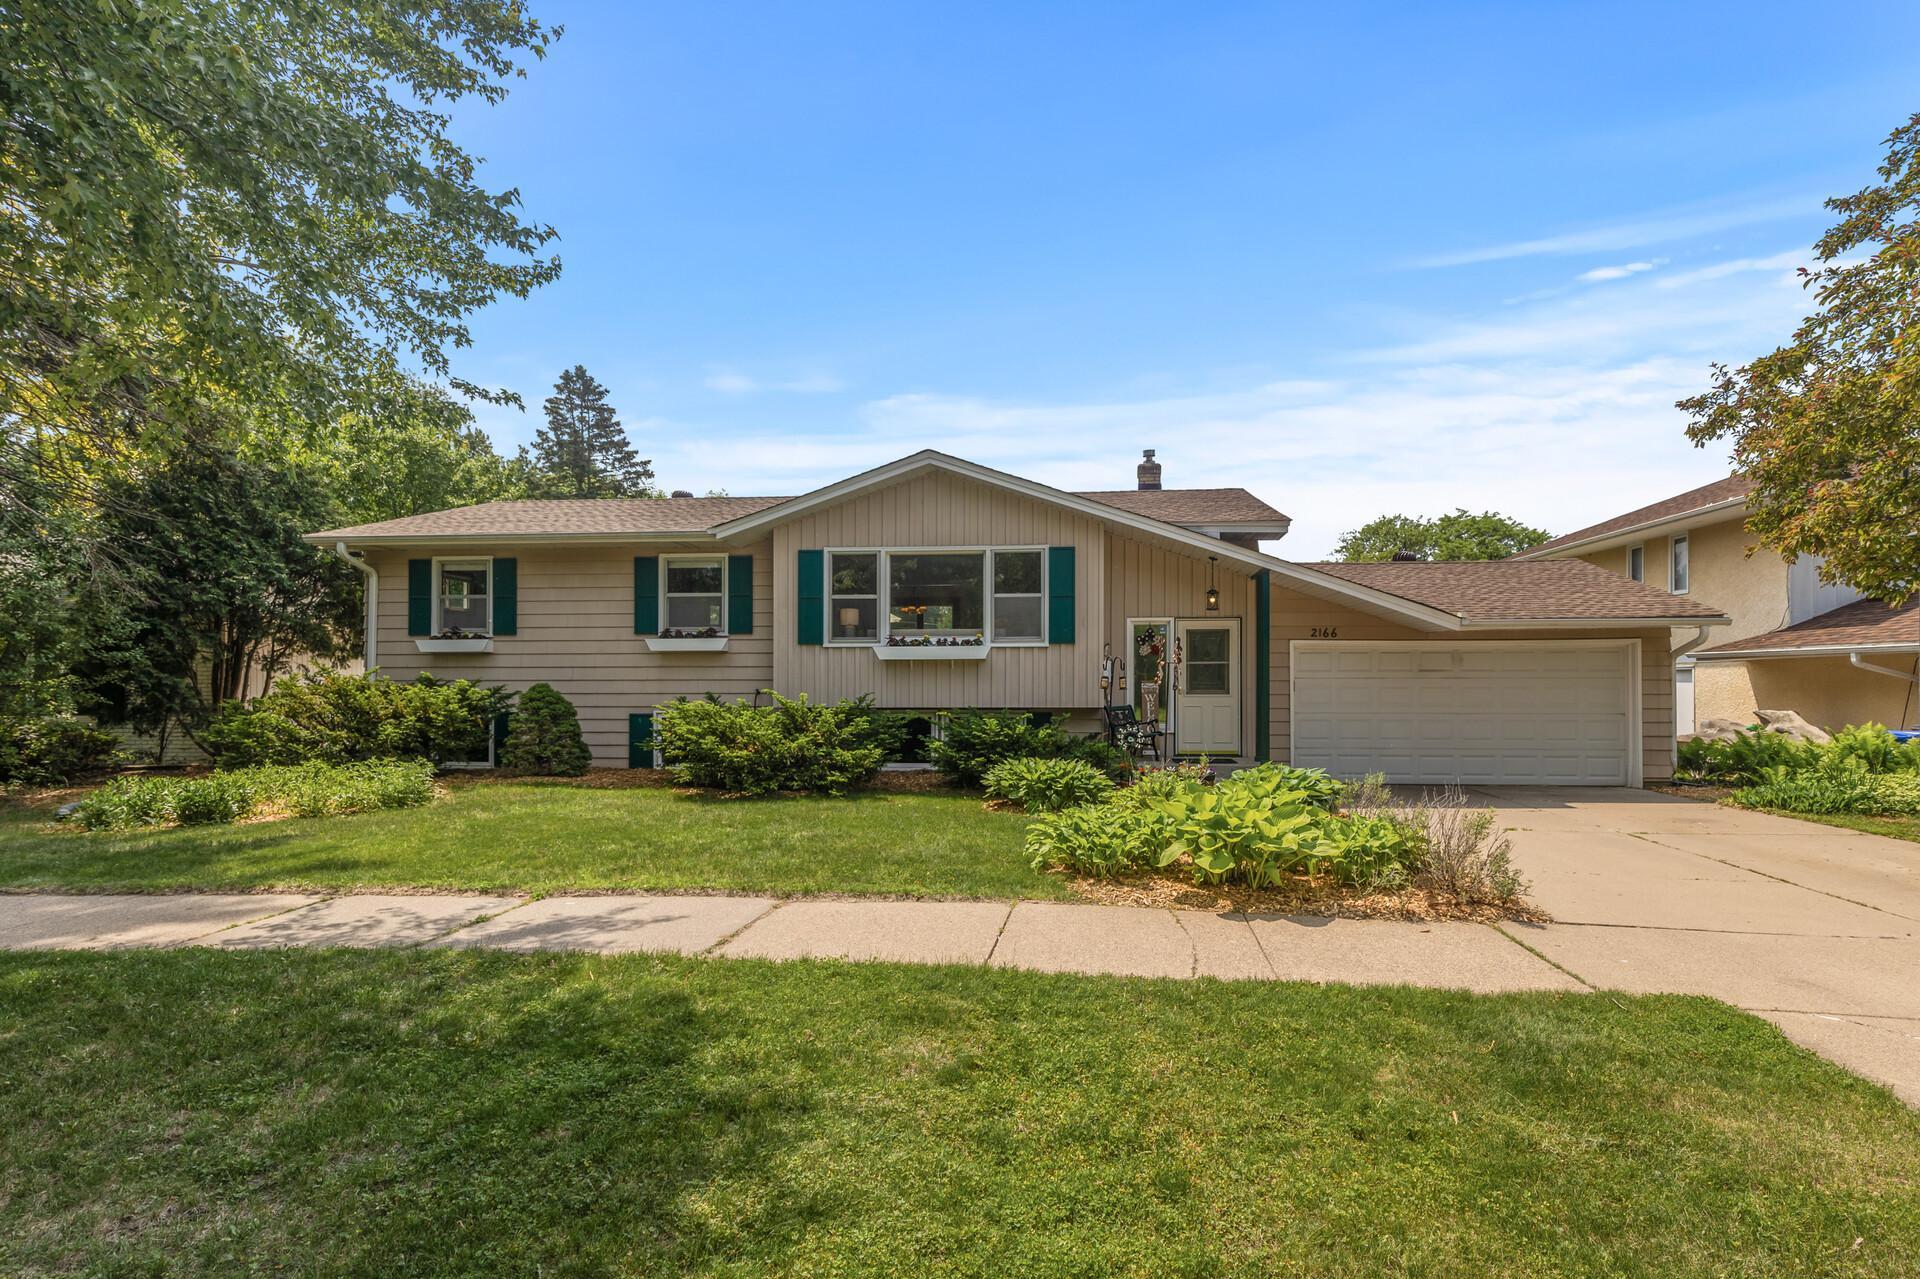
Active
$345,000
4
bds
|
2
ba
|
1,813
sqft
|
built
1968
2166 Larry Ho Dr, Saint Paul, MN 55119
$-554
Cash flow
-8.4%
Cash-on-Cash Return
4.4%
Cap rate
0.7%
Rent to Value Ratio
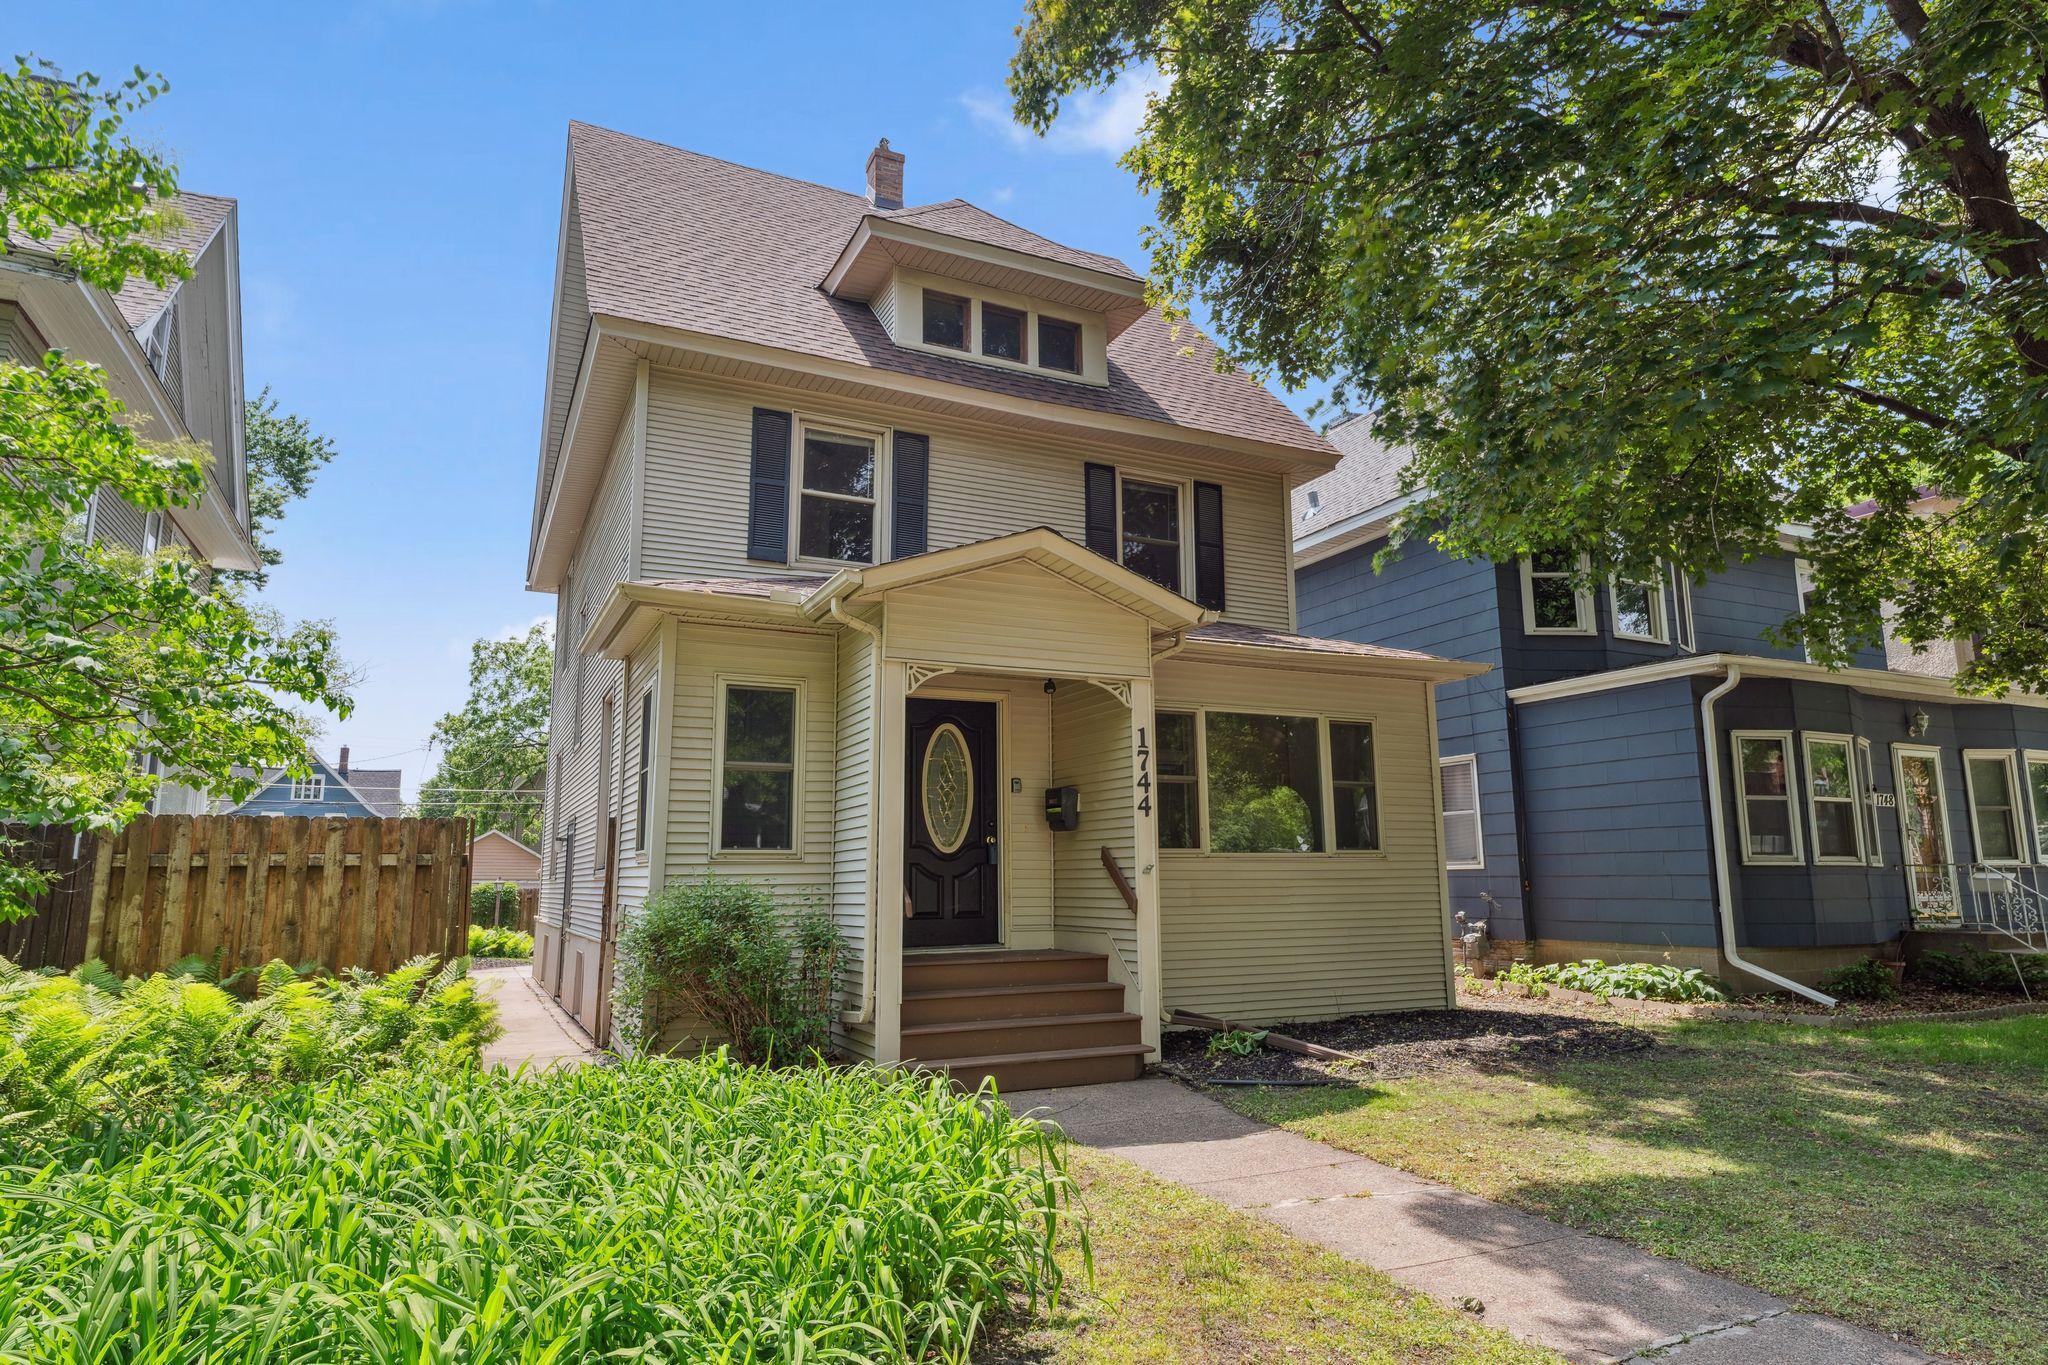
Active
$375,000
4
bds
|
1
ba
|
1,500
sqft
|
built
1910
1744 Marshall Ave, Saint Paul, MN 55104
$-626
Cash flow
-8.7%
Cash-on-Cash Return
4.3%
Cap rate
0.7%
Rent to Value Ratio
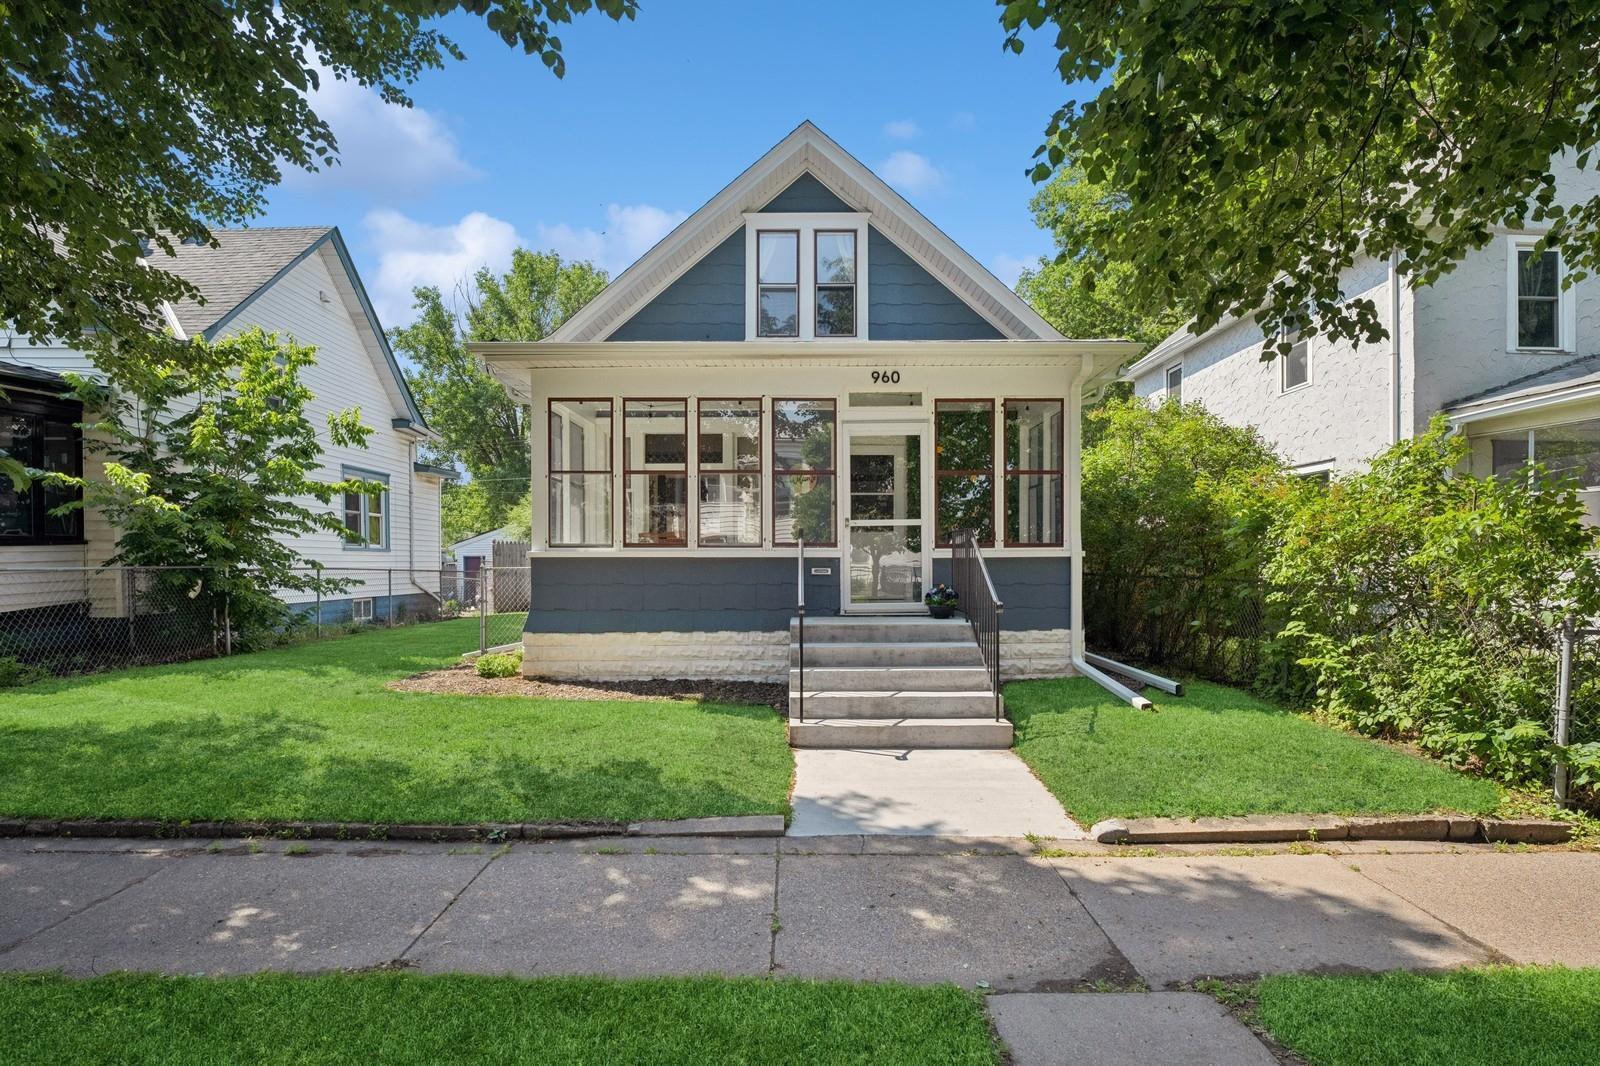
Pending
$275,000
3
bds
|
2
ba
|
1,800
sqft
|
built
1913
960 Edmund Ave, Saint Paul, MN 55104
$-329
Cash flow
-6.2%
Cash-on-Cash Return
4.8%
Cap rate
0.7%
Rent to Value Ratio
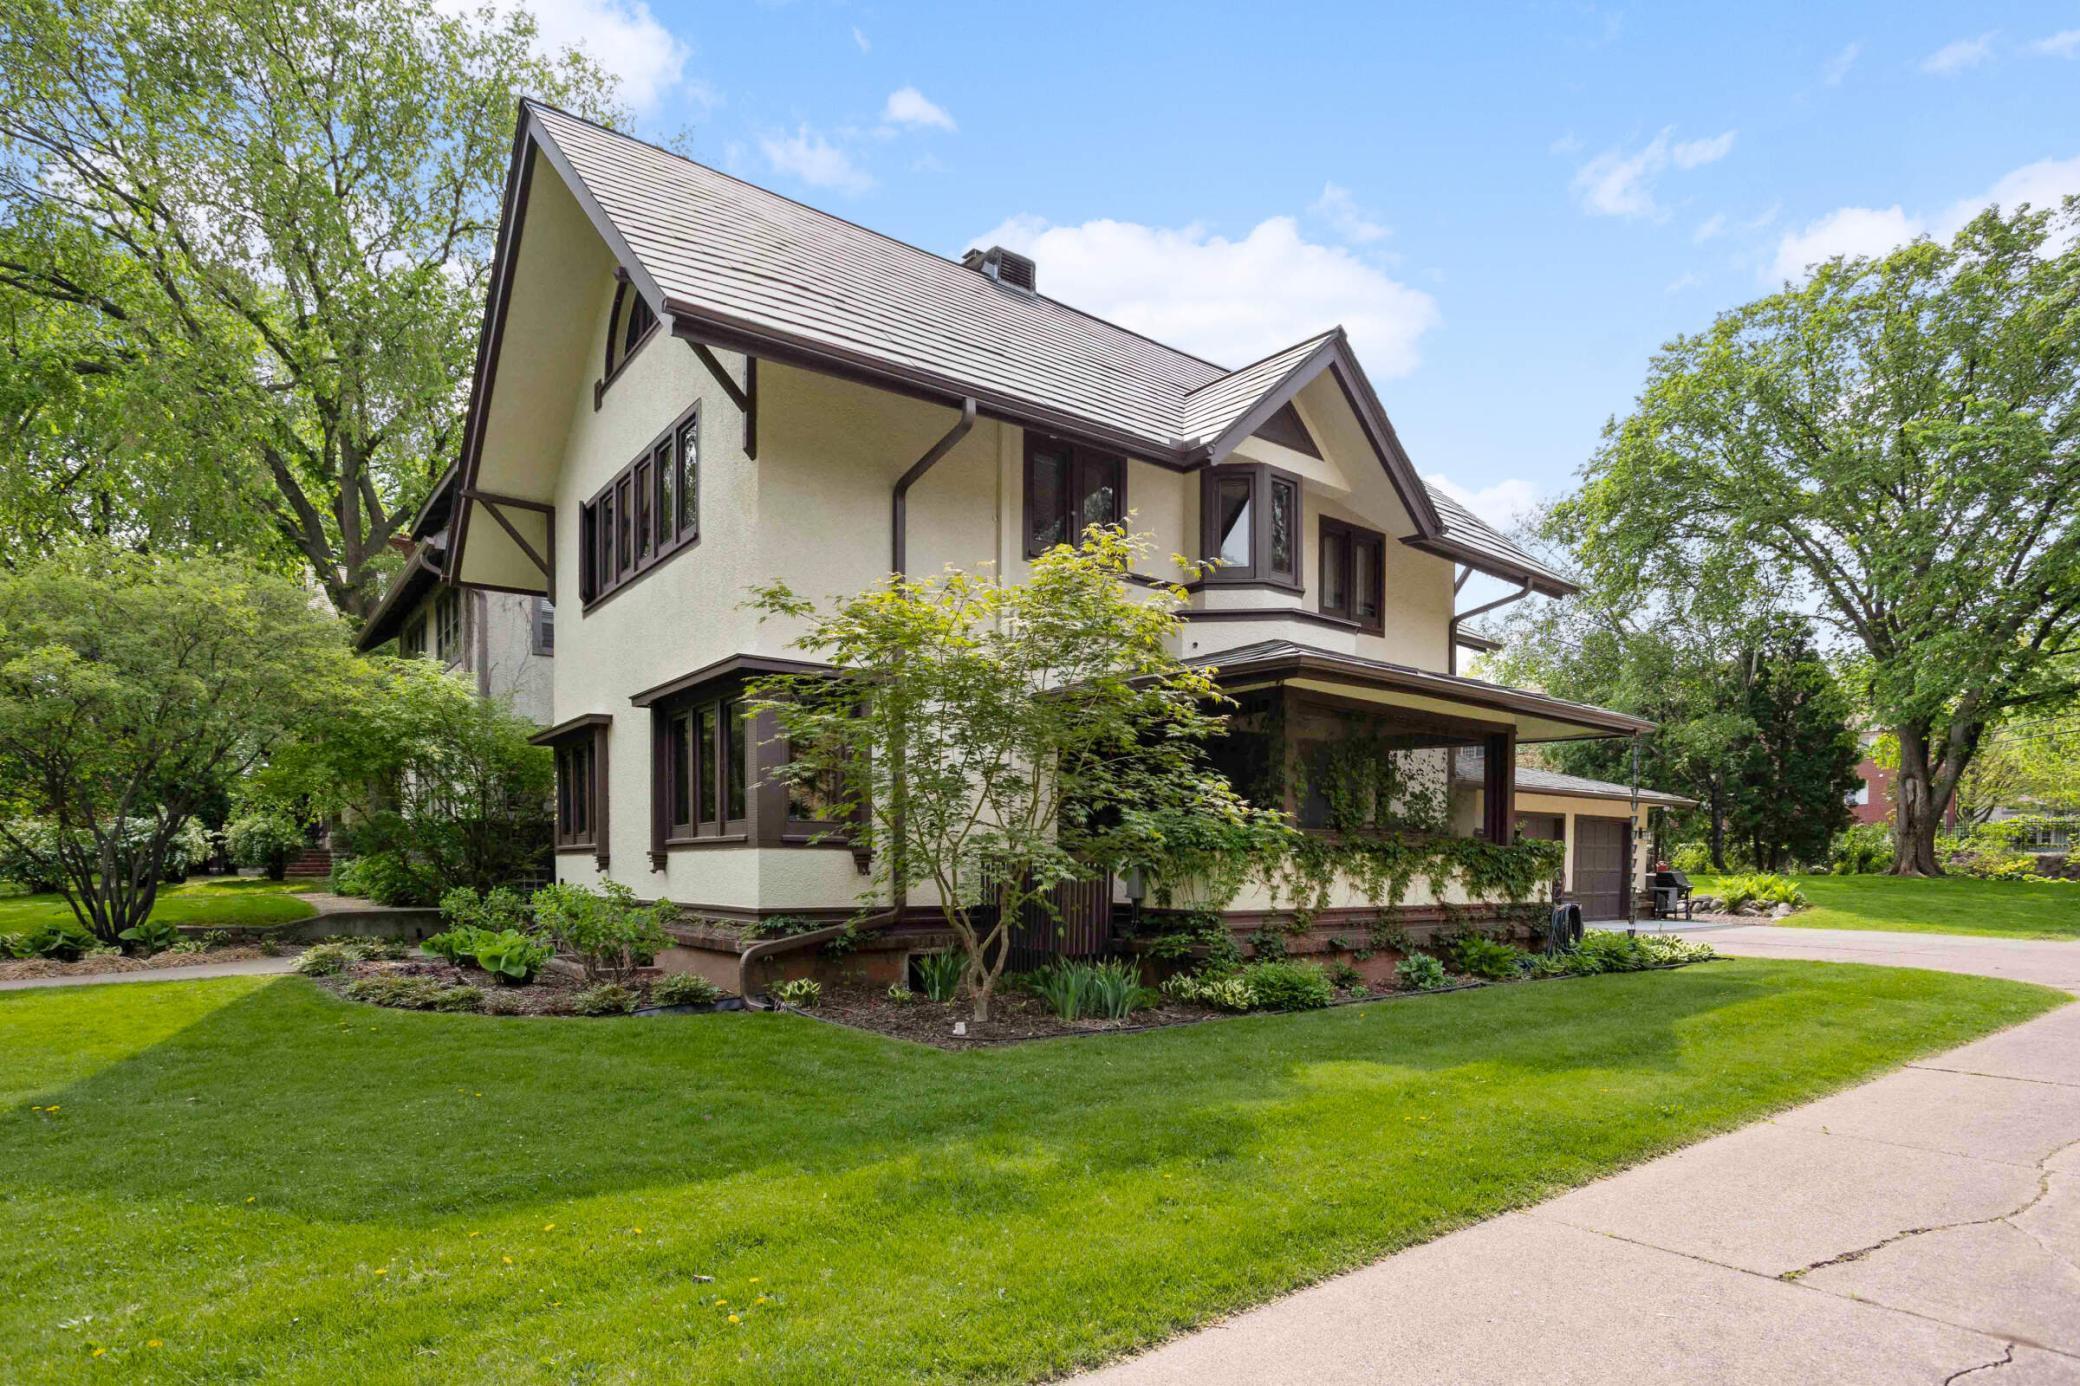
Active
$925,000
5
bds
|
5
ba
|
3,765
sqft
|
built
1912
2022 Summit Ave, Saint Paul, MN 55105
$-2,678
Cash flow
-15.1%
Cash-on-Cash Return
2.8%
Cap rate
0.5%
Rent to Value Ratio
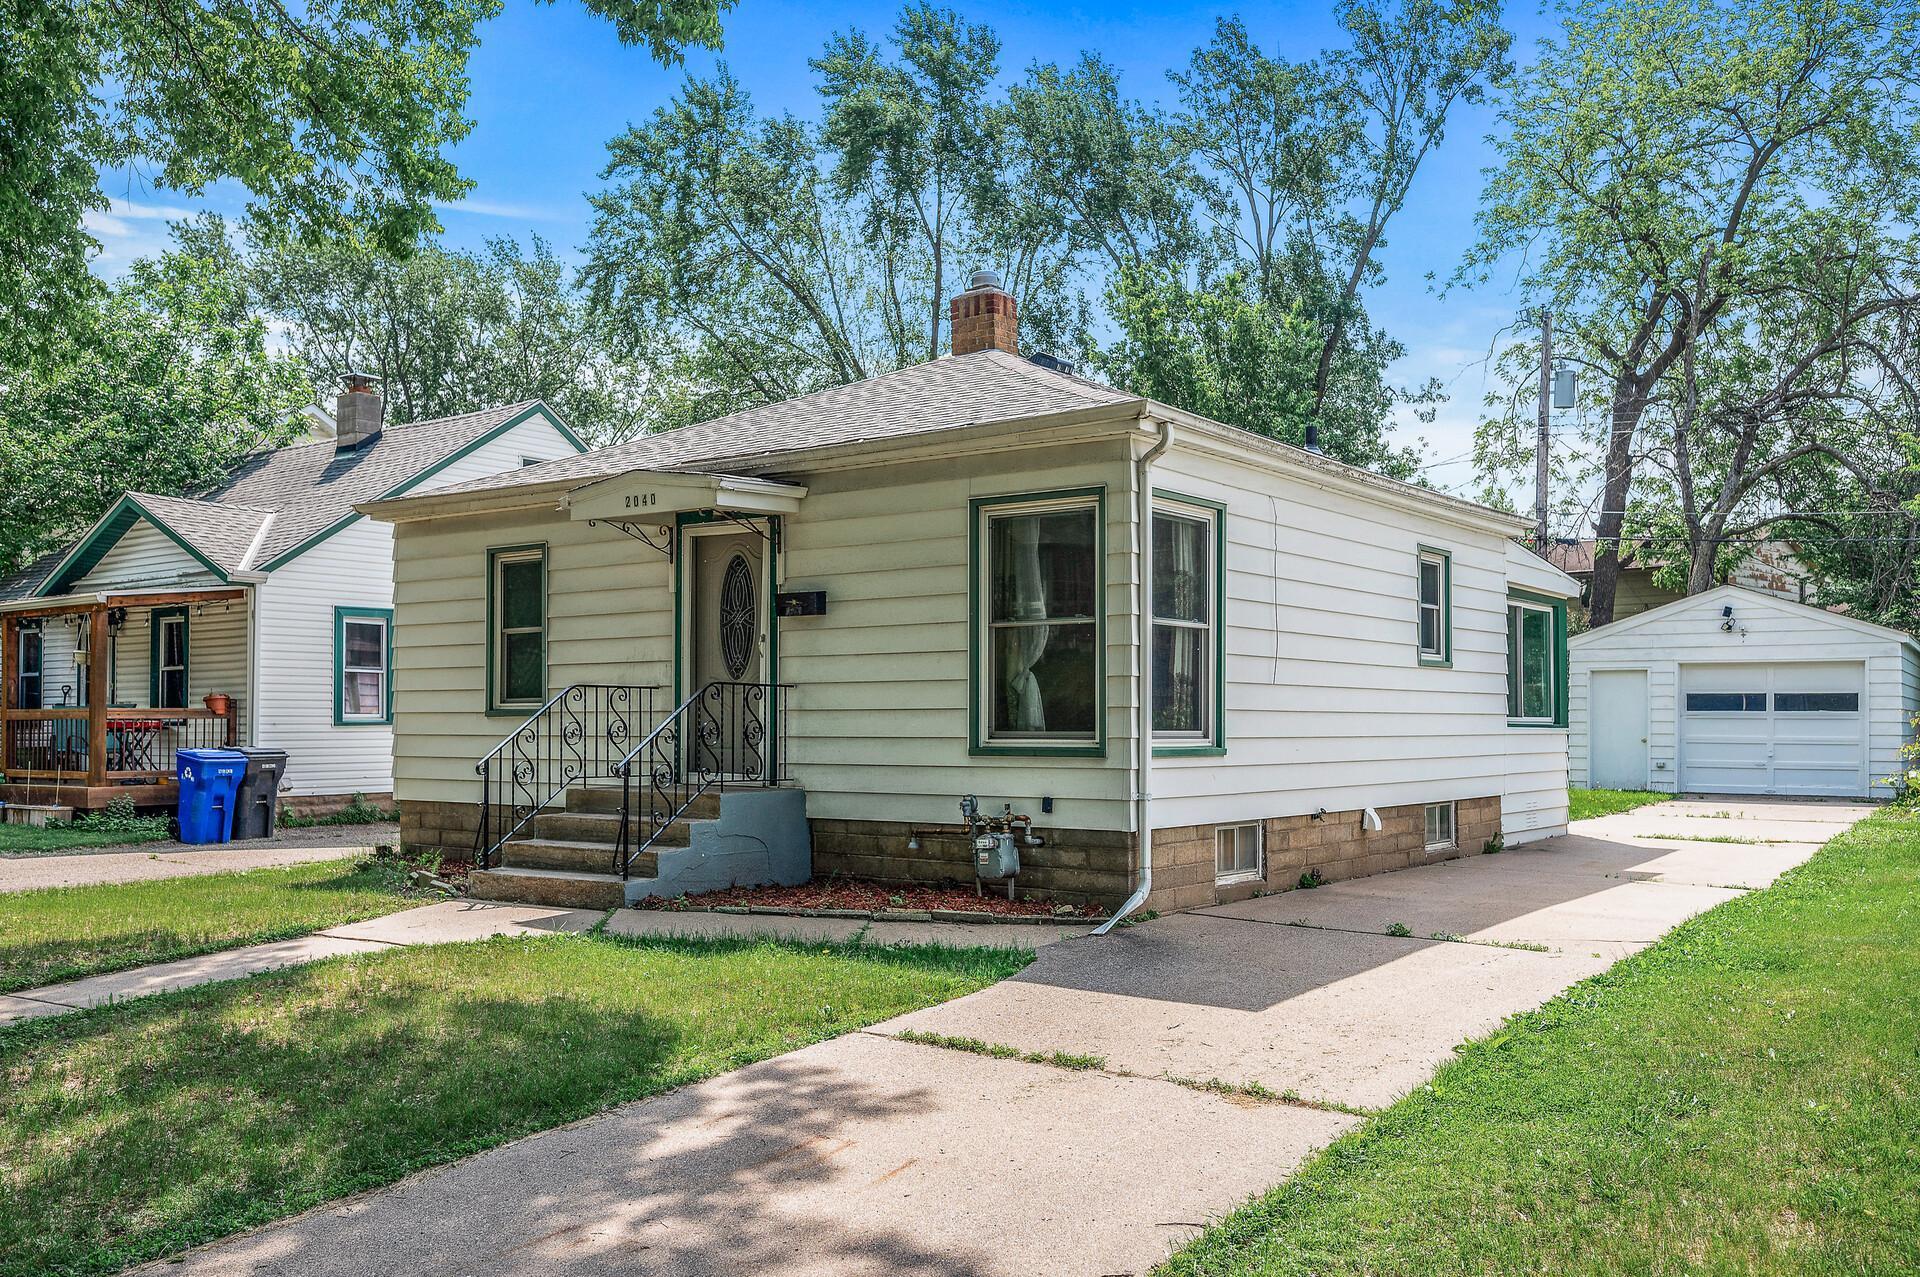
Active
$235,000
2
bds
|
1
ba
|
624
sqft
|
built
1947
2040 Nokomis Ave, Saint Paul, MN 55119
$-428
Cash flow
-9.5%
Cash-on-Cash Return
4.1%
Cap rate
0.7%
Rent to Value Ratio
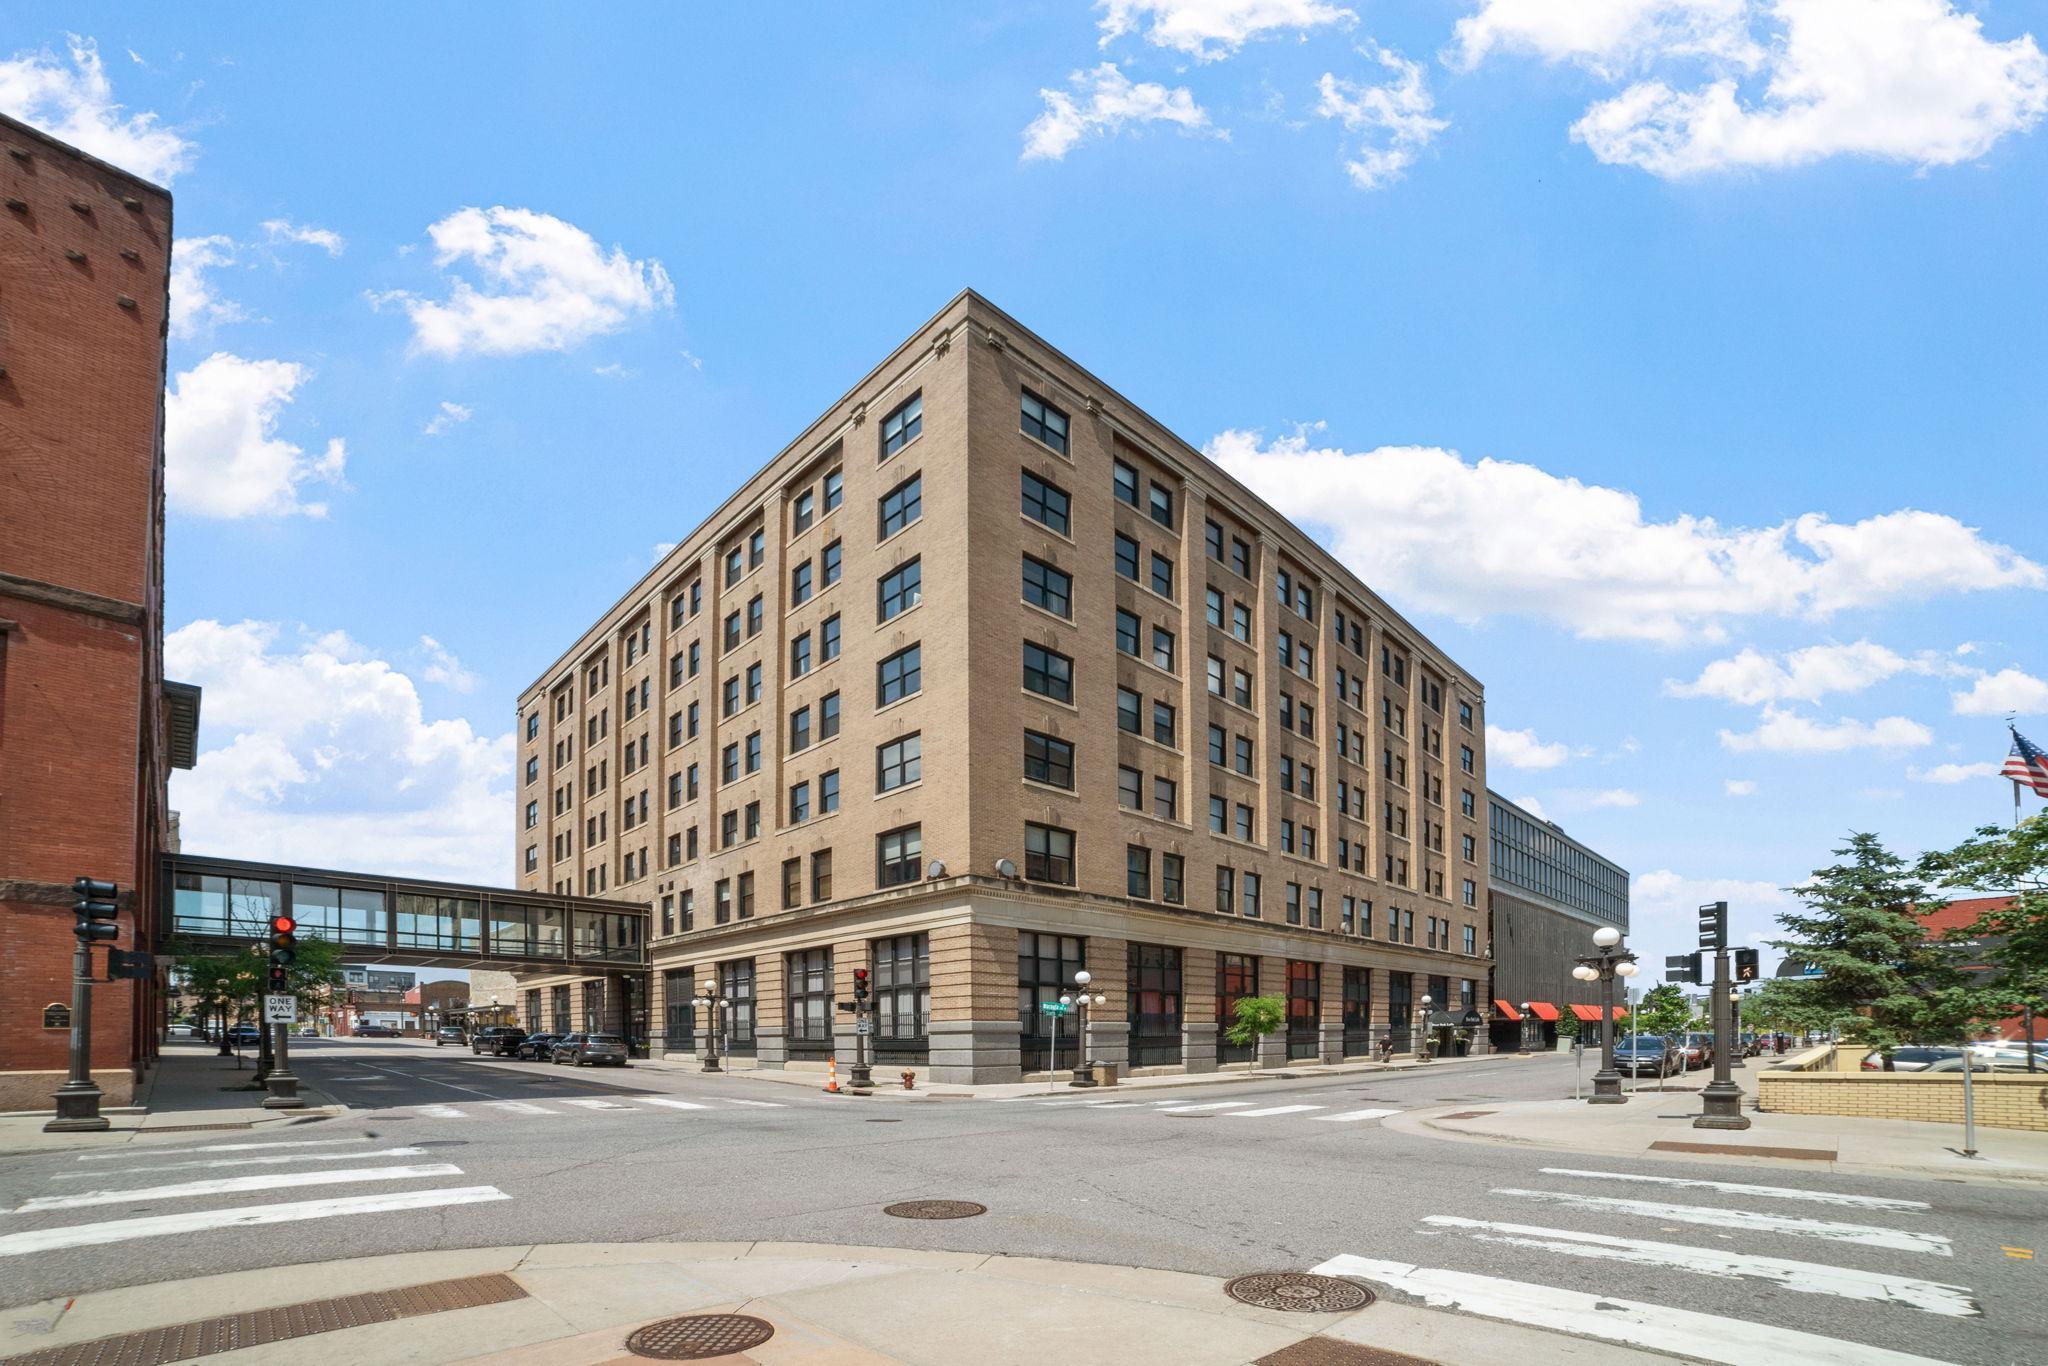
Active
$230,000
1
bds
|
1
ba
|
877
sqft
|
built
1905
406 Wacouta St, Saint Paul, MN 55101
$-993
Cash flow
-22.5%
Cash-on-Cash Return
1.1%
Cap rate
0.8%
Rent to Value Ratio
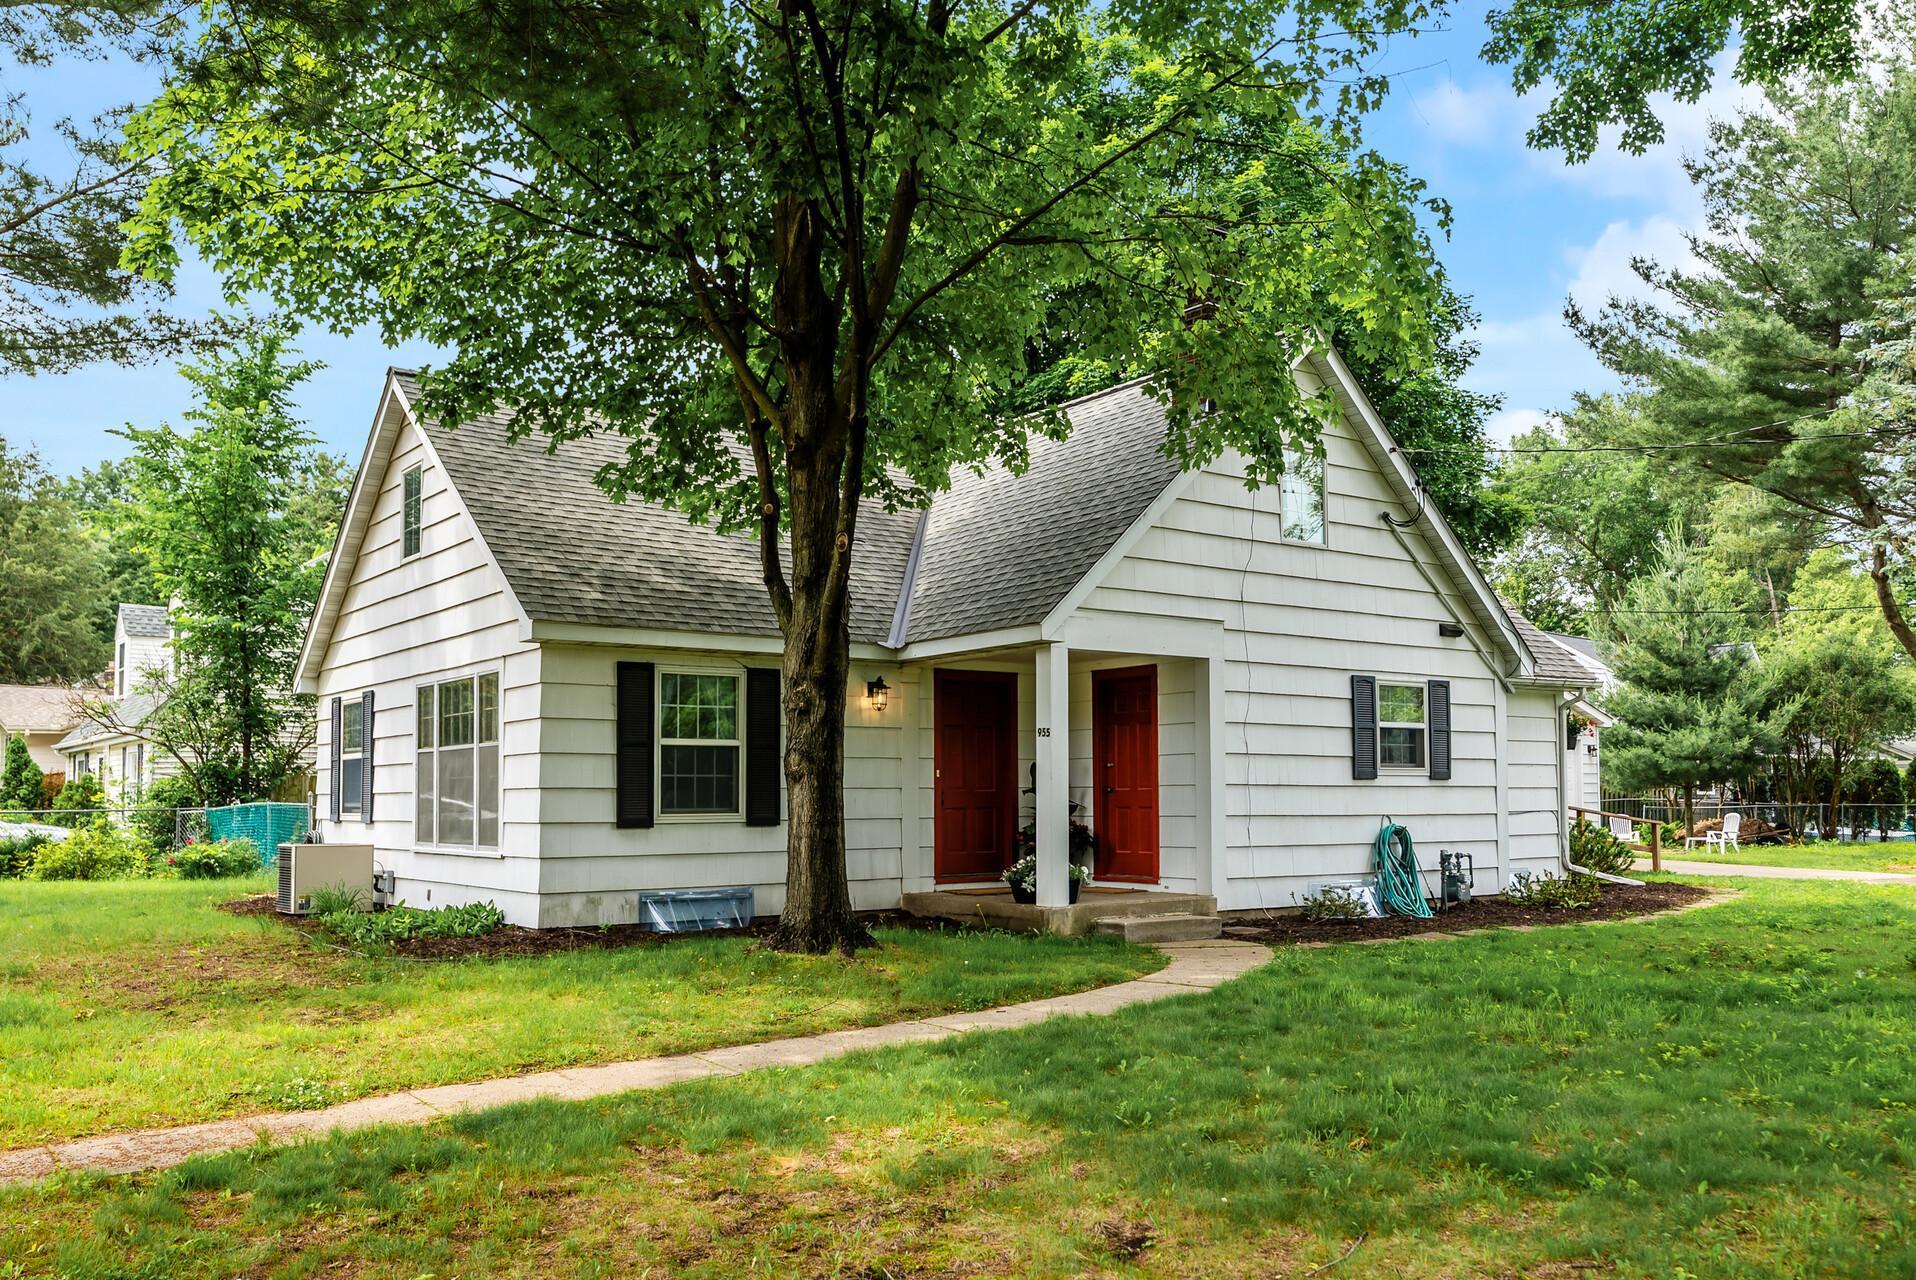
Active
$375,000
3
bds
|
3
ba
|
1,652
sqft
|
built
1942
955 Warner Ave N, Saint Paul, MN 55115
$-570
Cash flow
-7.9%
Cash-on-Cash Return
4.5%
Cap rate
0.7%
Rent to Value Ratio
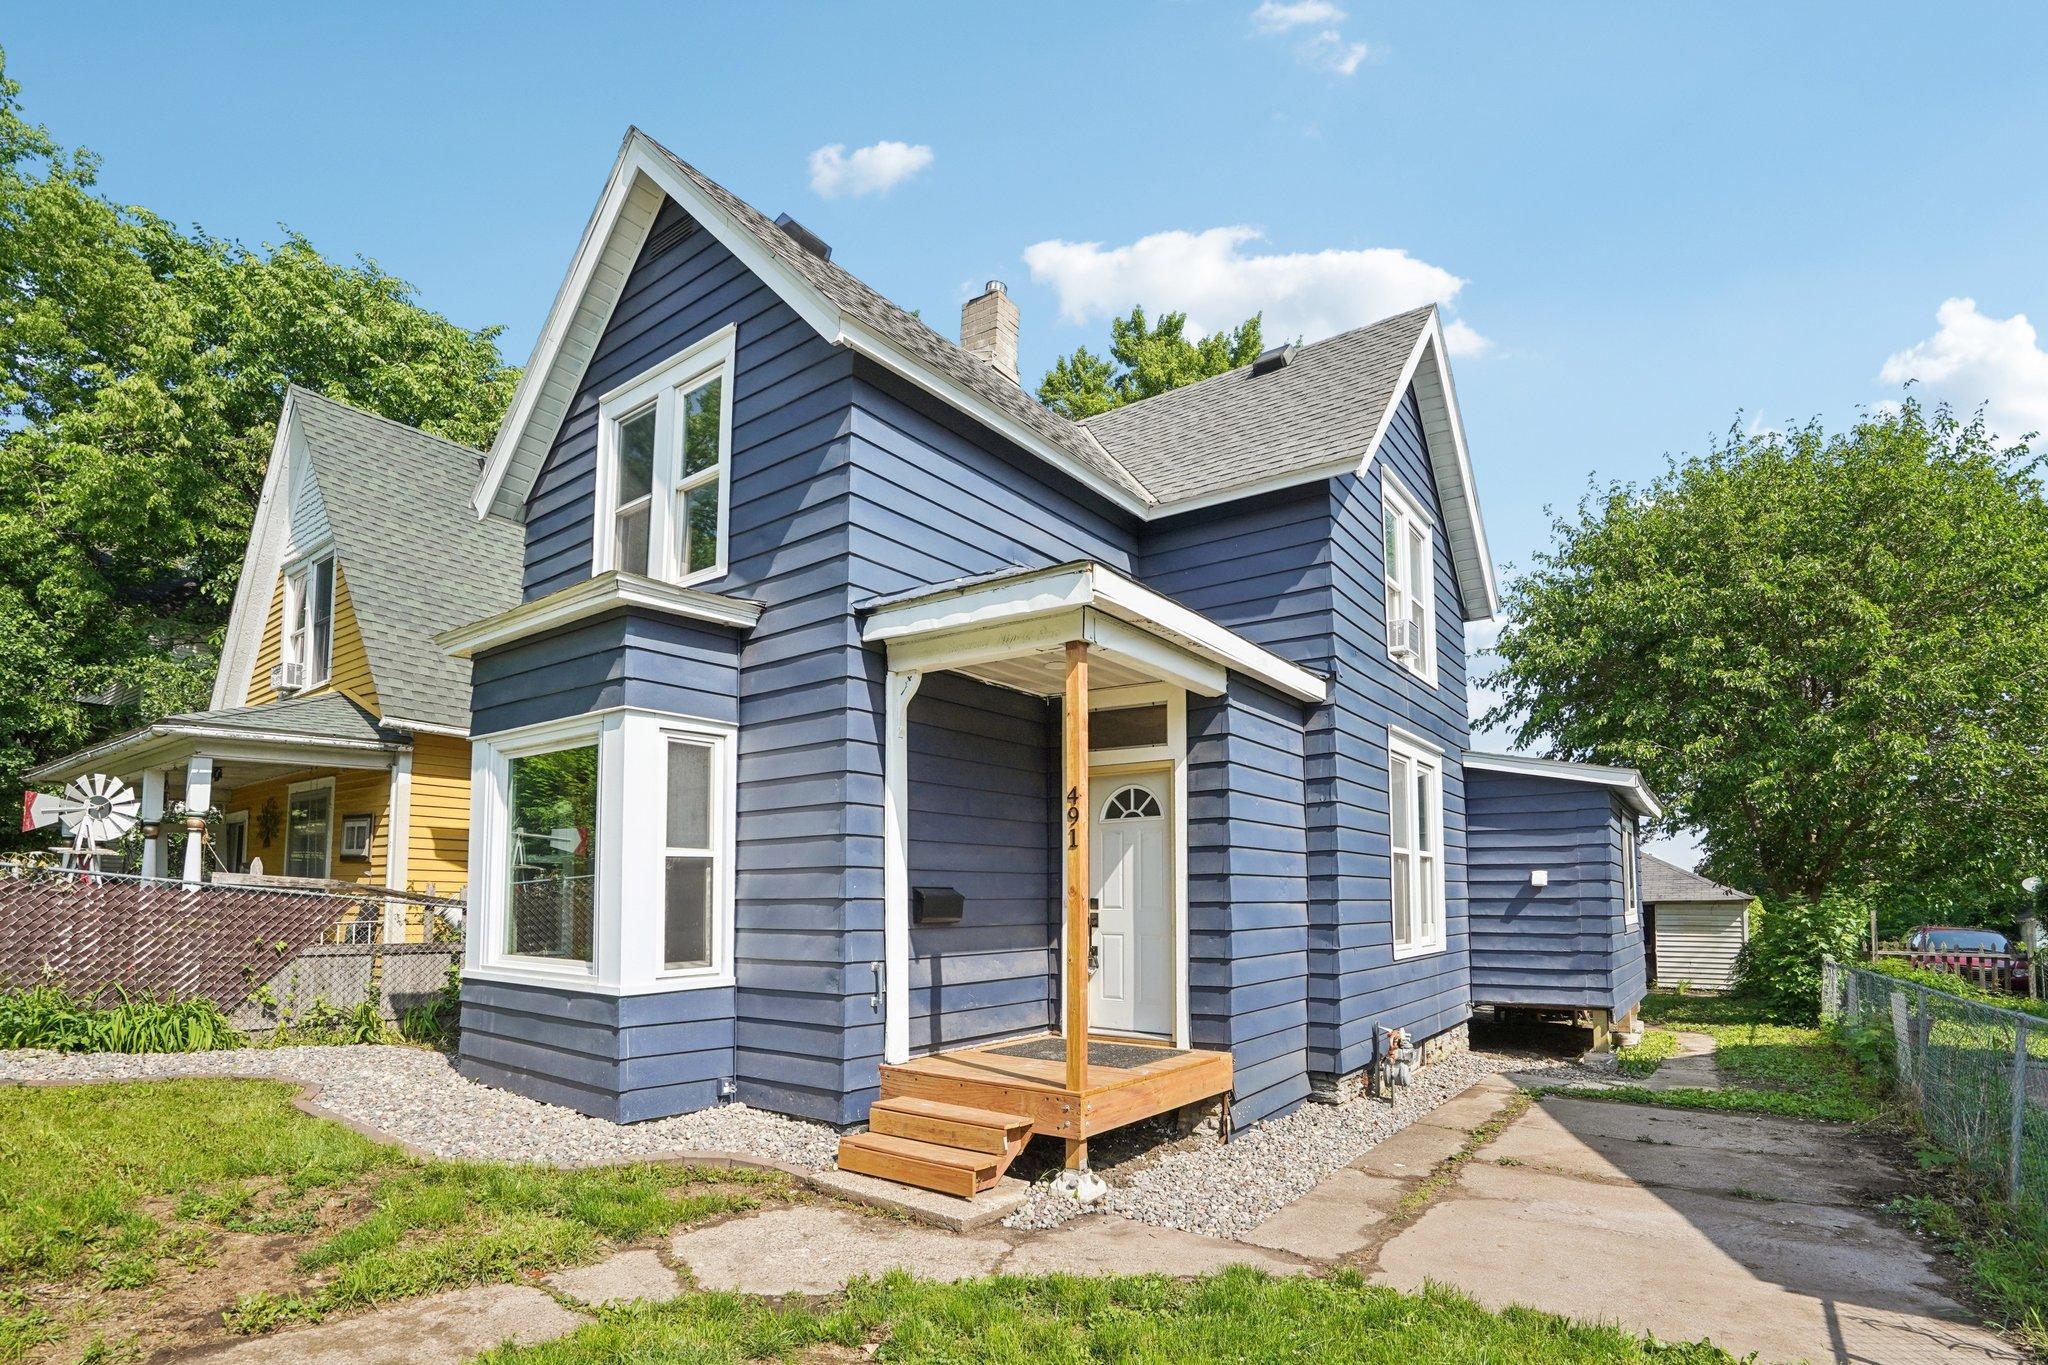
Active
$239,900
3
bds
|
2
ba
|
1,254
sqft
|
built
1889
491 Belvidere St E, Saint Paul, MN 55107
$-214
Cash flow
-4.7%
Cash-on-Cash Return
5.2%
Cap rate
0.8%
Rent to Value Ratio
Active
$350,000
3
bds
|
2
ba
|
1,828
sqft
|
built
1978
1198 Saint Clair Ave, Saint Paul, MN 55105
$-1,359
Cash flow
-20.3%
Cash-on-Cash Return
1.6%
Cap rate
0.7%
Rent to Value Ratio
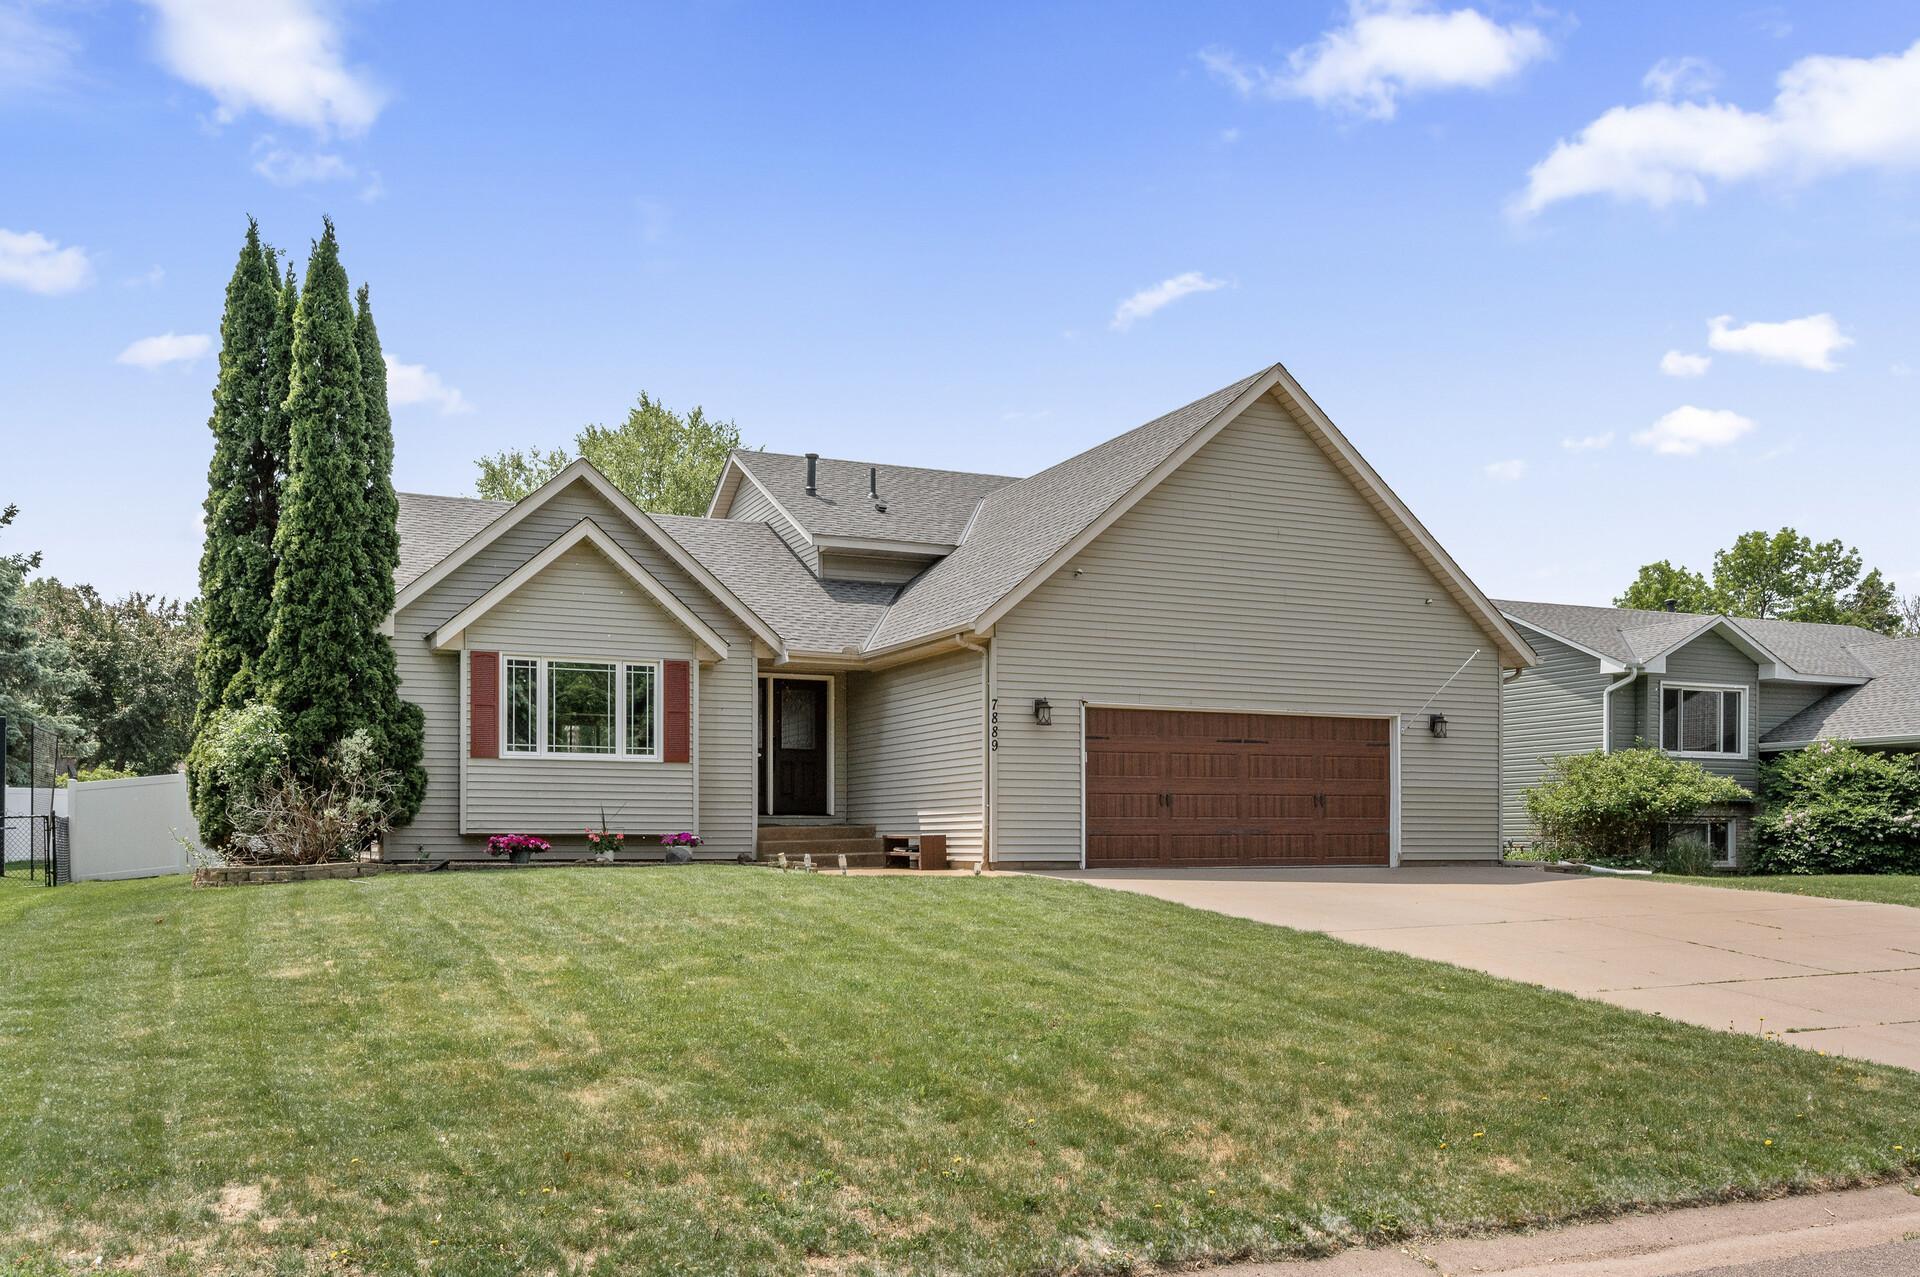
Active
$490,000
4
bds
|
3
ba
|
2,236
sqft
|
built
1992
7889 18th St N, Saint Paul, MN 55128
$-707
Cash flow
-7.5%
Cash-on-Cash Return
4.6%
Cap rate
0.7%
Rent to Value Ratio
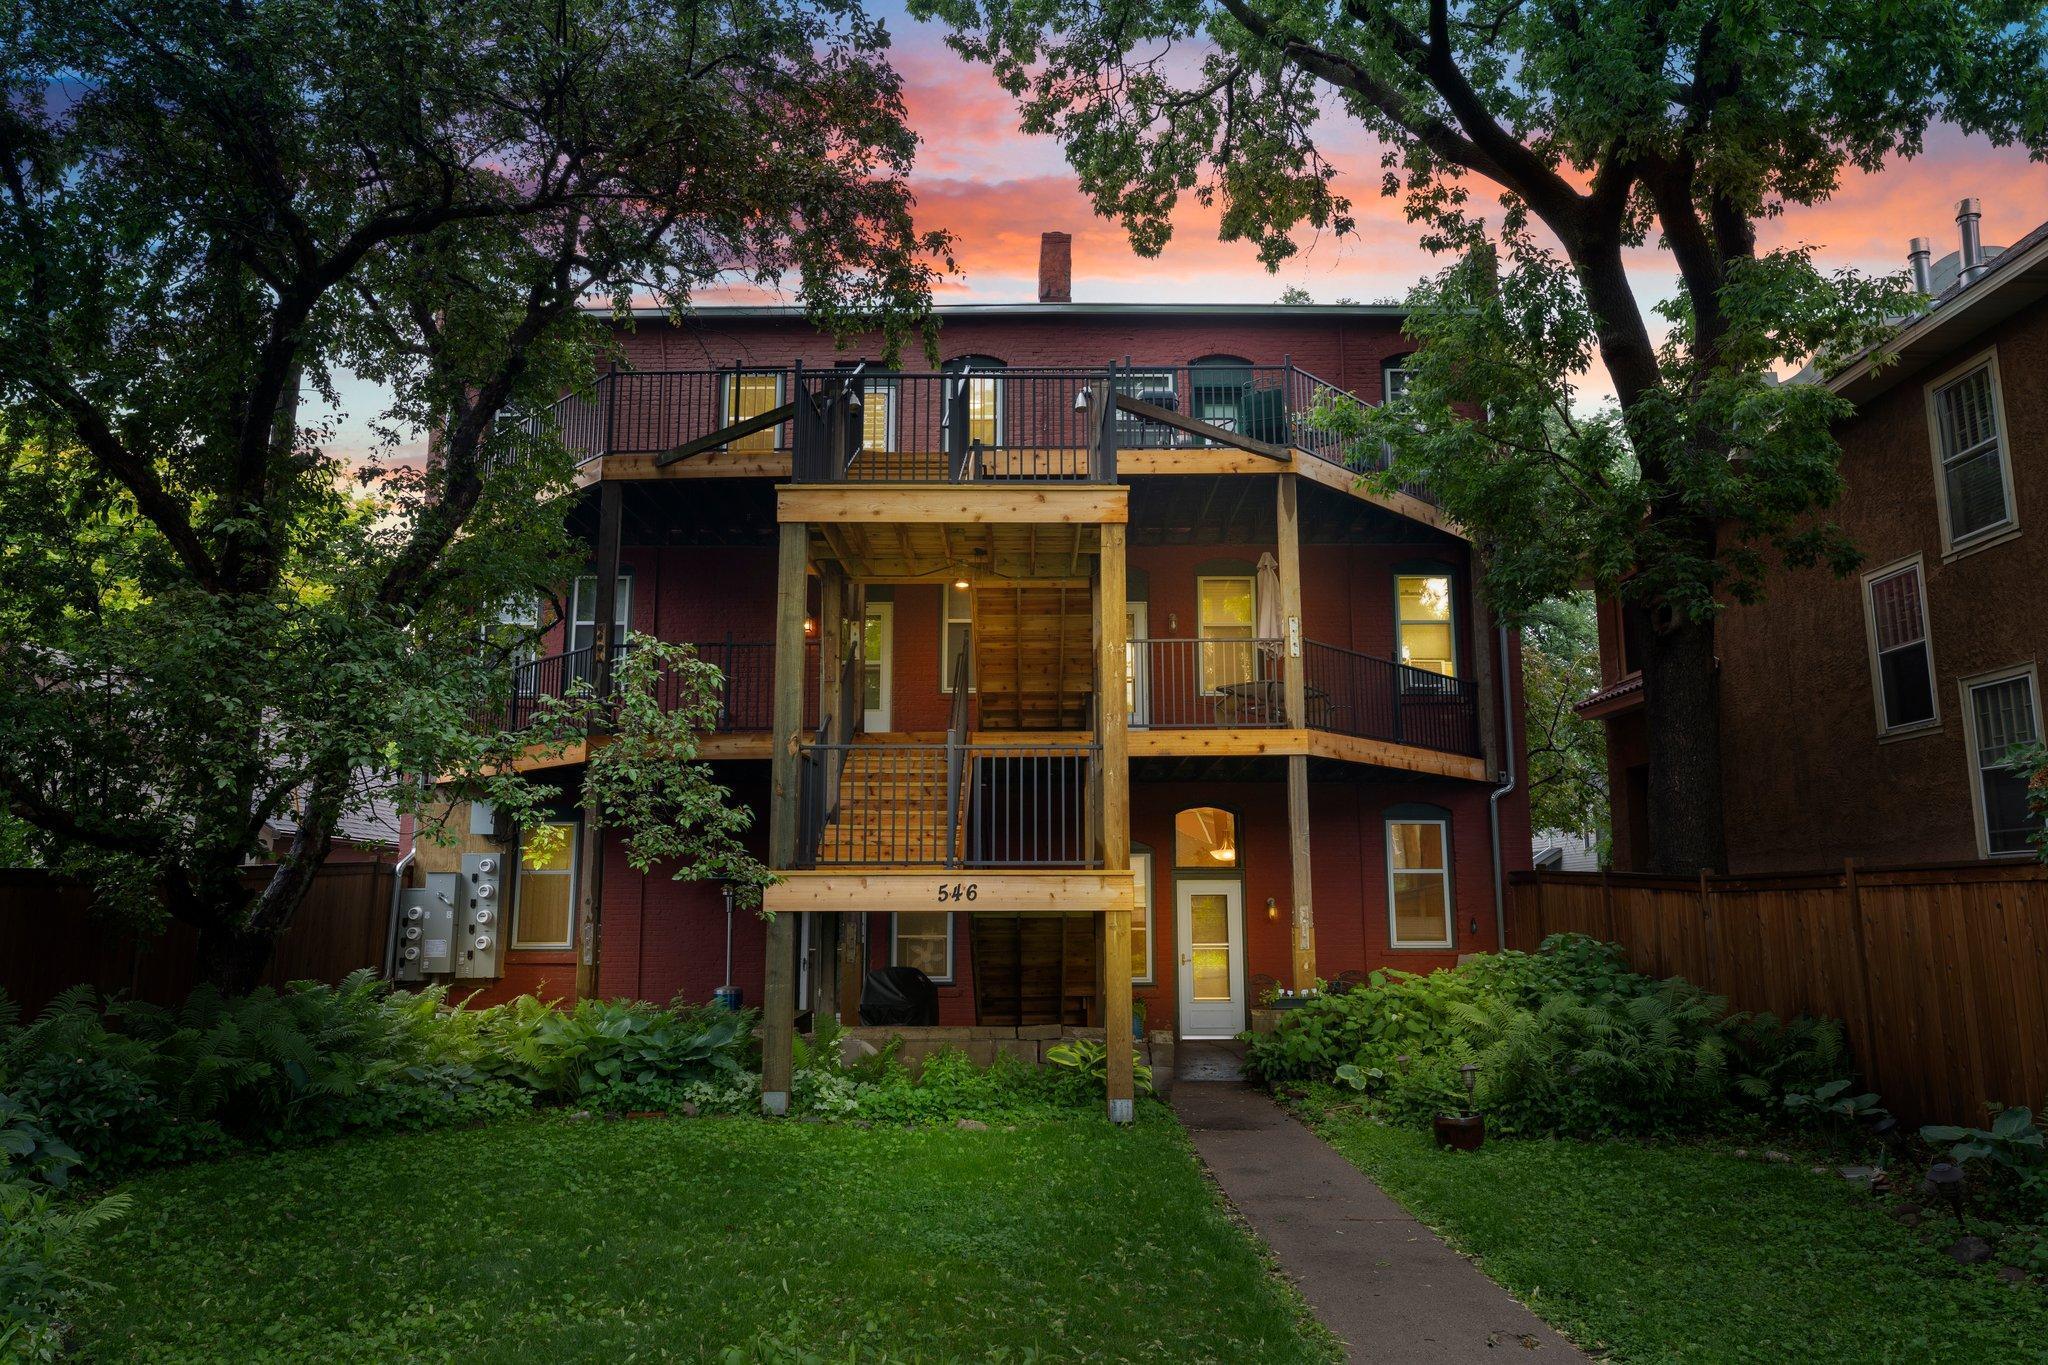
Pending
$189,900
2
bds
|
1
ba
|
951
sqft
|
built
1889
546 Laurel Ave, Saint Paul, MN 55102
$-506
Cash flow
-13.9%
Cash-on-Cash Return
3.1%
Cap rate
0.9%
Rent to Value Ratio
Active
$225,000
1
bds
|
1
ba
|
698
sqft
|
built
1914
915 Cottage Ave E, Saint Paul, MN 55106
$-125
Cash flow
-2.9%
Cash-on-Cash Return
5.6%
Cap rate
0.8%
Rent to Value Ratio
Active
$150,000
1
bds
|
1
ba
|
710
sqft
|
built
1983
1111 Elway St, Saint Paul, MN 55116
$-355
Cash flow
-12.3%
Cash-on-Cash Return
3.4%
Cap rate
0.9%
Rent to Value Ratio
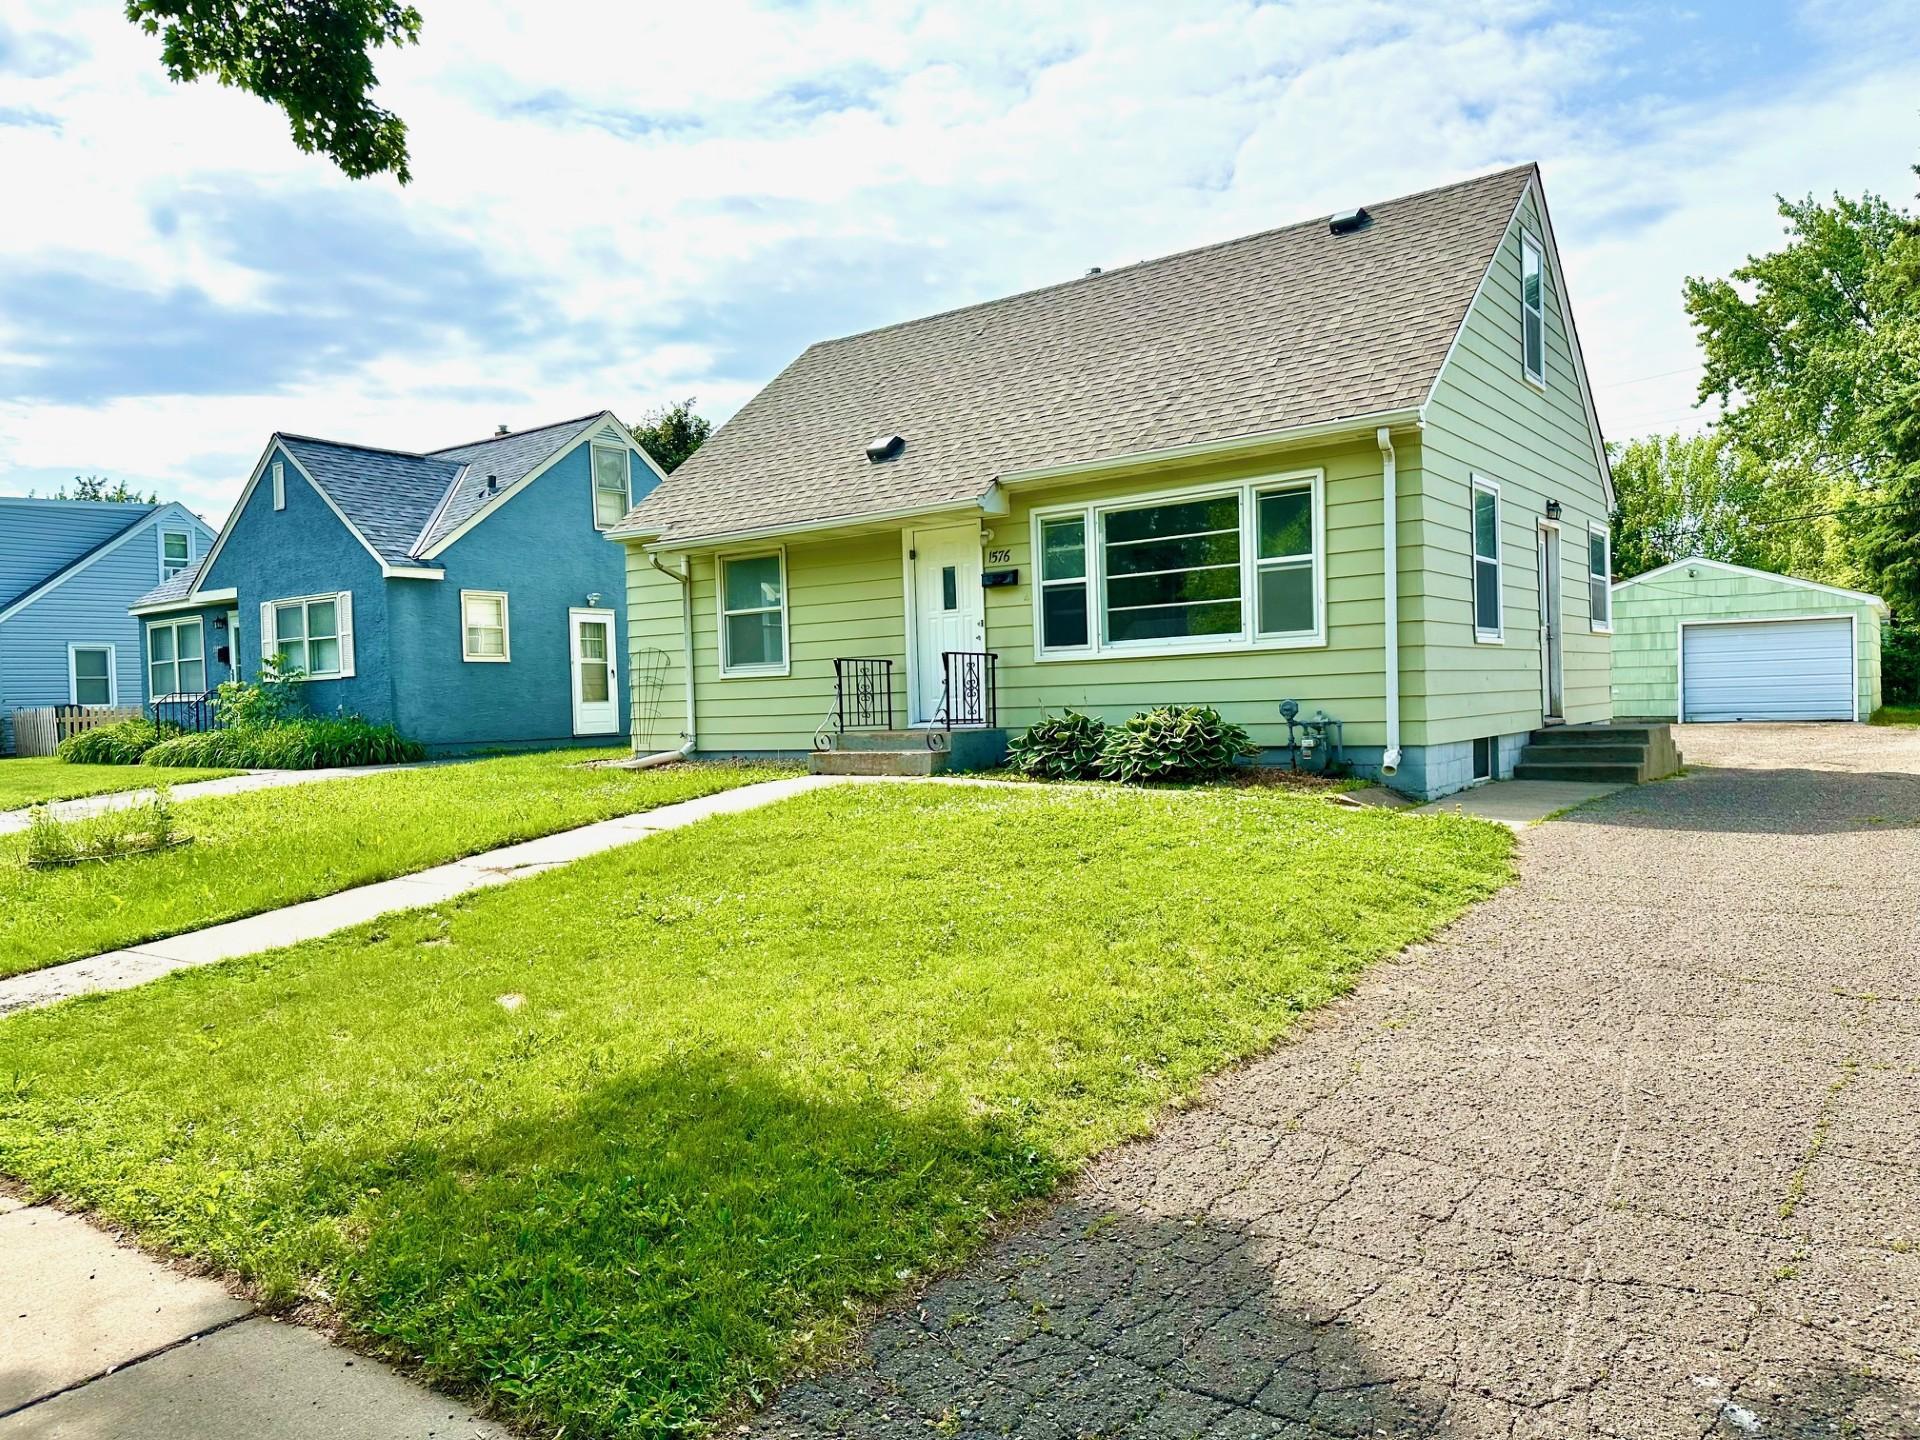
Active
$249,900
3
bds
|
2
ba
|
1,075
sqft
|
built
1951
1576 Nebraska Ave E, Saint Paul, MN 55106
$-163
Cash flow
-3.4%
Cash-on-Cash Return
5.5%
Cap rate
0.8%
Rent to Value Ratio
Active
$469,900
4
bds
|
3
ba
|
2,914
sqft
|
built
1994
2211 Douglynn Ln, Saint Paul, MN 55119
$-914
Cash flow
-10.1%
Cash-on-Cash Return
4.0%
Cap rate
0.7%
Rent to Value Ratio
Active
$97,900
1
bds
|
1
ba
|
667
sqft
|
built
1978
1181 Edgcumbe Rd, Saint Paul, MN 55105
$-32
Cash flow
-1.7%
Cash-on-Cash Return
5.9%
Cap rate
1.2%
Rent to Value Ratio
Active
$339,900
6
bds
|
2
ba
|
2,105
sqft
|
built
1885
982 Burr St, Saint Paul, MN 55130
$-623
Cash flow
-9.6%
Cash-on-Cash Return
4.1%
Cap rate
0.5%
Rent to Value Ratio
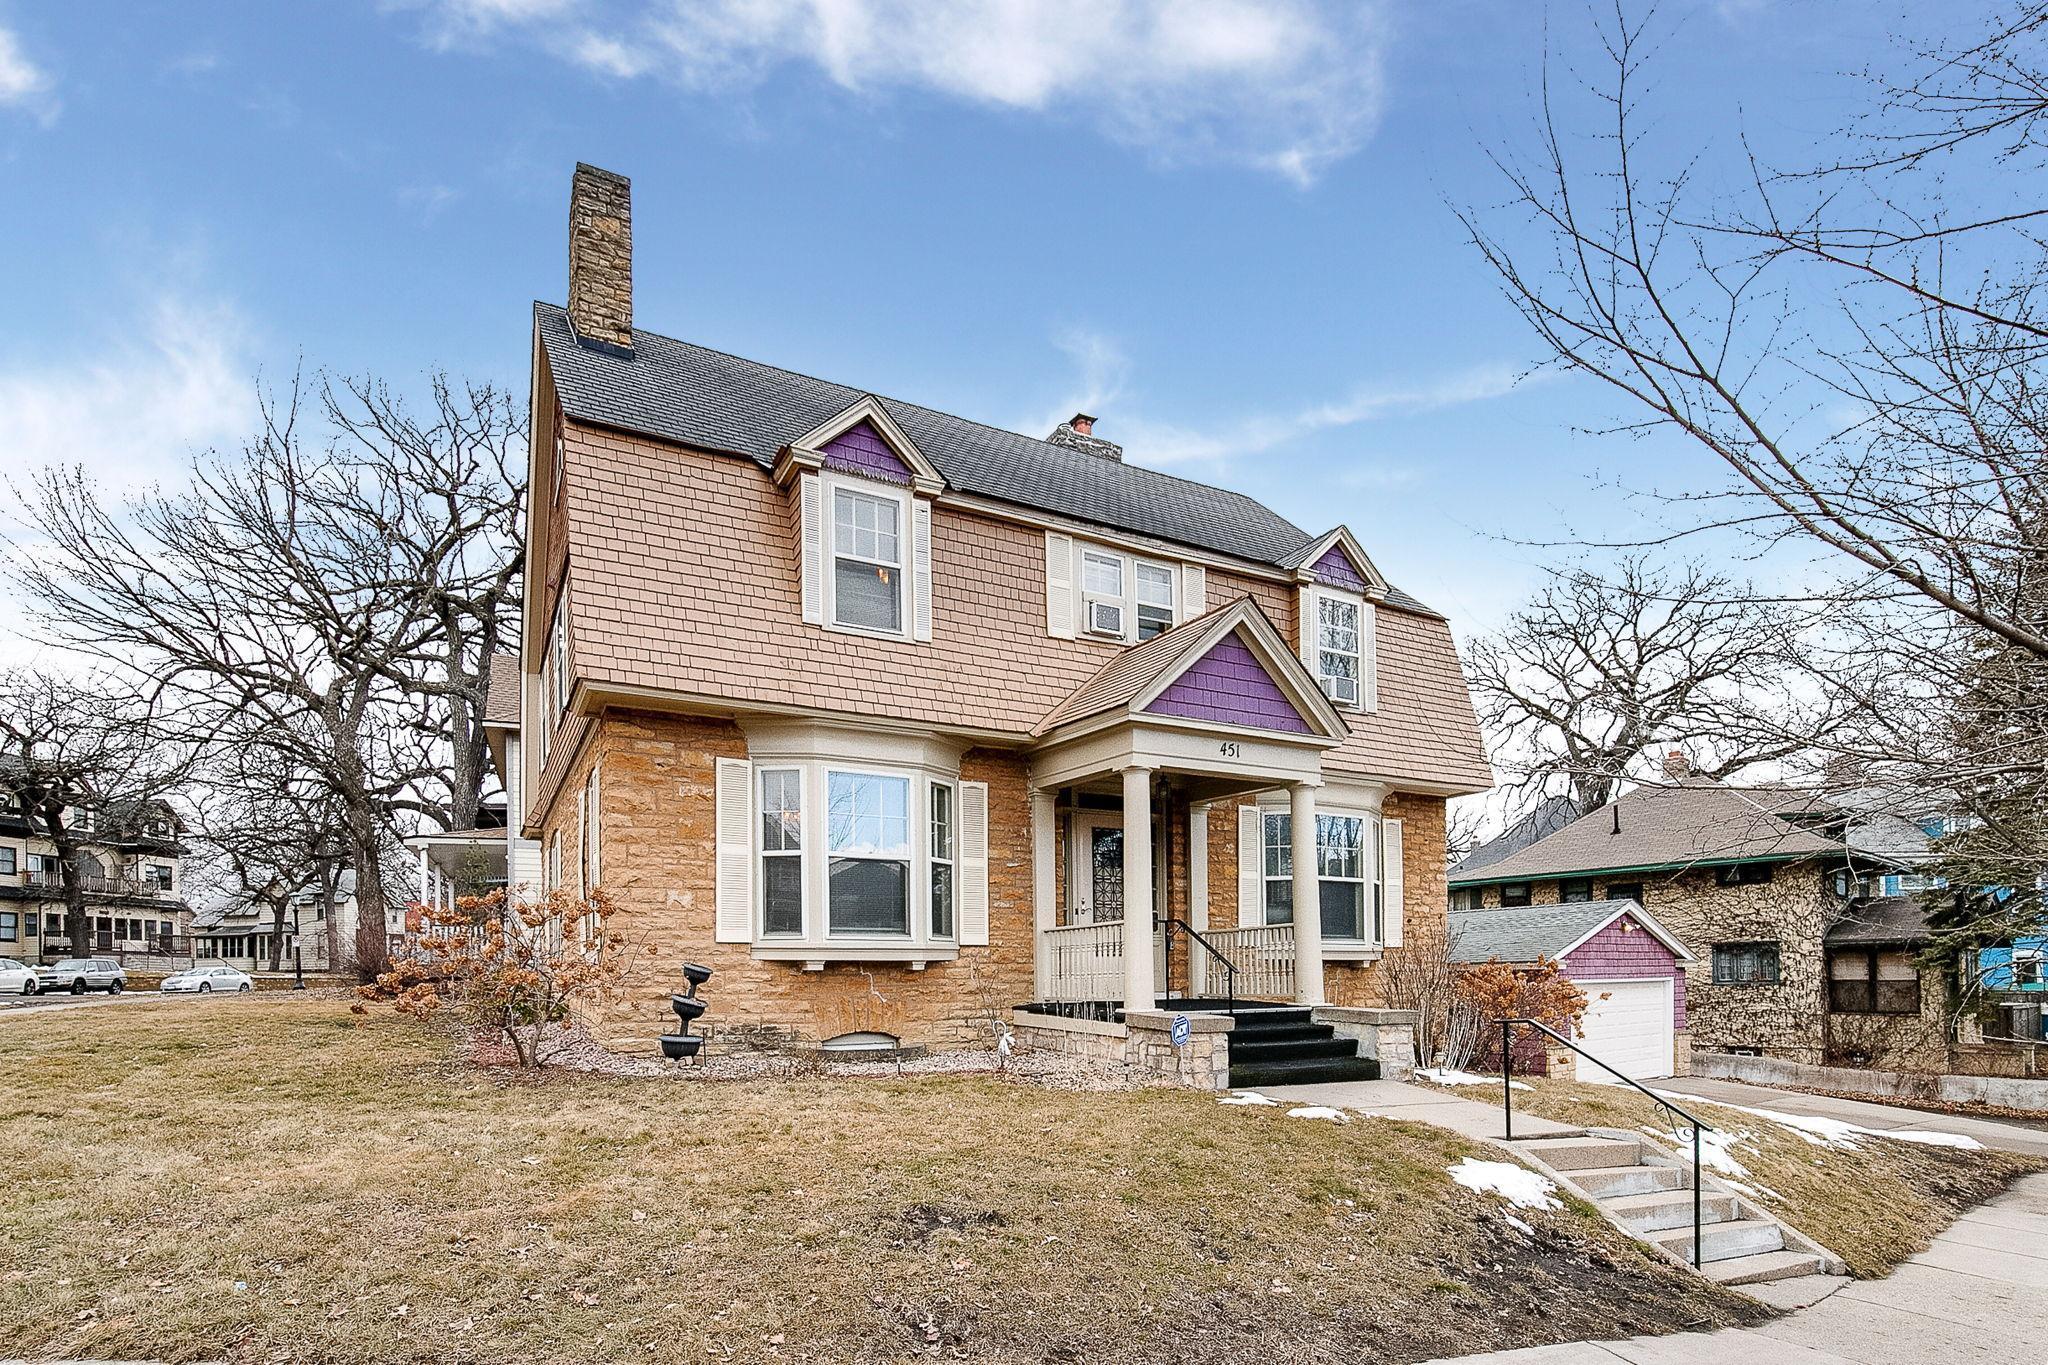
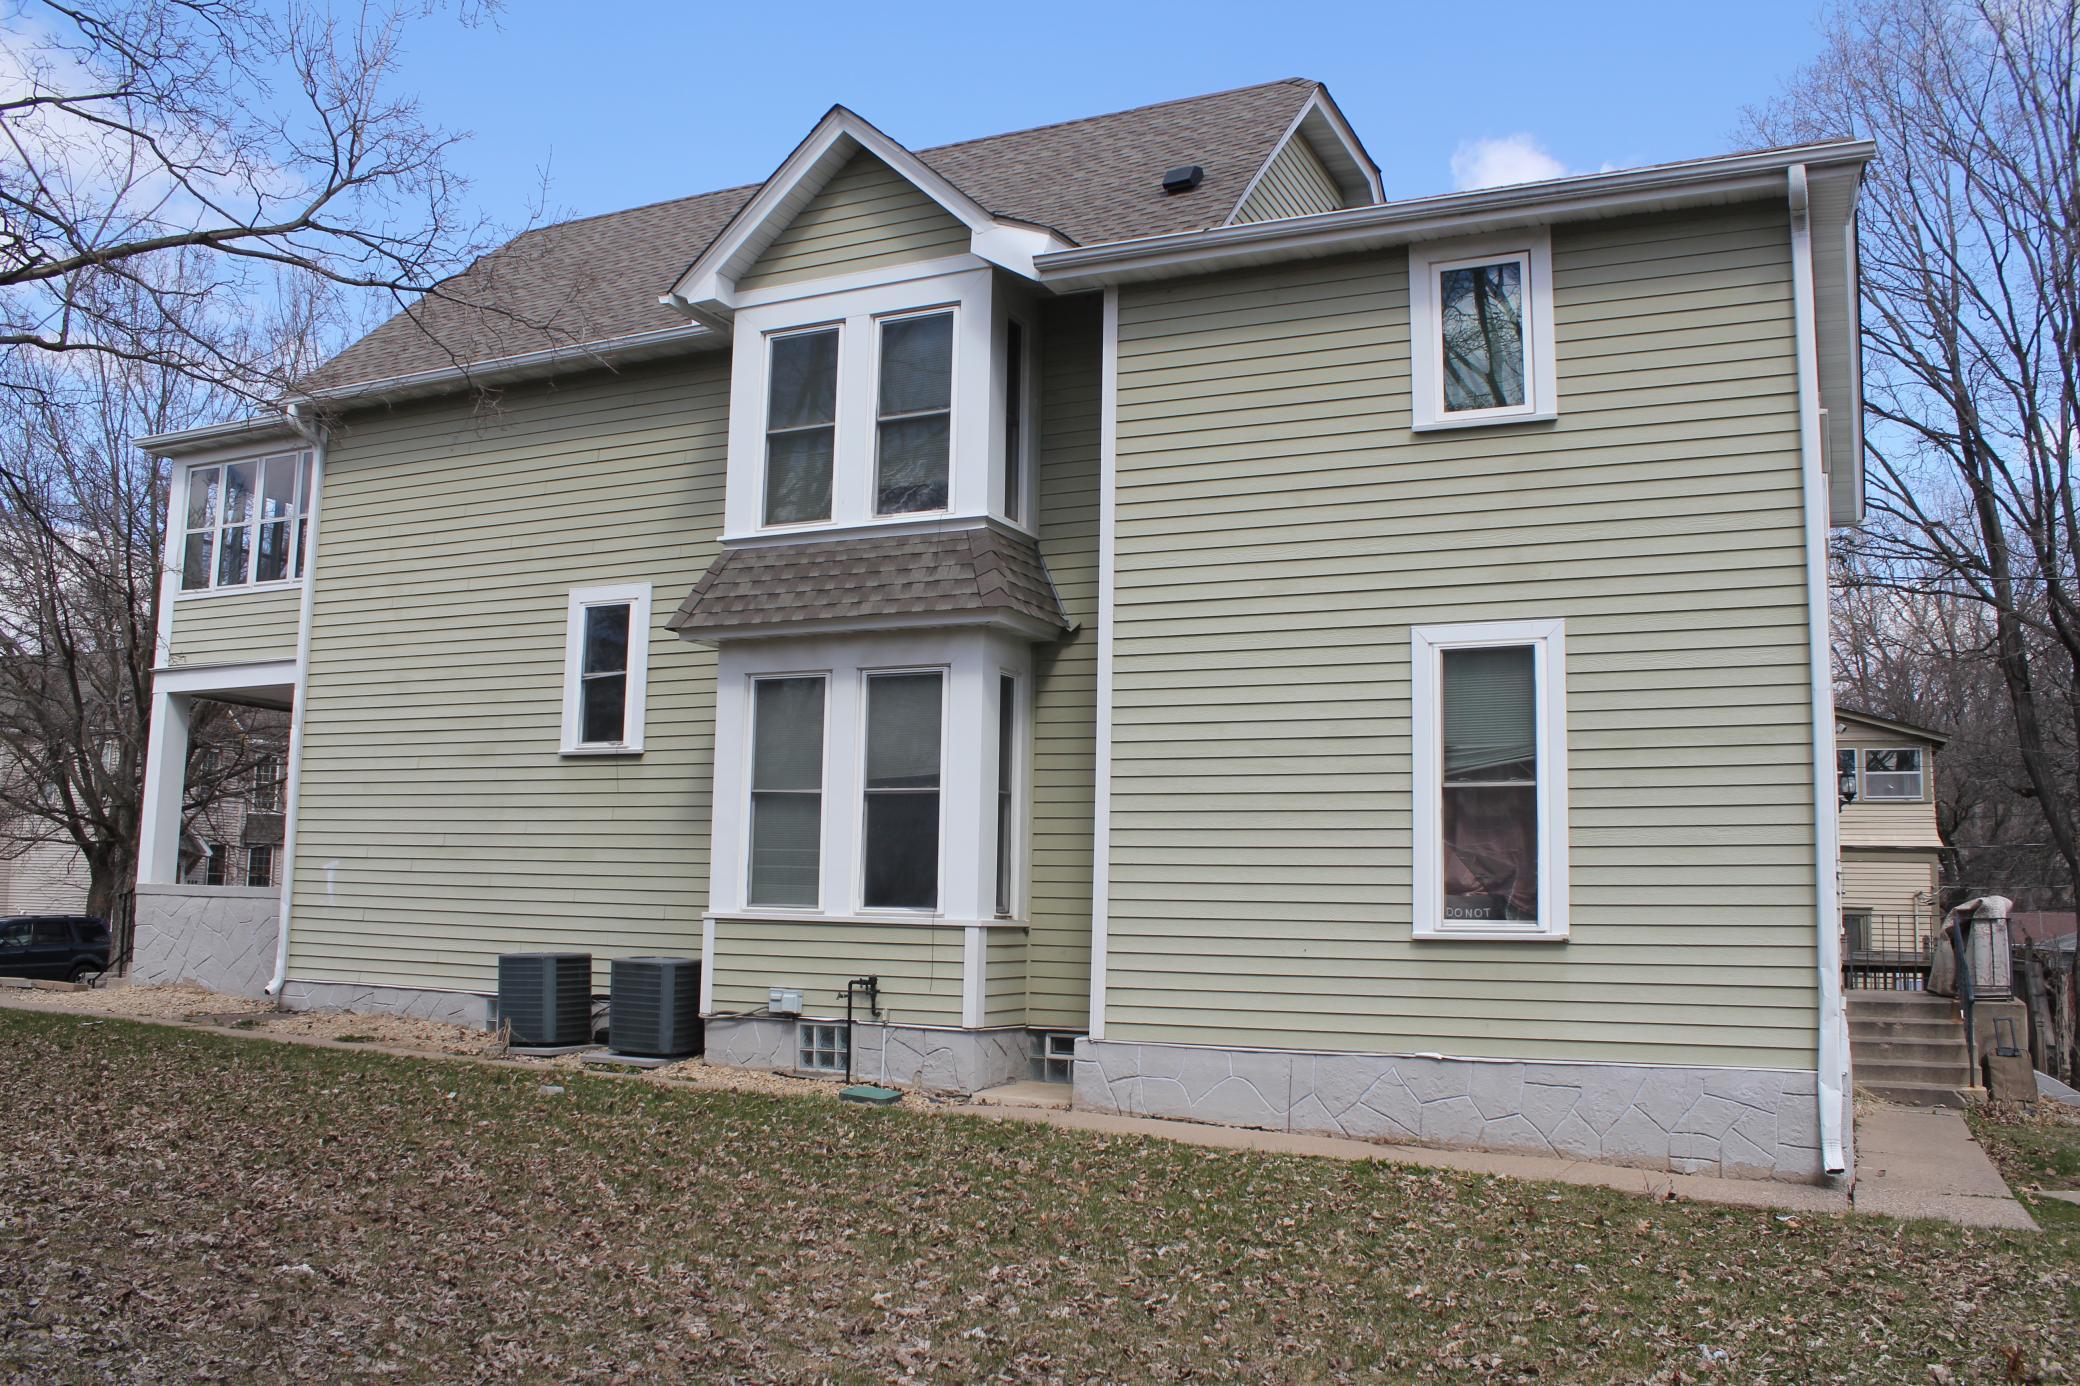
Active
$535,000
5
bds
|
3
ba
|
3,000
sqft
|
built
1903
451 Lynnhurst Ave E, Saint Paul, MN 55104
$-1,226
Cash flow
-12.0%
Cash-on-Cash Return
3.5%
Cap rate
0.6%
Rent to Value Ratio
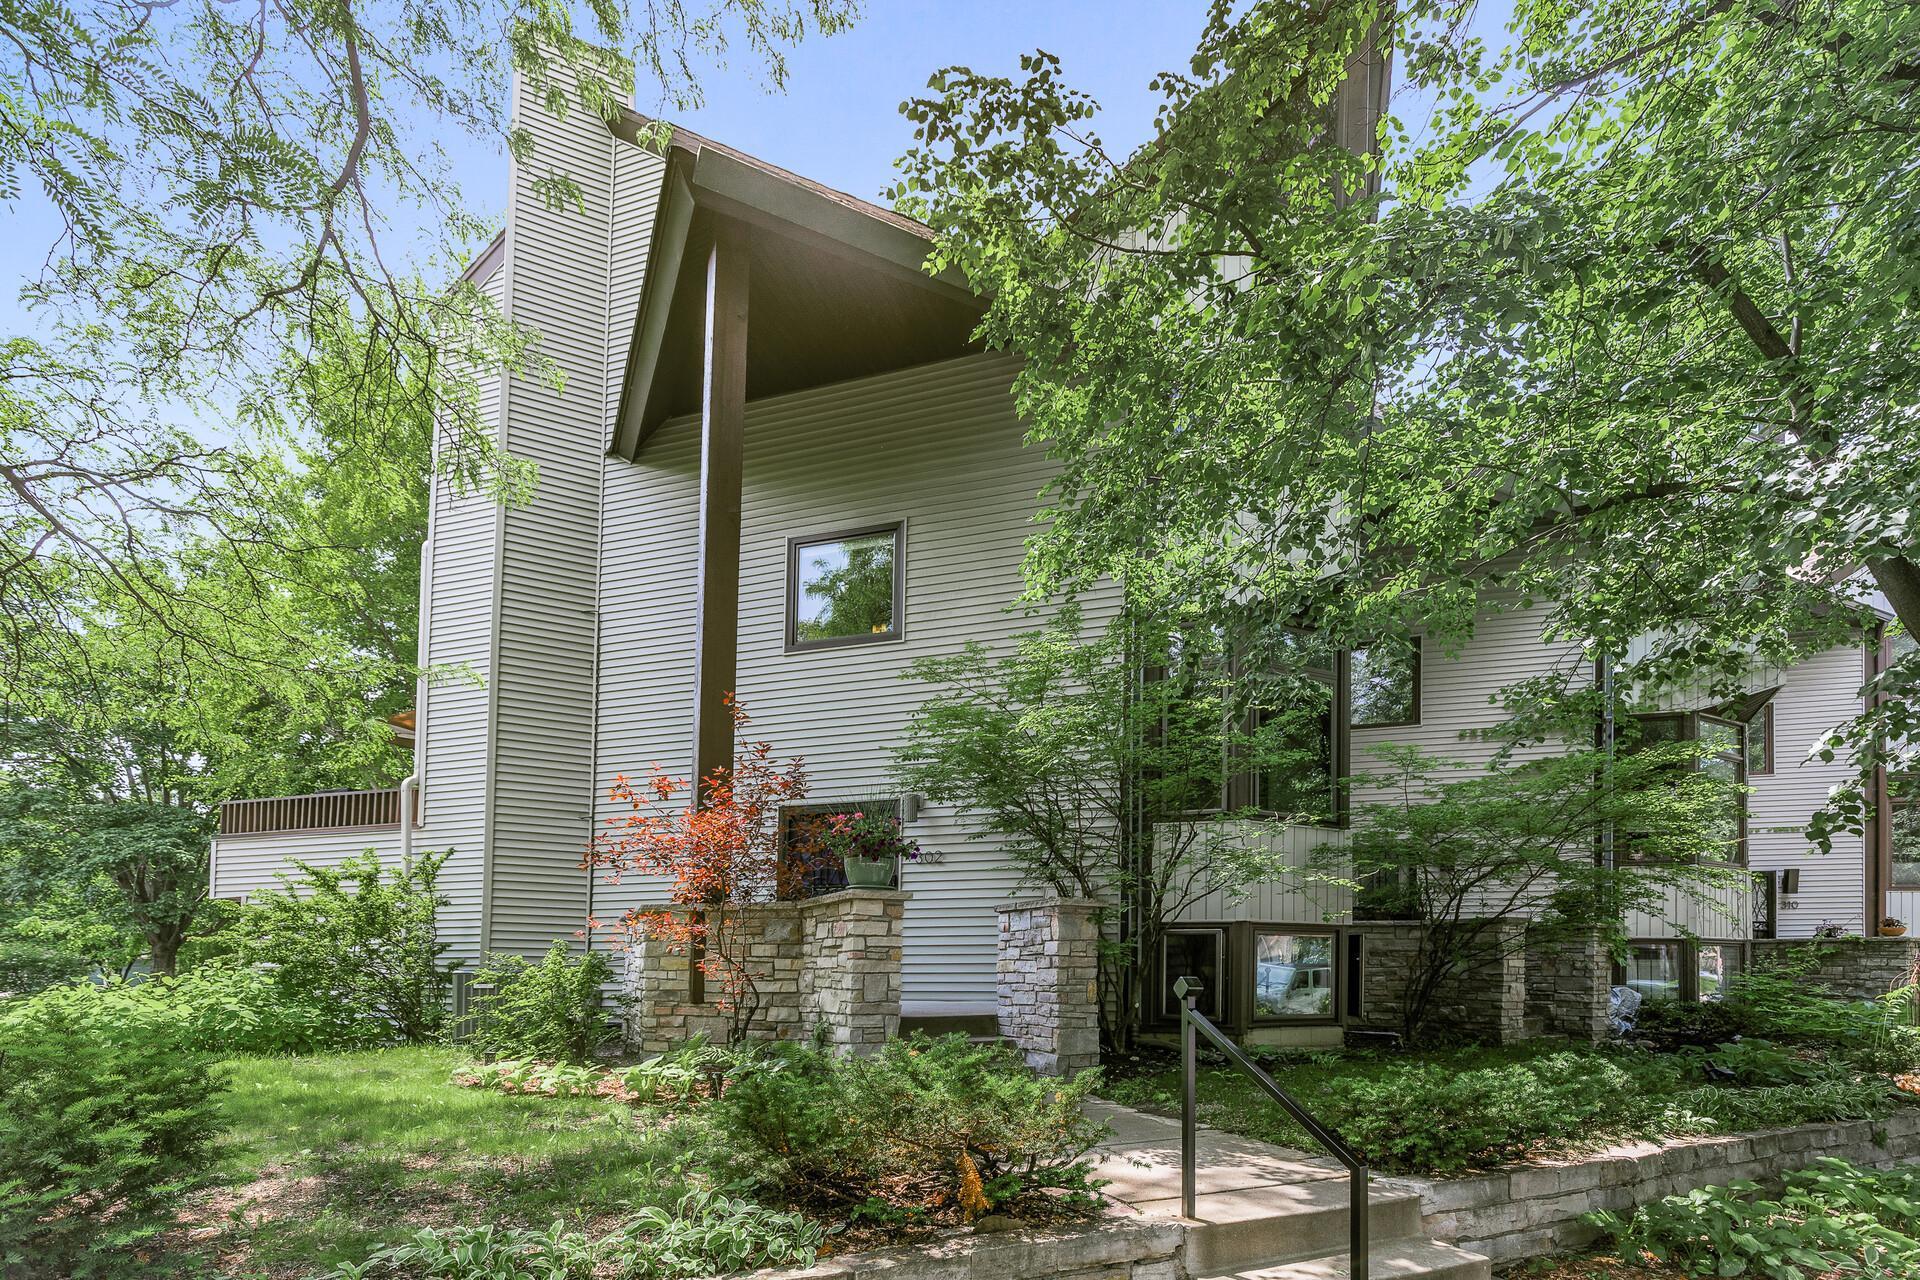
Pending
$500,000
4
bds
|
4
ba
|
2,204
sqft
|
built
1979
302 Selby Ave, Saint Paul, MN 55102
$-1,287
Cash flow
-13.4%
Cash-on-Cash Return
3.2%
Cap rate
0.6%
Rent to Value Ratio
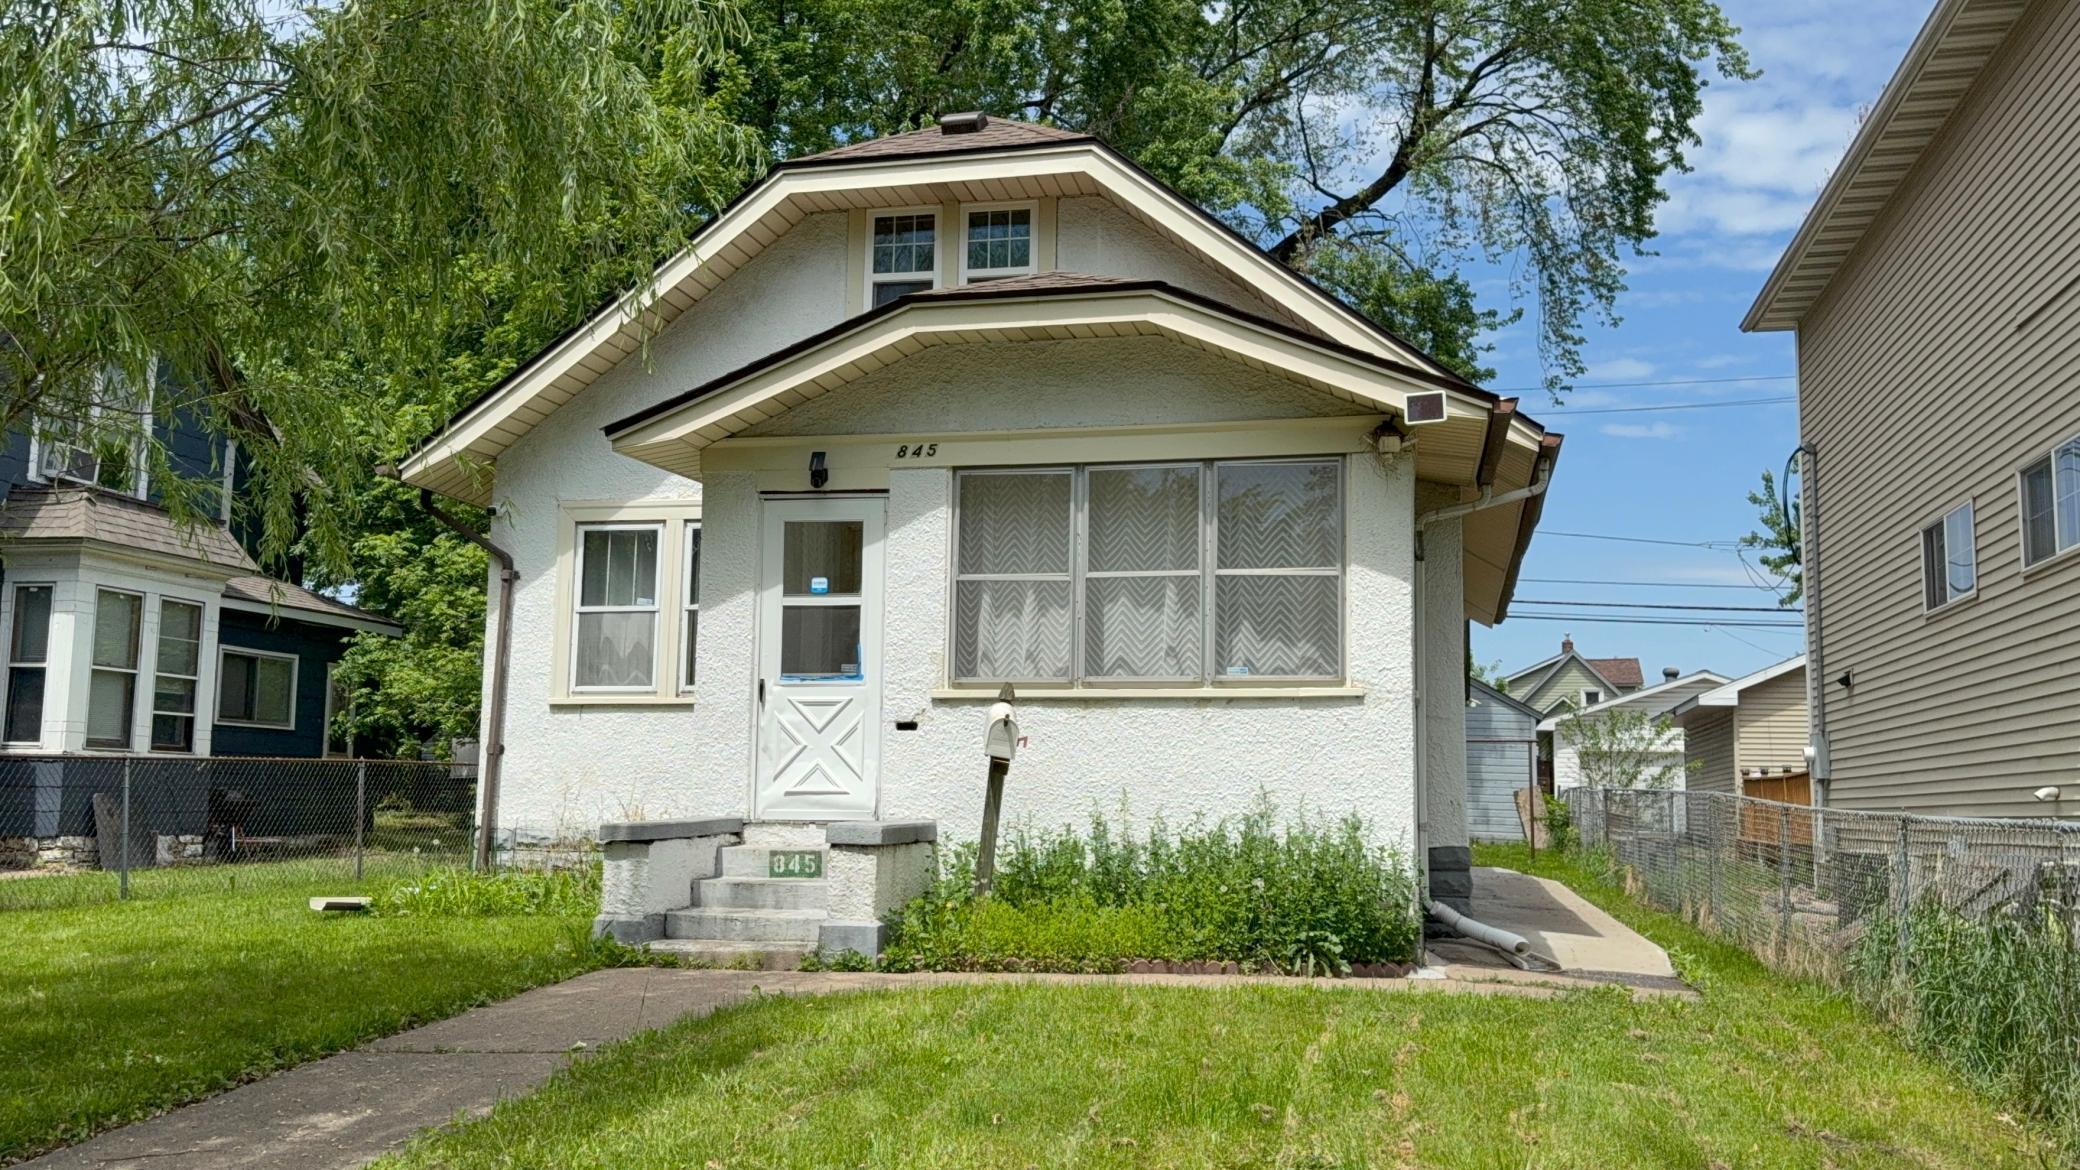
Active
$274,999
4
bds
|
2
ba
|
1,800
sqft
|
built
1926
845 Sims Ave, Saint Paul, MN 55106
$-318
Cash flow
-6.0%
Cash-on-Cash Return
4.9%
Cap rate
0.7%
Rent to Value Ratio
Active
$125,000
3
bds
|
2
ba
|
1,216
sqft
|
built
2022
217 Mayfair Rd, Saint Paul, MN 55127
$725
Cash flow
30.3%
Cash-on-Cash Return
13.2%
Cap rate
1.6%
Rent to Value Ratio