Saint Paul, MN Investment Properties for Sale
Browse homes for sale and investment properties in Saint Paul, MN. Refine your search by price, property type, or more.
Best cash flowing properties in Saint Paul, MN
Active
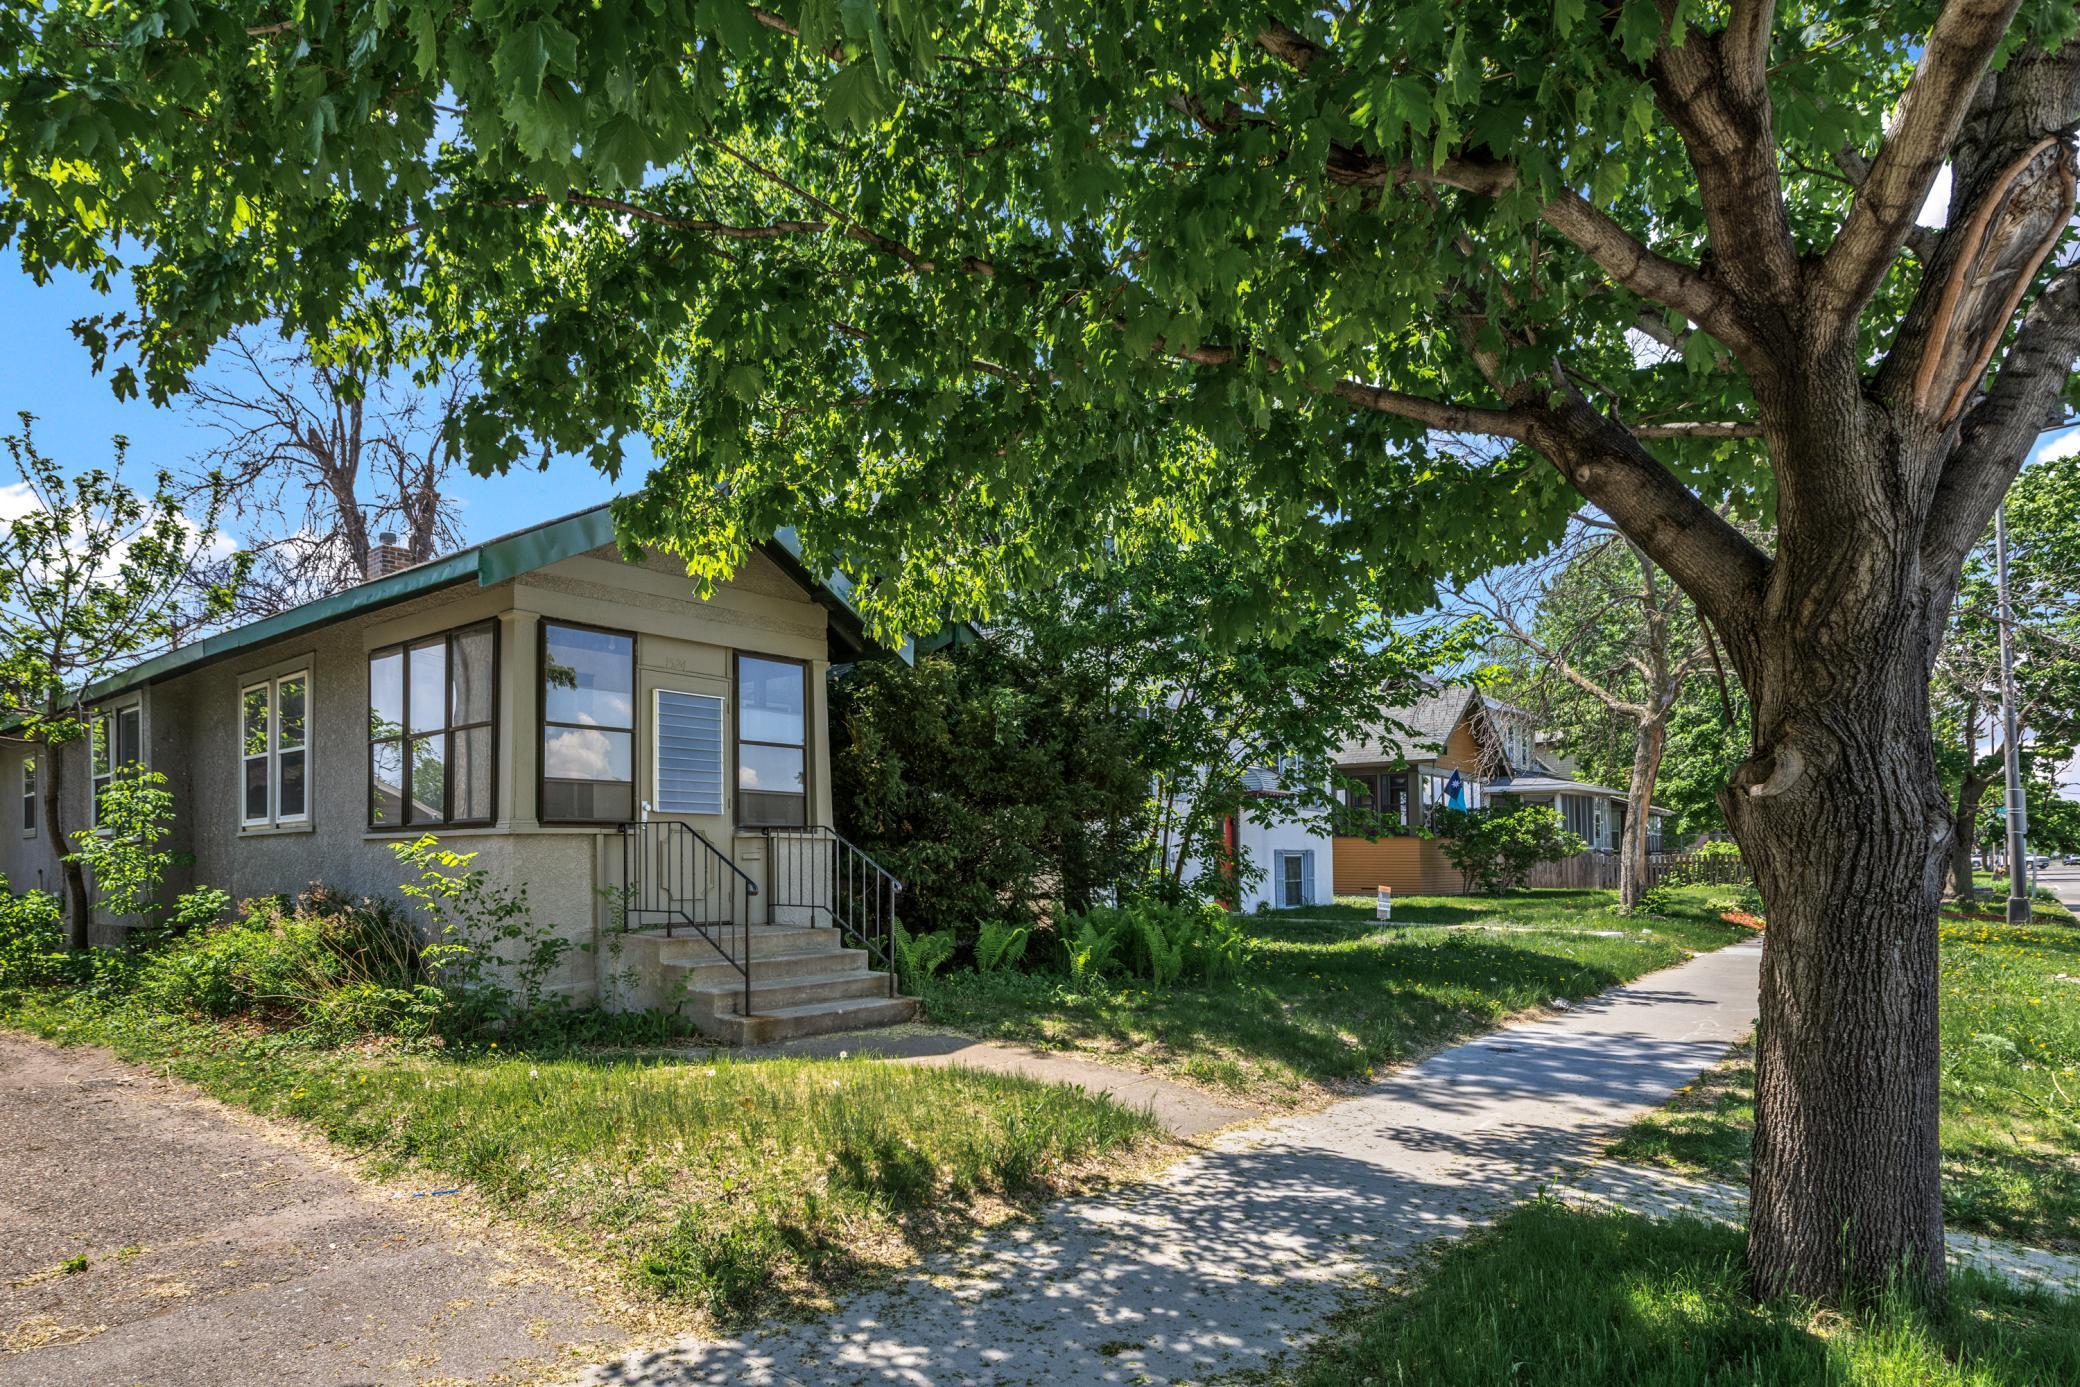
$250,000
3
bds
|
1
ba
|
1,019
sqft
|
built
1917
1524 Concordia Ave, Saint Paul, MN 55104
$125
Cash flow
2.6%
Cash-on-Cash Return
6.3%
Cap rate
0.9%
Rent to Value Ratio
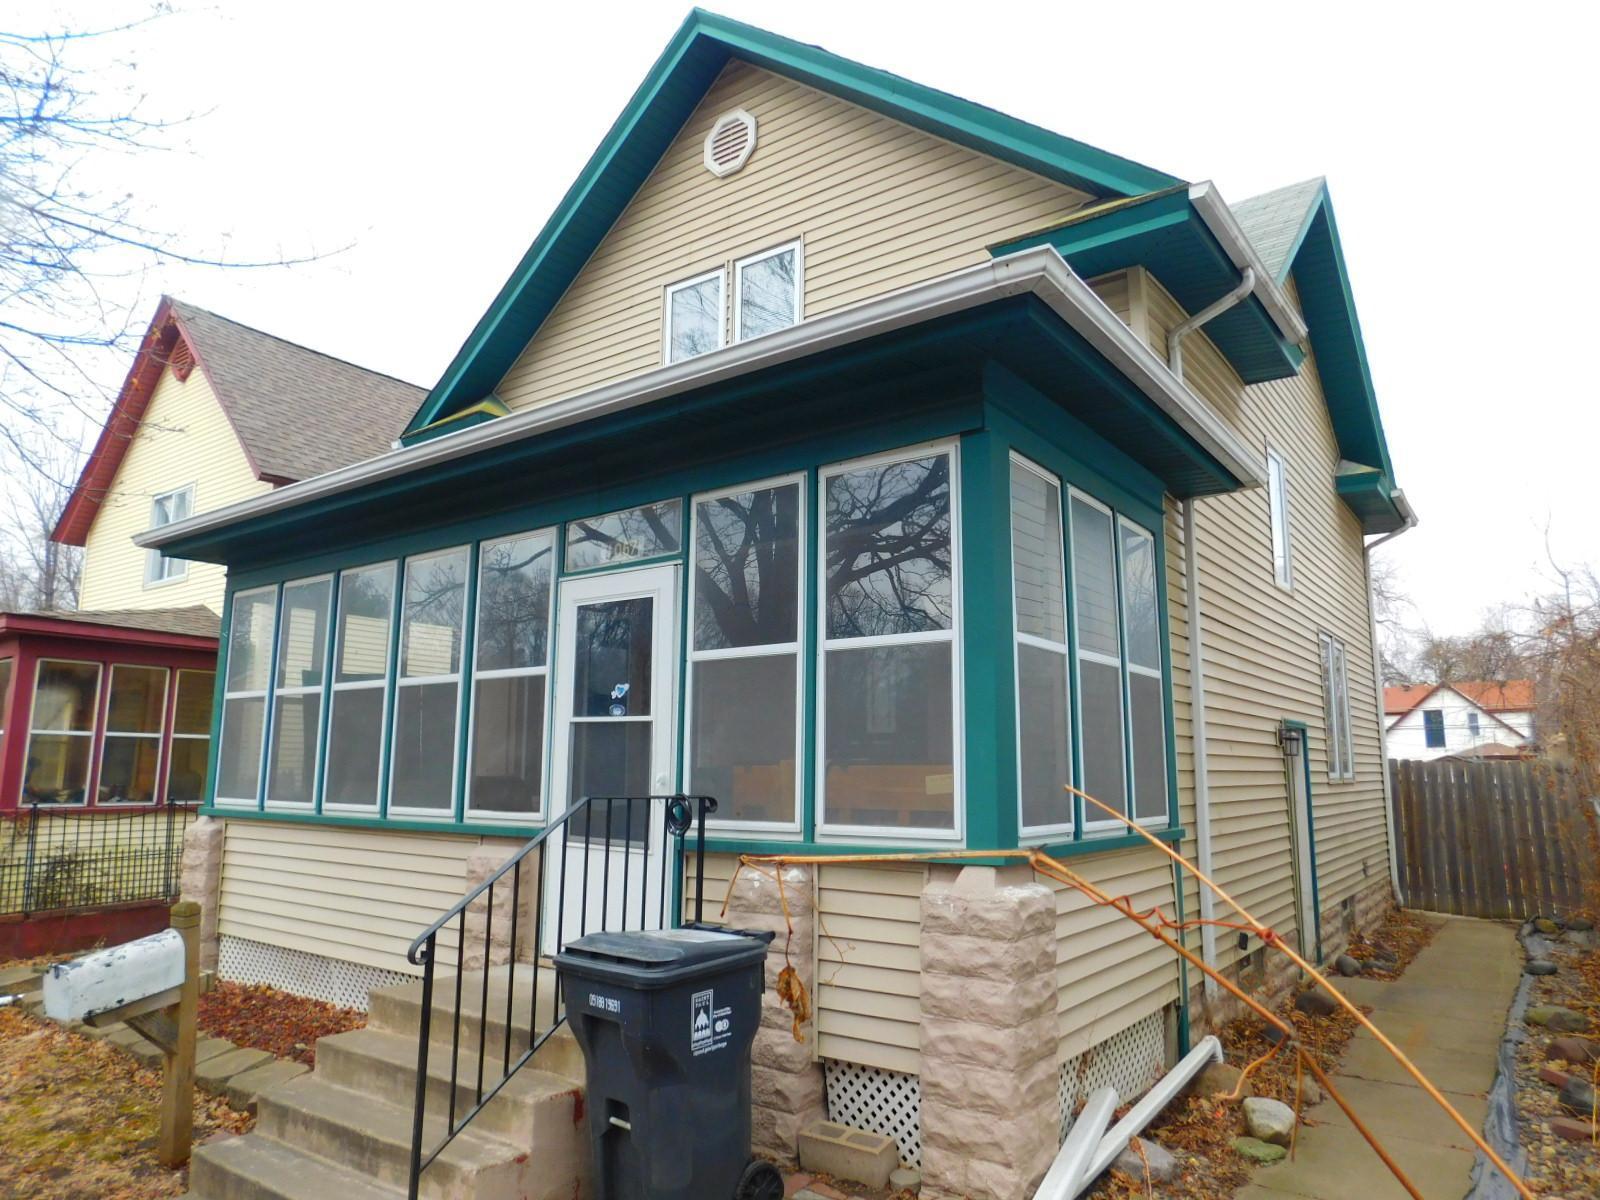
Active
$209,900
3
bds
|
1
ba
|
1,538
sqft
|
built
1900
1067 Fremont Ave, Saint Paul, MN 55106
$28
Cash flow
0.7%
Cash-on-Cash Return
5.8%
Cap rate
1.0%
Rent to Value Ratio
609 out of 705 properties for sale in Saint Paul, MN
Limited Results Shown
Create a free account, or log in to reveal all property listings and enjoy the complete experience.
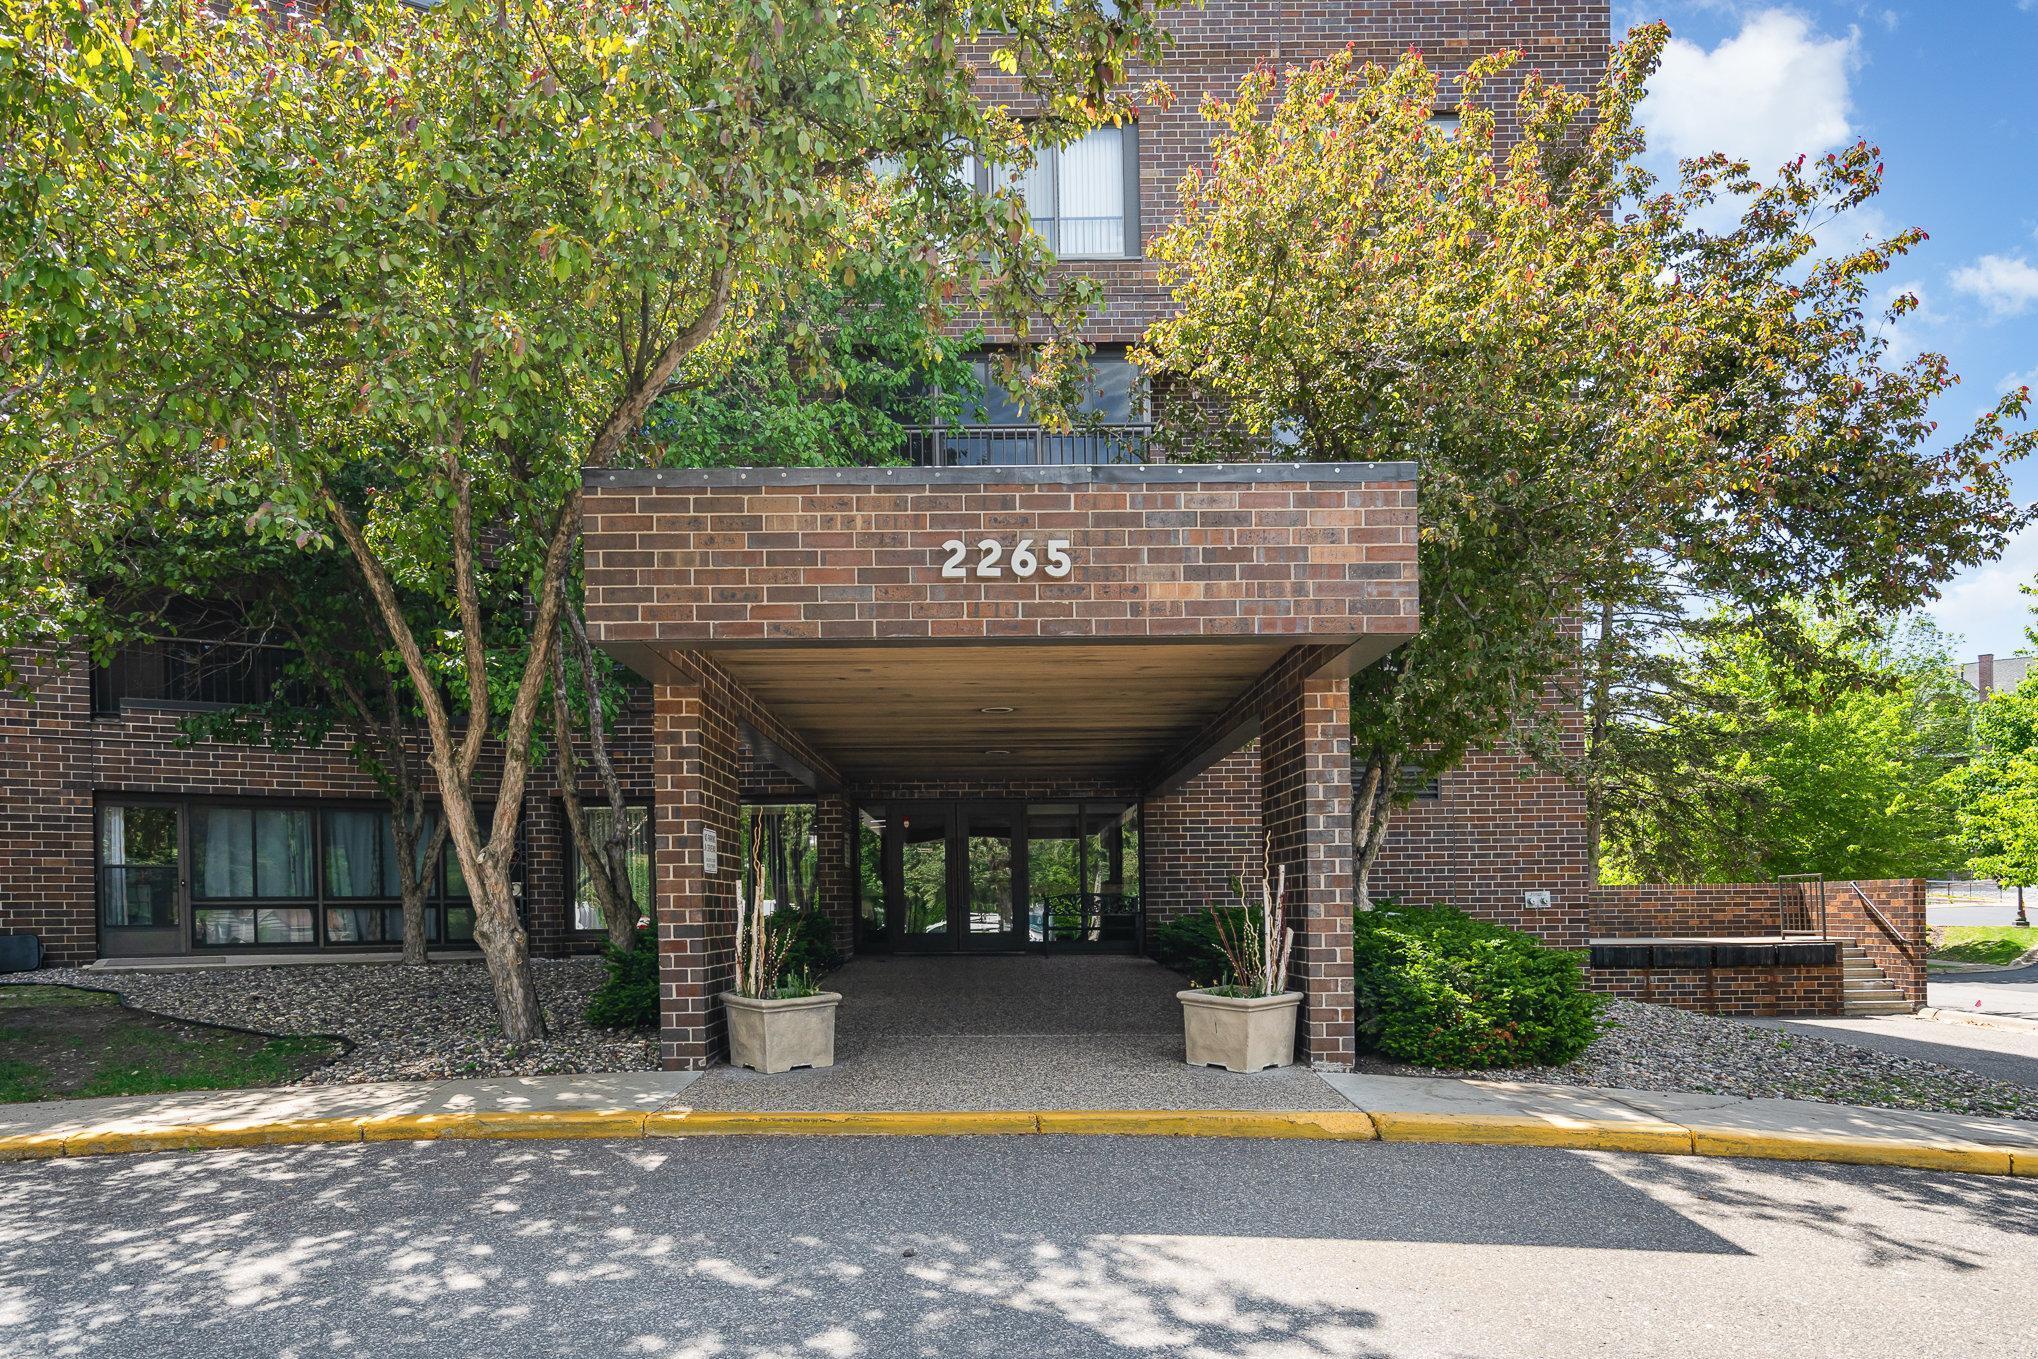
Pending
$204,900
2
bds
|
2
ba
|
1,355
sqft
|
built
1980
2265 Youngman Ave, Saint Paul, MN 55116
$-424
Cash flow
-10.8%
Cash-on-Cash Return
3.2%
Cap rate
1.1%
Rent to Value Ratio
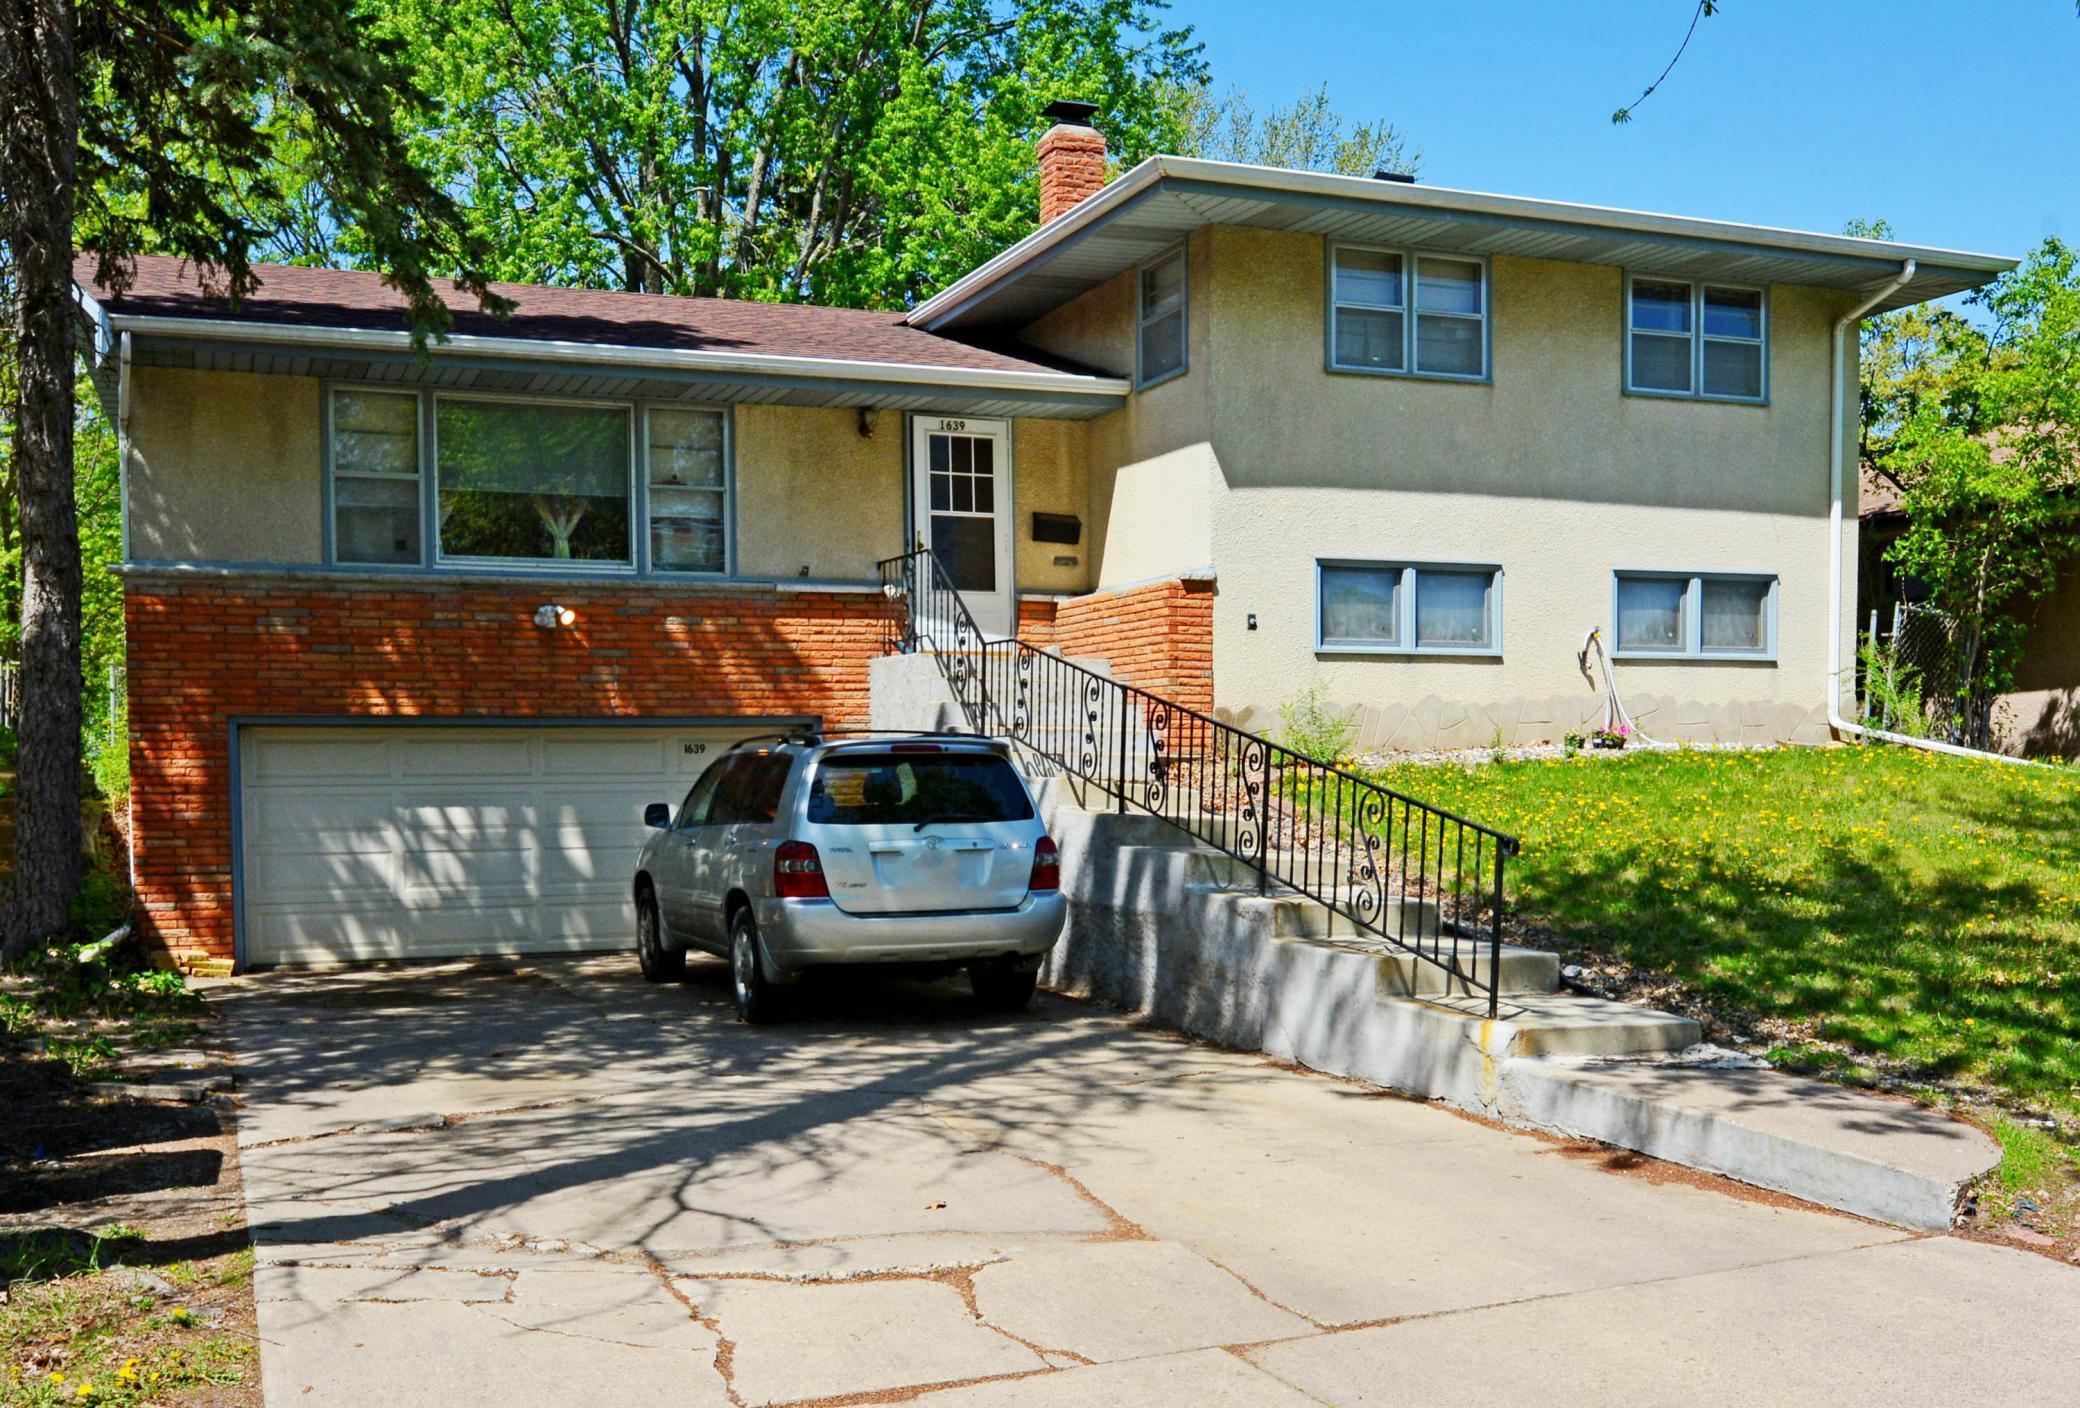
Active
$340,000
3
bds
|
2
ba
|
1,788
sqft
|
built
1959
1639 Clarence St, Saint Paul, MN 55106
$-91
Cash flow
-1.4%
Cash-on-Cash Return
5.4%
Cap rate
0.6%
Rent to Value Ratio

Active
$299,900
2
bds
|
2
ba
|
1,208
sqft
|
built
1896
350 Saint Peter St, Saint Paul, MN 55102
$-723
Cash flow
-12.6%
Cash-on-Cash Return
2.8%
Cap rate
0.9%
Rent to Value Ratio
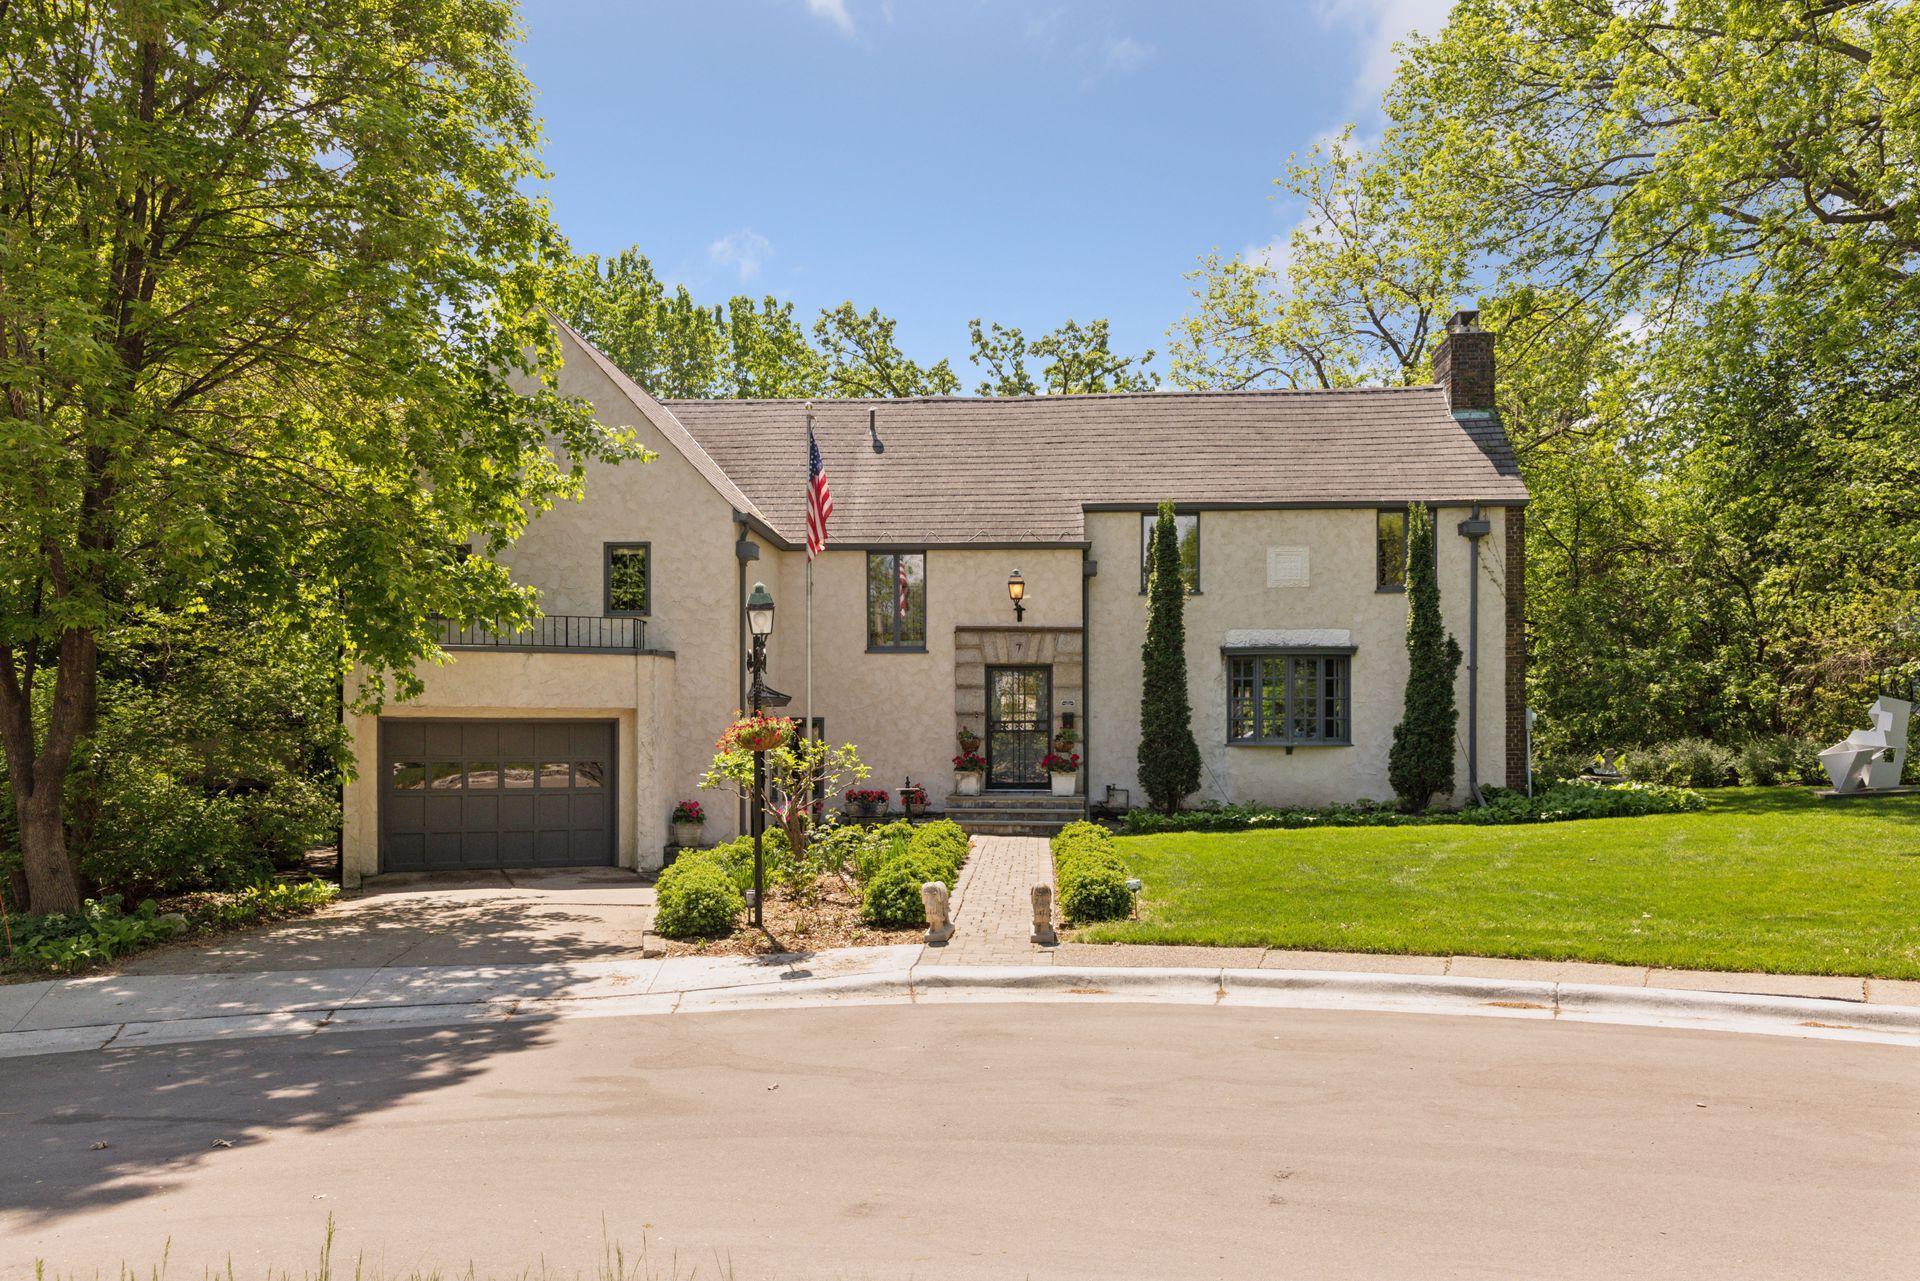
Active
$799,900
4
bds
|
4
ba
|
3,661
sqft
|
built
1928
7 Montcalm Ct, Saint Paul, MN 55116
$-2,153
Cash flow
-14.0%
Cash-on-Cash Return
2.4%
Cap rate
0.6%
Rent to Value Ratio
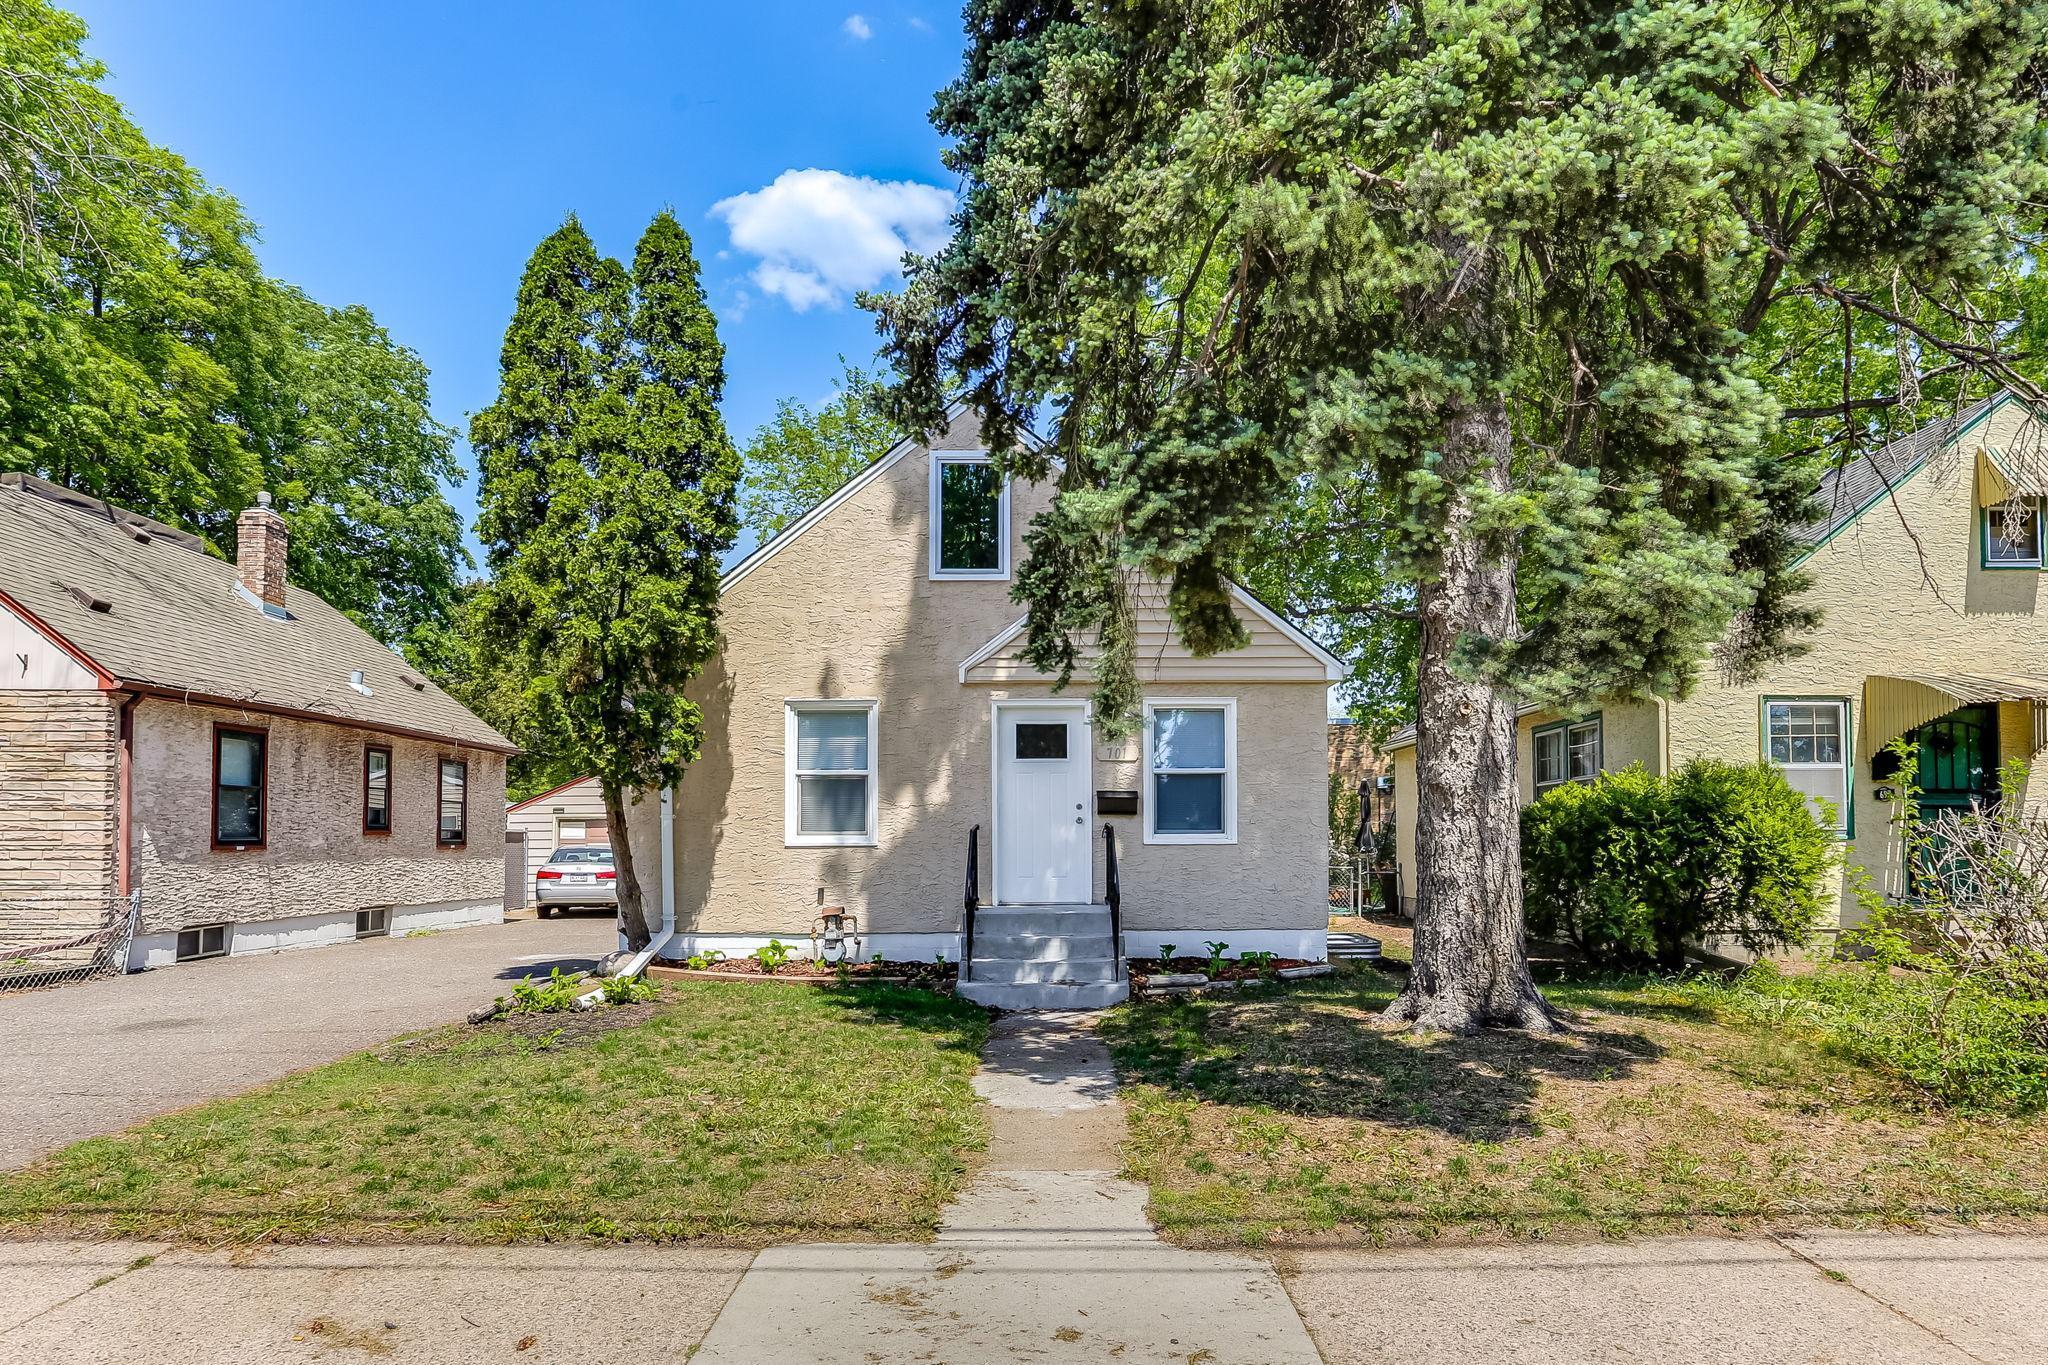
Pending
$315,000
4
bds
|
3
ba
|
1,570
sqft
|
built
1947
701 Front Ave, Saint Paul, MN 55103
$-488
Cash flow
-8.1%
Cash-on-Cash Return
3.8%
Cap rate
0.6%
Rent to Value Ratio
Active
$250,000
3
bds
|
1
ba
|
1,019
sqft
|
built
1917
1524 Concordia Ave, Saint Paul, MN 55104
$125
Cash flow
2.6%
Cash-on-Cash Return
6.3%
Cap rate
0.9%
Rent to Value Ratio
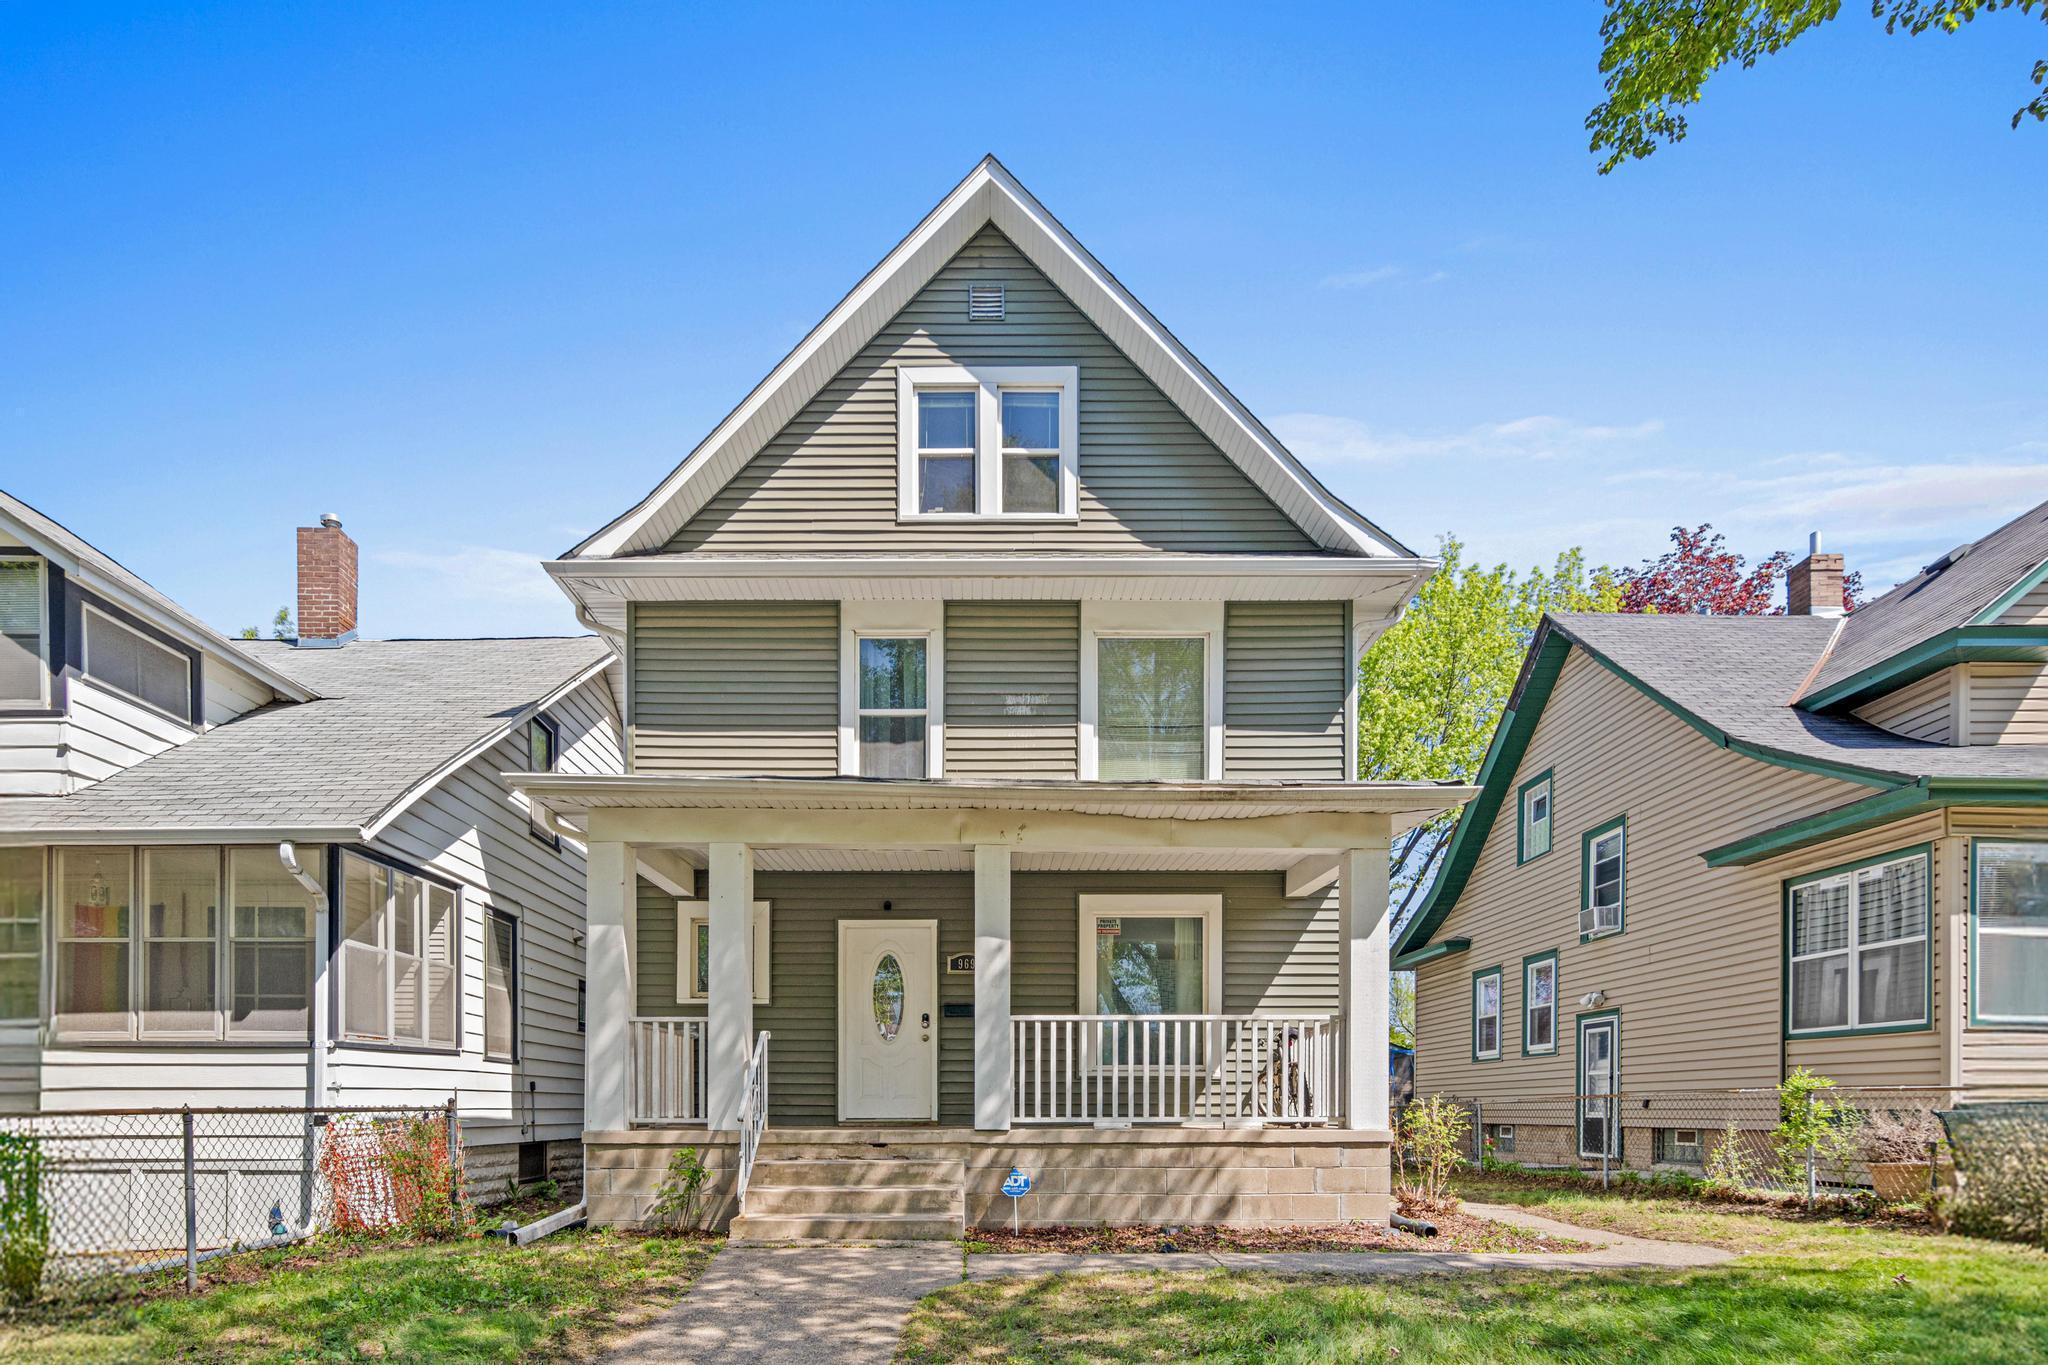
Active
$365,000
5
bds
|
3
ba
|
2,736
sqft
|
built
1908
969 Carroll Ave, Saint Paul, MN 55104
$-343
Cash flow
-4.9%
Cash-on-Cash Return
4.6%
Cap rate
0.8%
Rent to Value Ratio
Active
$794,900
4
bds
|
4
ba
|
2,052
sqft
|
built
2022
870 Mount Curve Blvd, Saint Paul, MN 55116
$-2,095
Cash flow
-13.8%
Cash-on-Cash Return
2.5%
Cap rate
0.6%
Rent to Value Ratio
Active
$570,000
4
bds
|
3
ba
|
2,449
sqft
|
built
1891
794 Laurel Ave, Saint Paul, MN 55104
$-950
Cash flow
-8.7%
Cash-on-Cash Return
3.7%
Cap rate
0.6%
Rent to Value Ratio
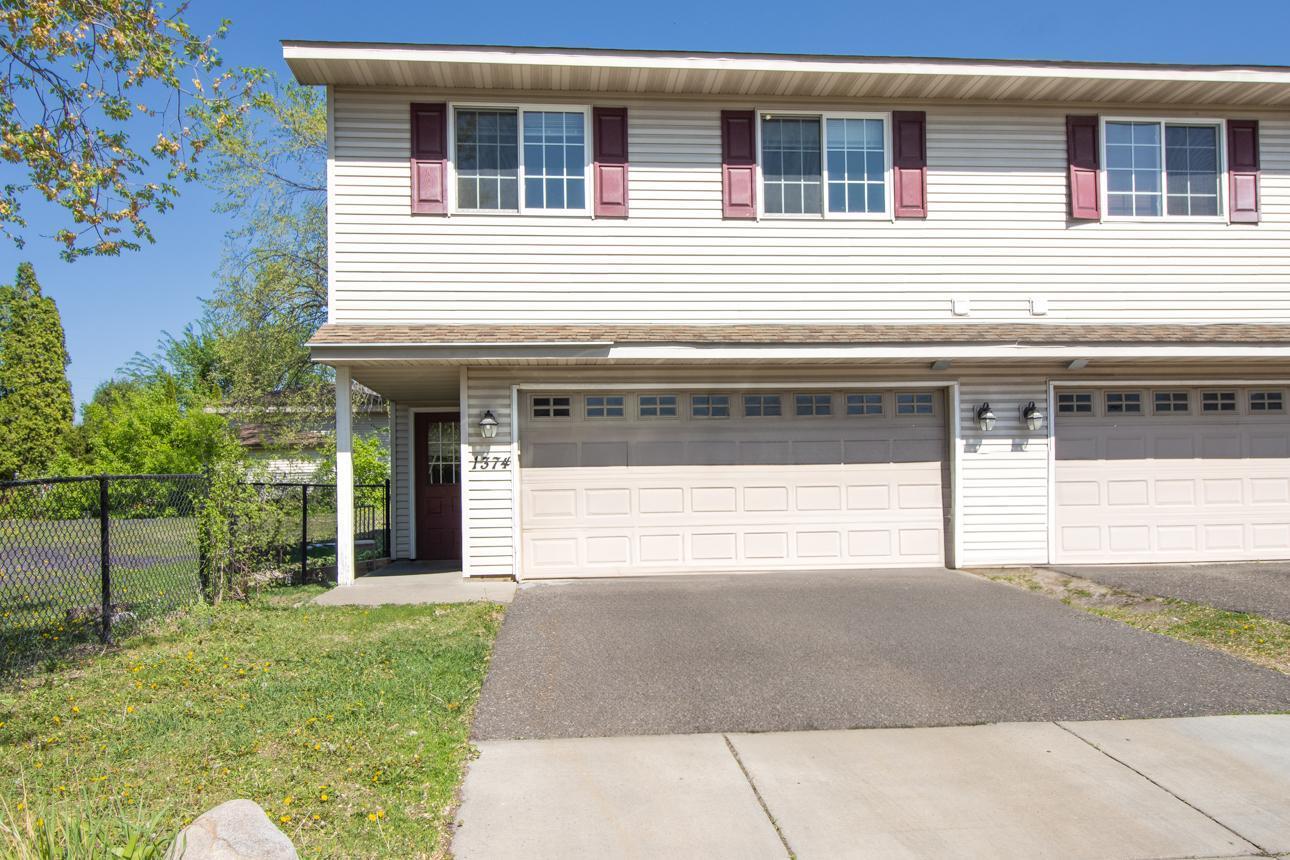
Active
$212,500
3
bds
|
2
ba
|
1,365
sqft
|
built
2004
1374 Farrington St, Saint Paul, MN 55117
$-178
Cash flow
-4.4%
Cash-on-Cash Return
4.7%
Cap rate
0.9%
Rent to Value Ratio
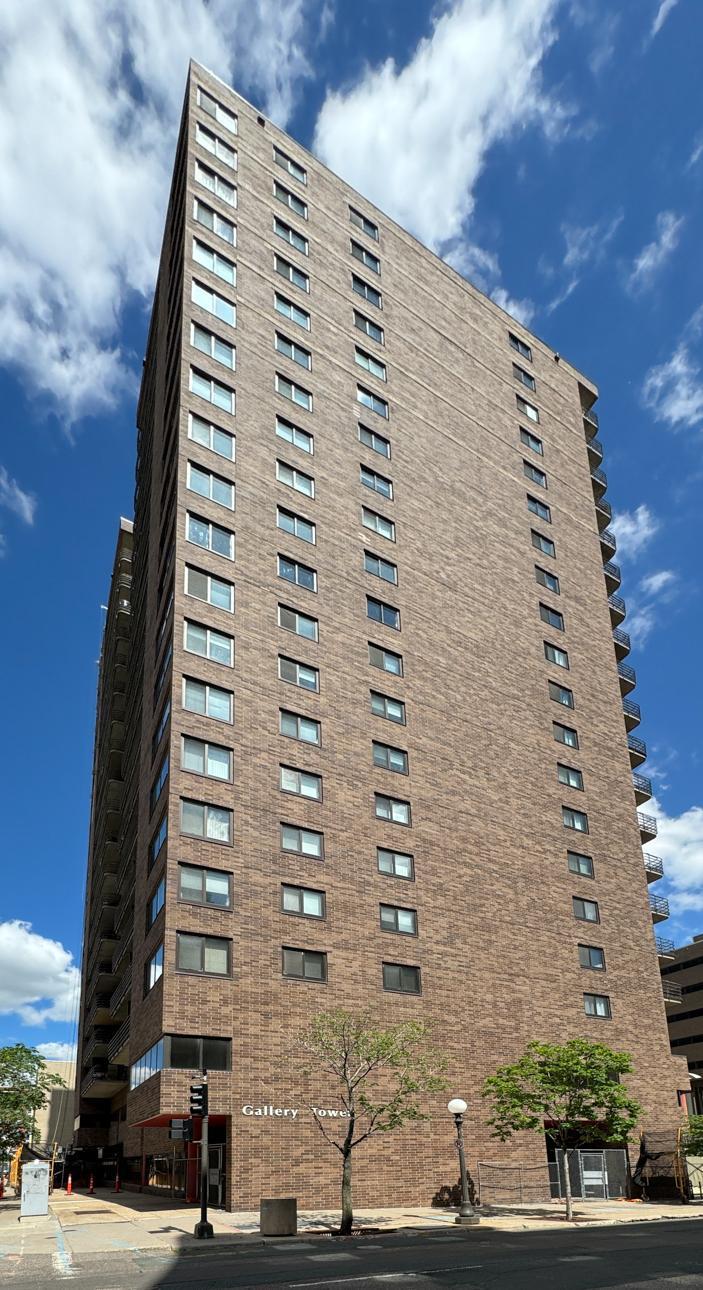
Active
$121,500
1
bds
|
1
ba
|
810
sqft
|
built
1980
26 10th St W, Saint Paul, MN 55102
$-352
Cash flow
-15.1%
Cash-on-Cash Return
2.2%
Cap rate
1.2%
Rent to Value Ratio
Active
$209,900
3
bds
|
1
ba
|
1,538
sqft
|
built
1900
1067 Fremont Ave, Saint Paul, MN 55106
$28
Cash flow
0.7%
Cash-on-Cash Return
5.8%
Cap rate
1.0%
Rent to Value Ratio
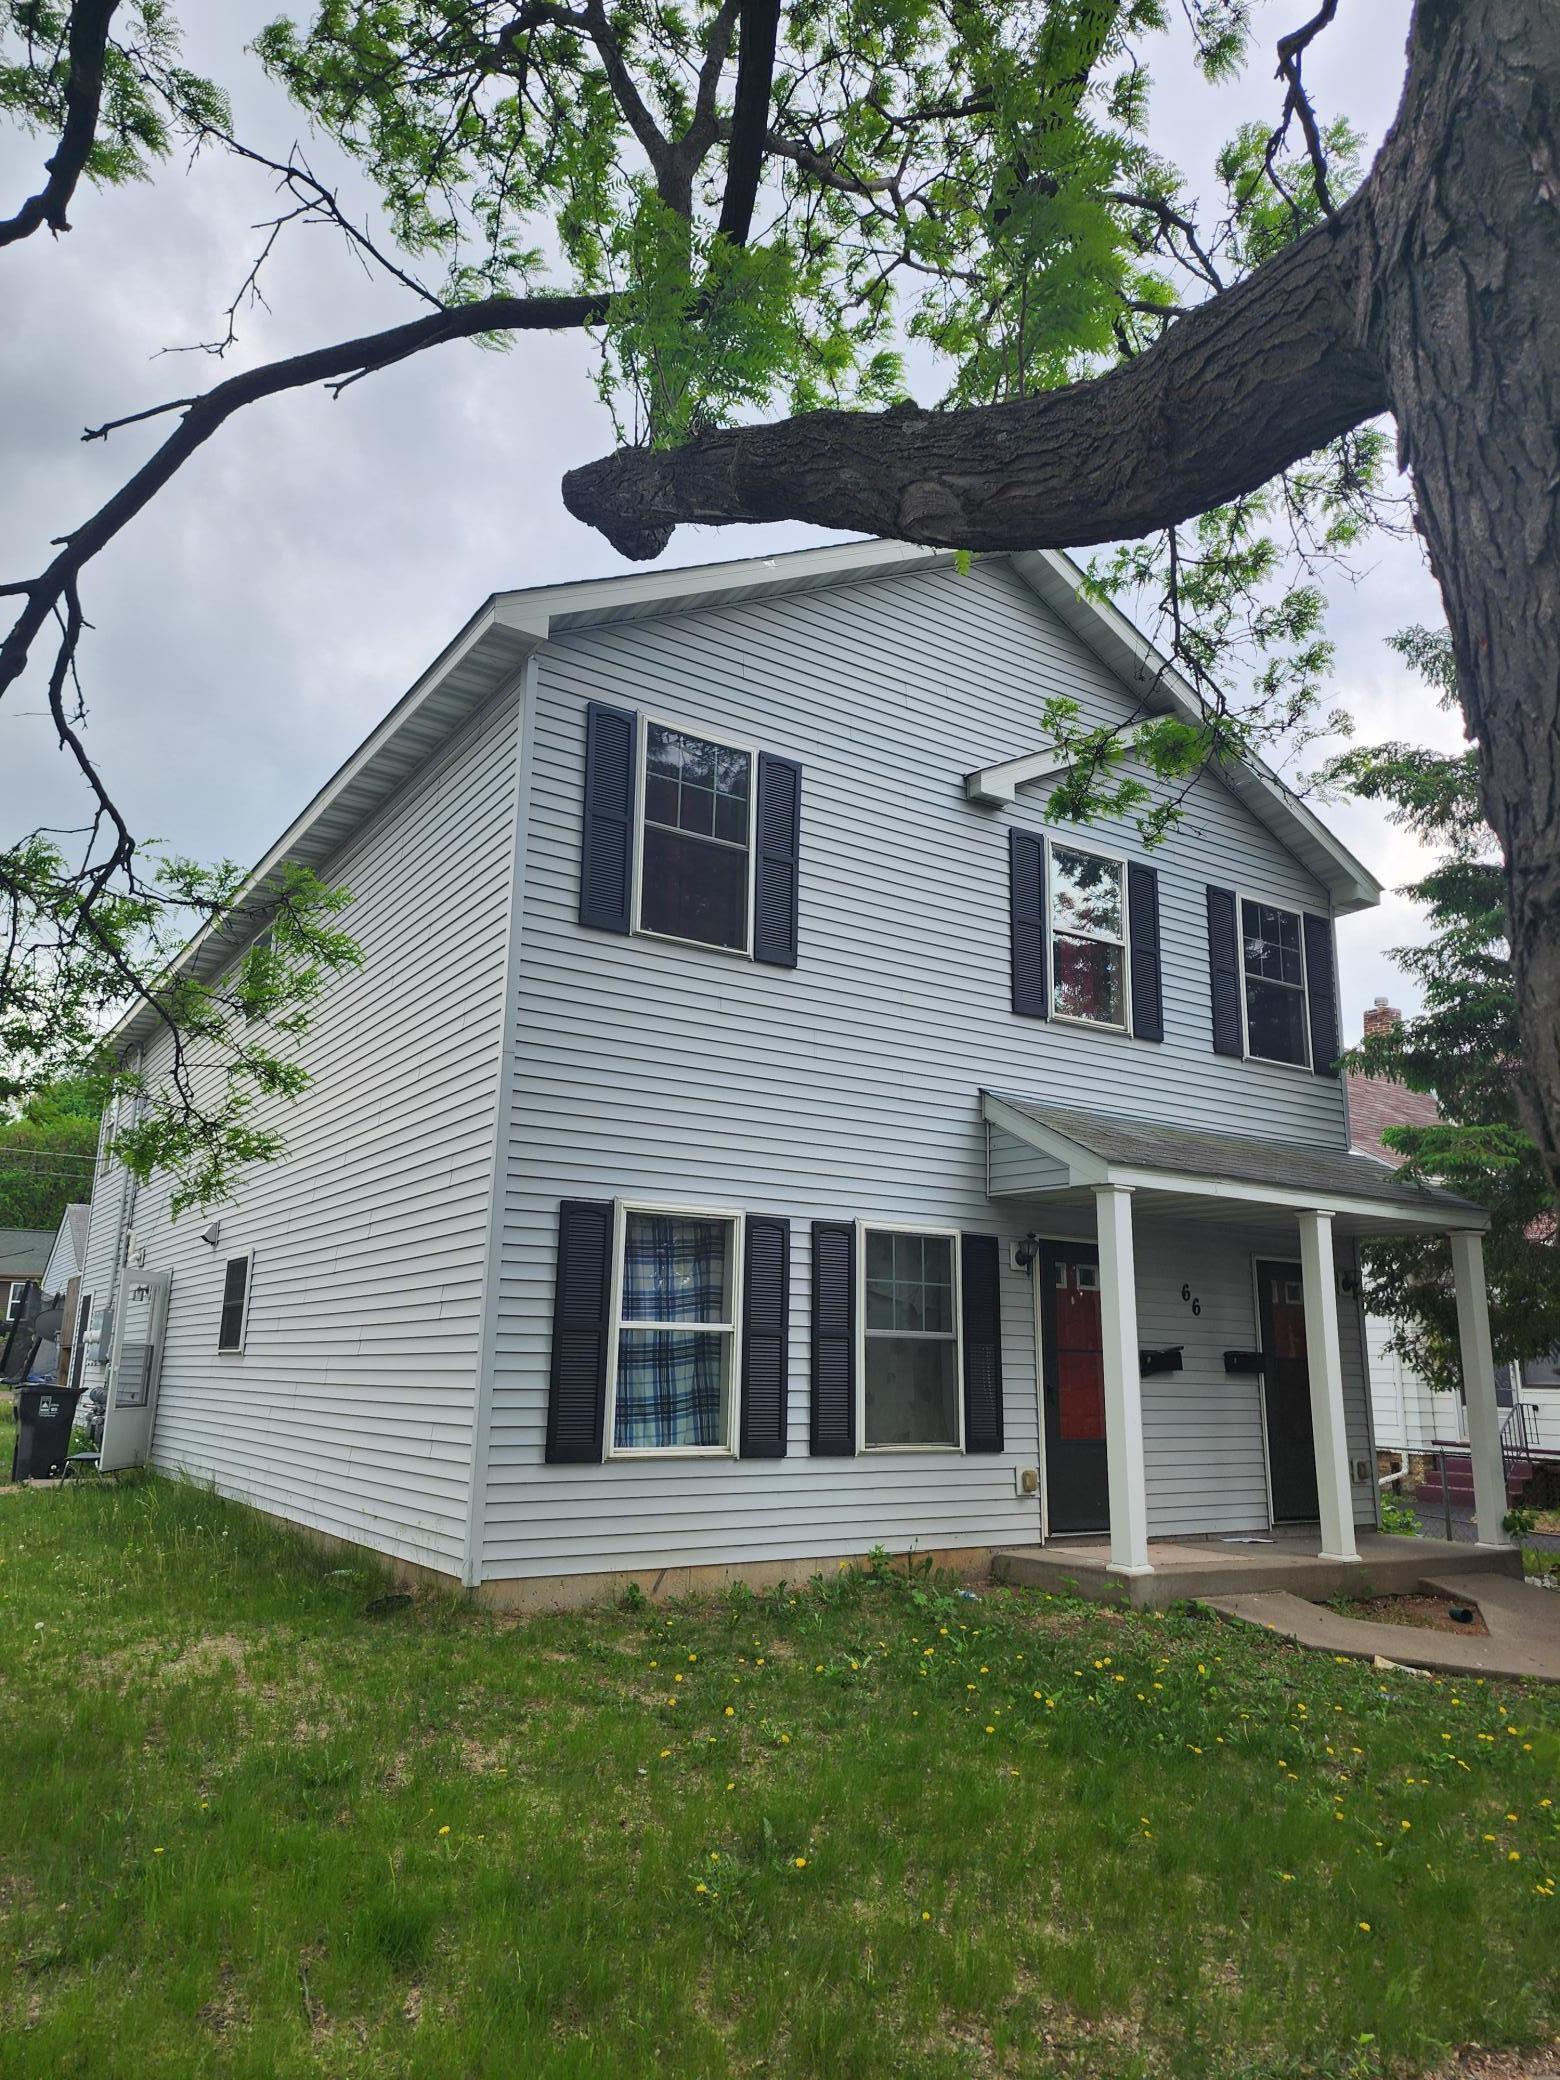
Active
$424,999
6
bds
|
2
ba
|
2,704
sqft
|
built
2008
66 Stevens St E, Saint Paul, MN 55107
$-1,185
Cash flow
-14.5%
Cash-on-Cash Return
2.3%
Cap rate
0.5%
Rent to Value Ratio
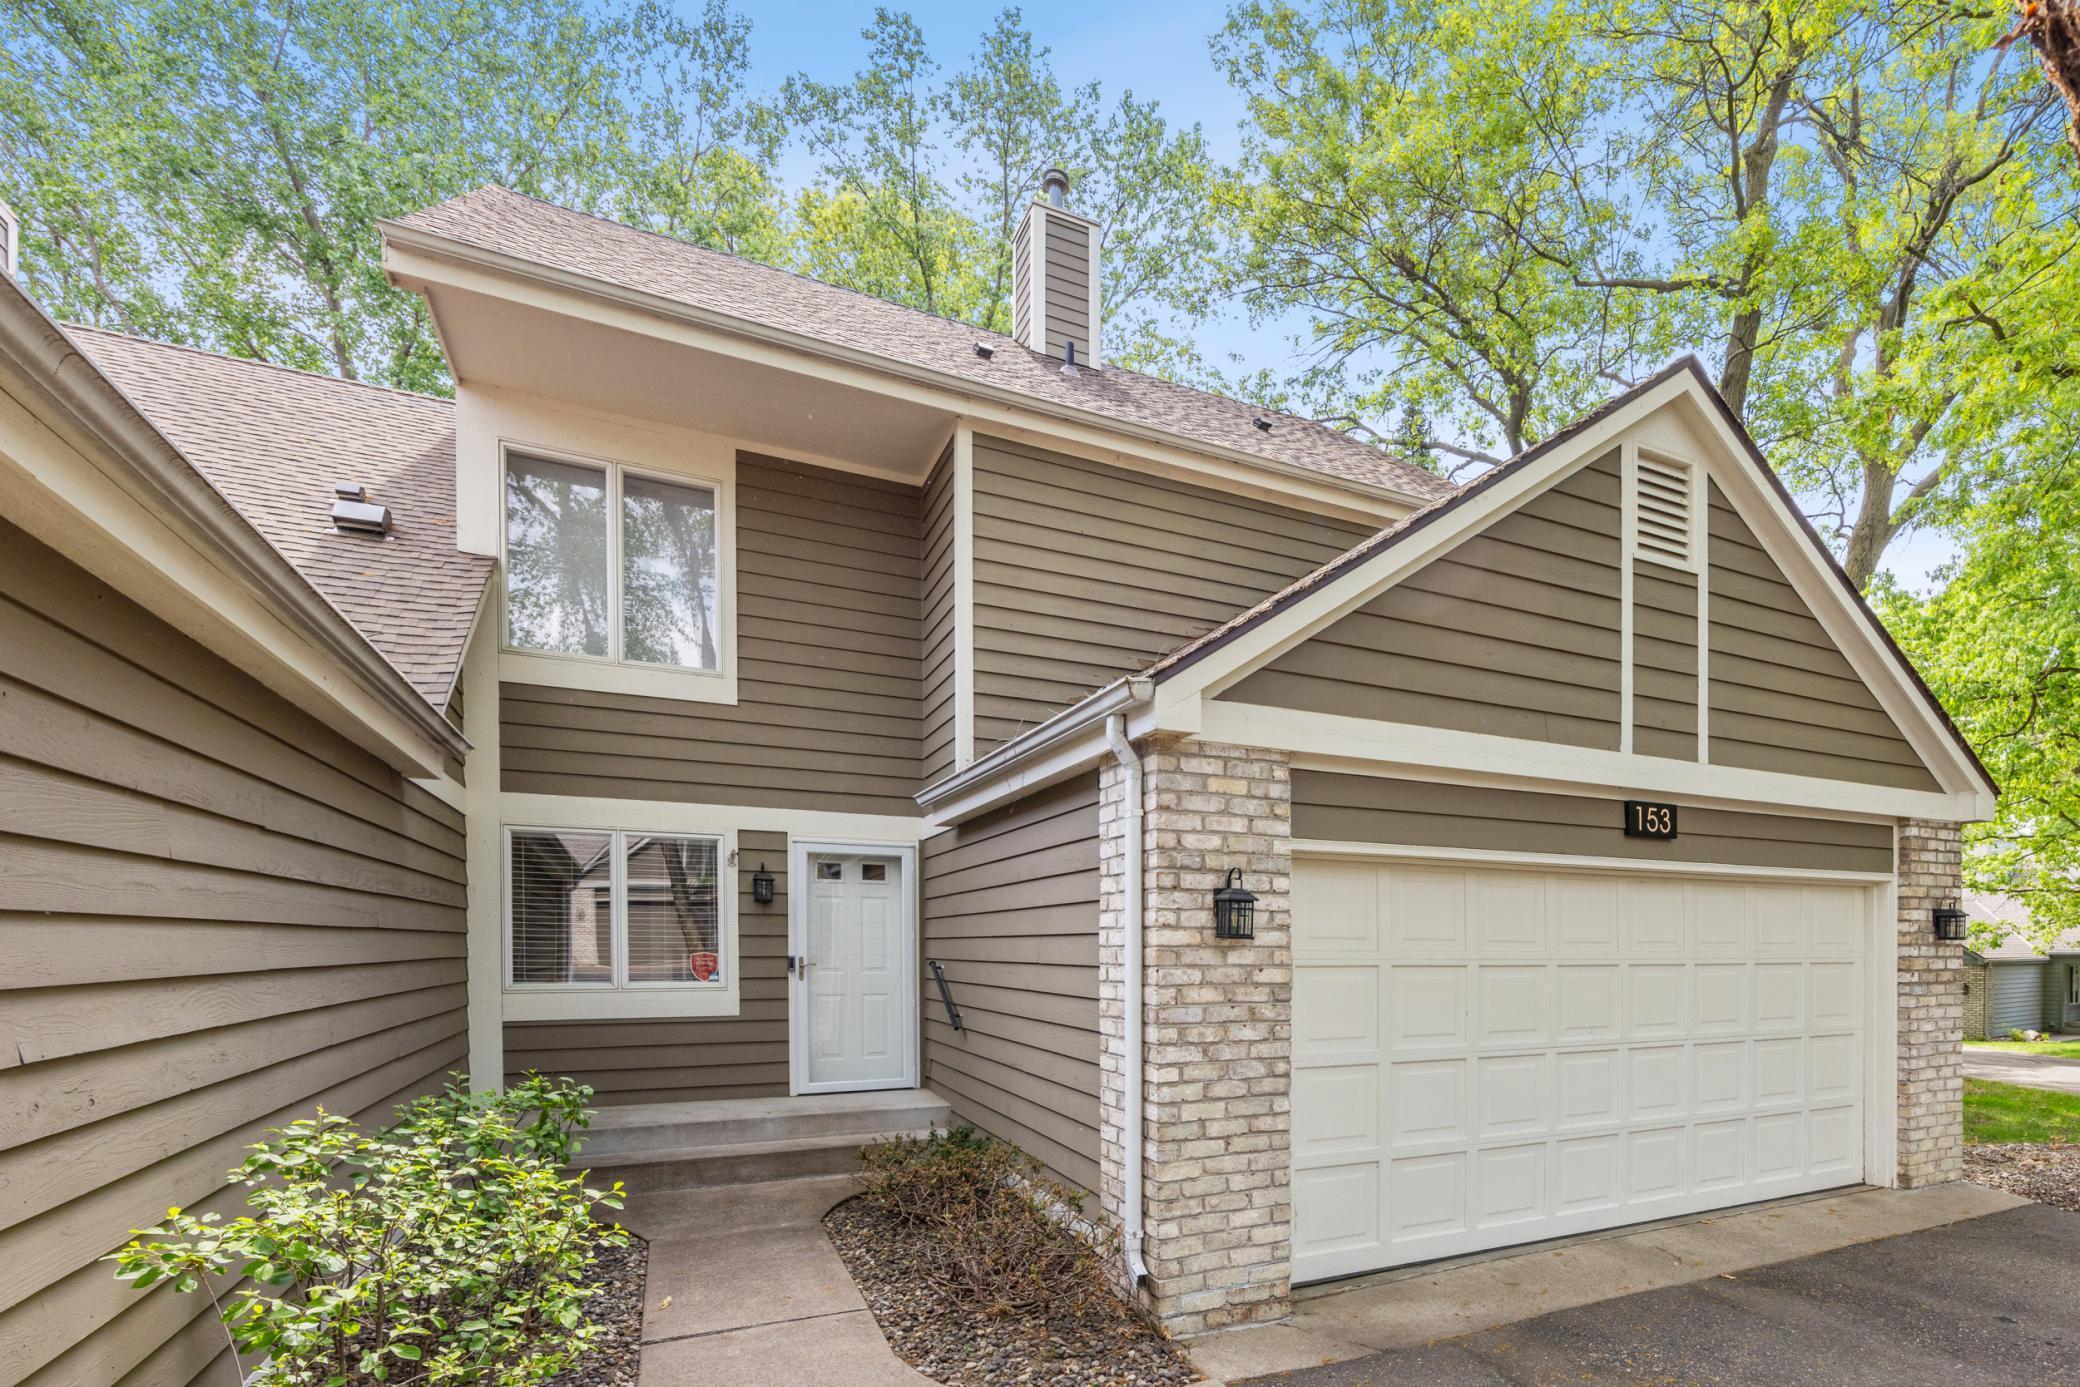
Active
$475,000
3
bds
|
4
ba
|
2,316
sqft
|
built
1986
153 Wildwood Bay Dr, Saint Paul, MN 55115
$-1,024
Cash flow
-11.2%
Cash-on-Cash Return
3.1%
Cap rate
0.7%
Rent to Value Ratio
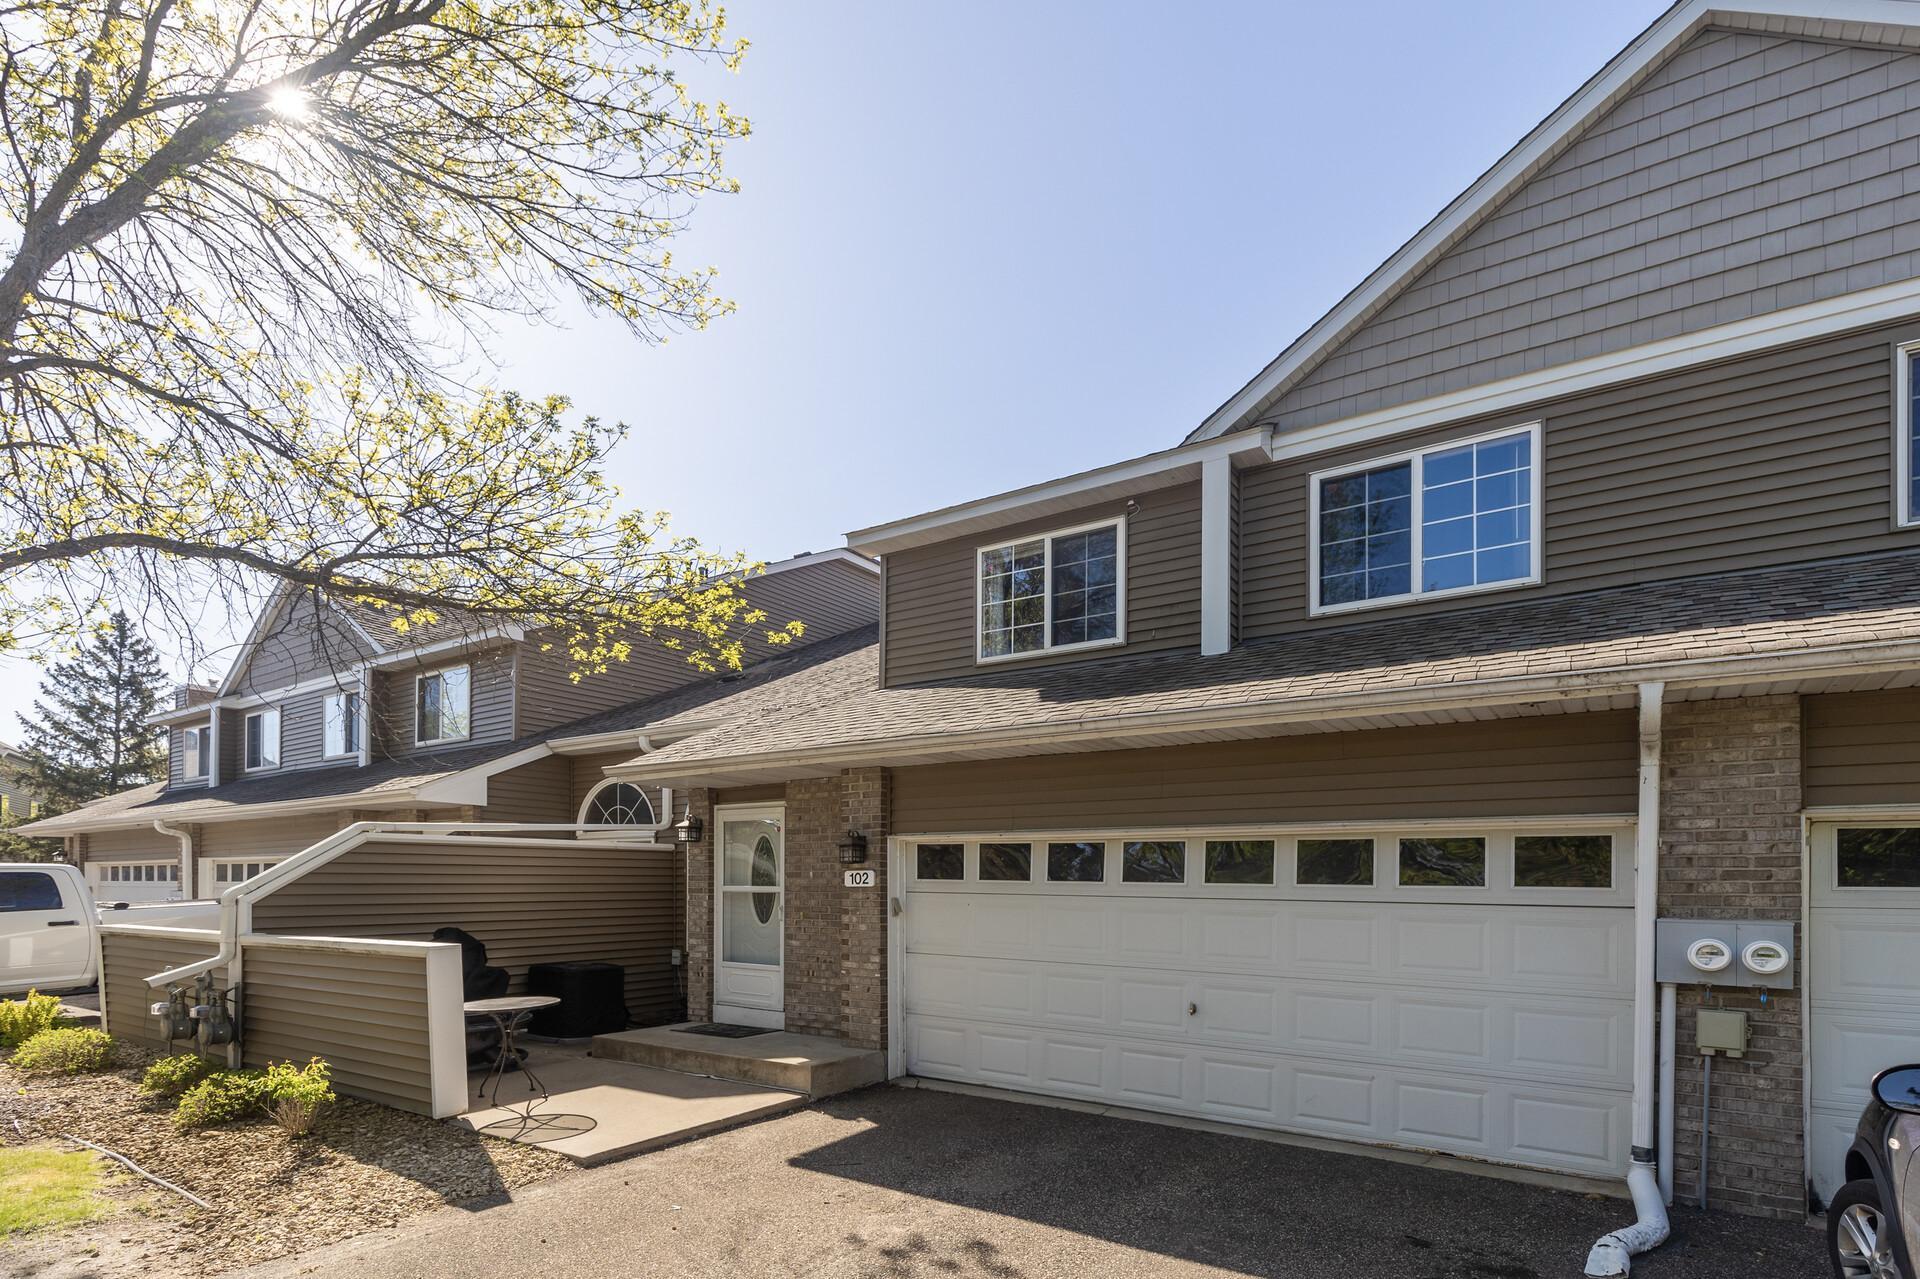
Active
$269,900
3
bds
|
3
ba
|
1,650
sqft
|
built
1993
102 Primrose Ct, Saint Paul, MN 55127
$-187
Cash flow
-3.6%
Cash-on-Cash Return
4.8%
Cap rate
0.9%
Rent to Value Ratio
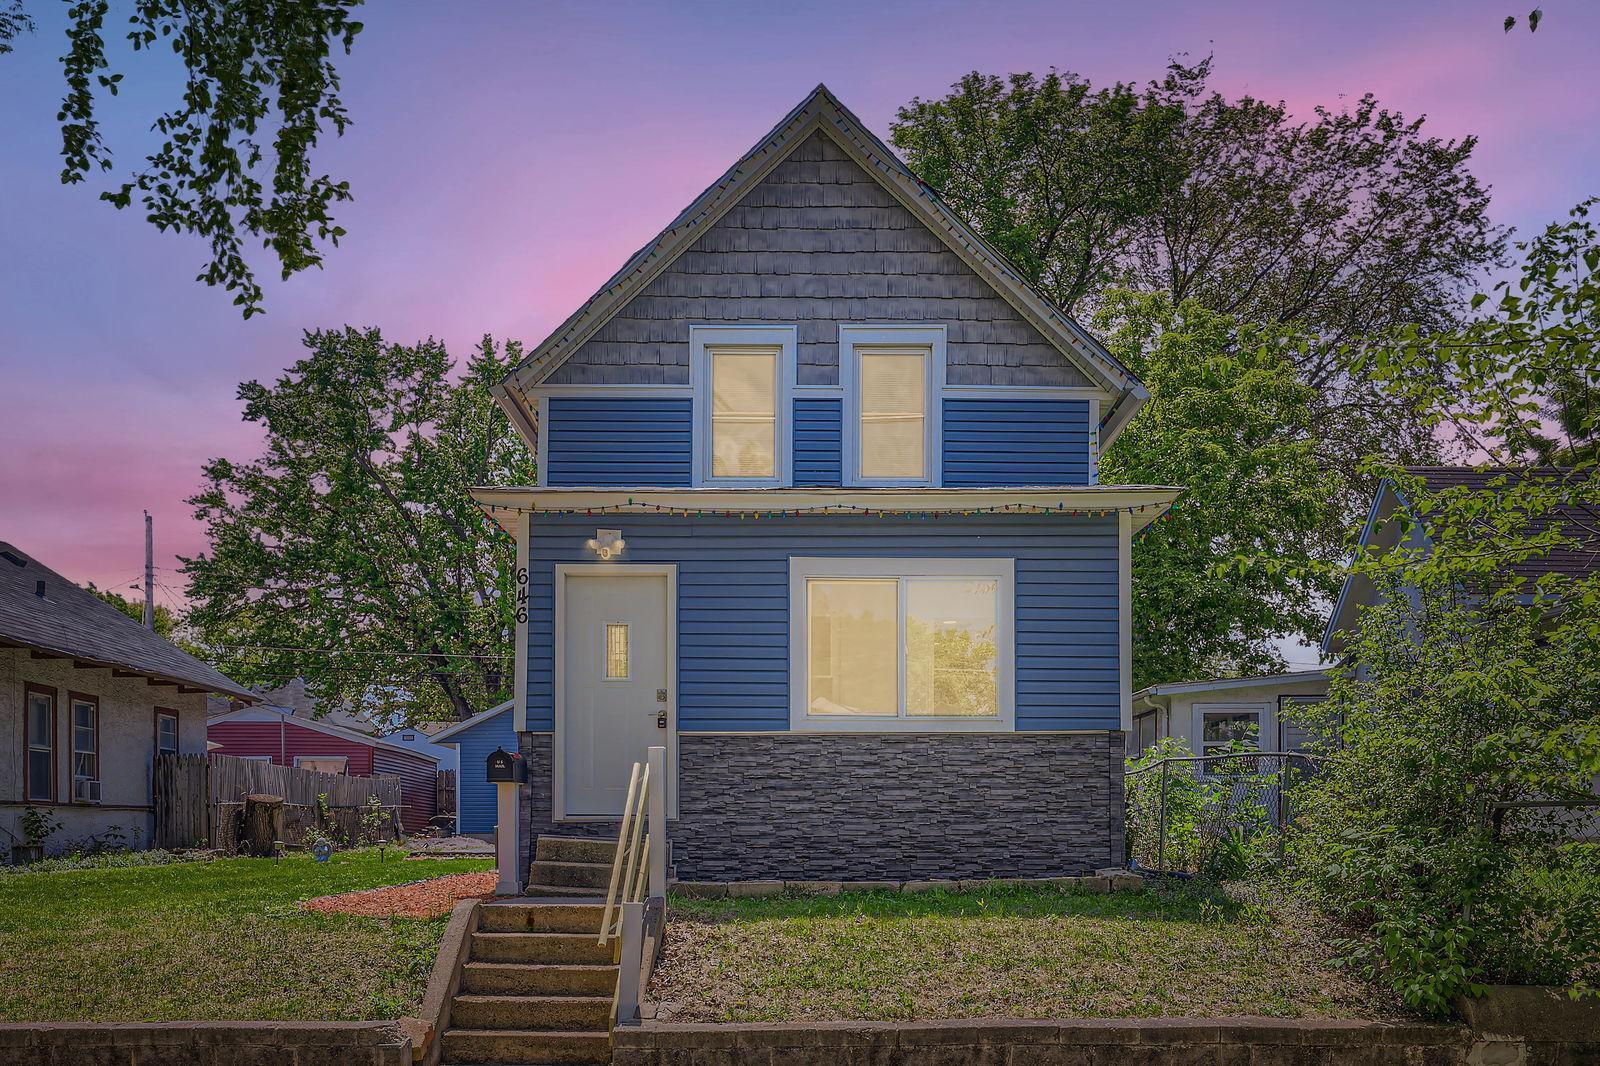
Active
$279,000
2
bds
|
1
ba
|
938
sqft
|
built
1896
646 Van Buren Ave, Saint Paul, MN 55104
$-409
Cash flow
-7.6%
Cash-on-Cash Return
3.9%
Cap rate
0.6%
Rent to Value Ratio
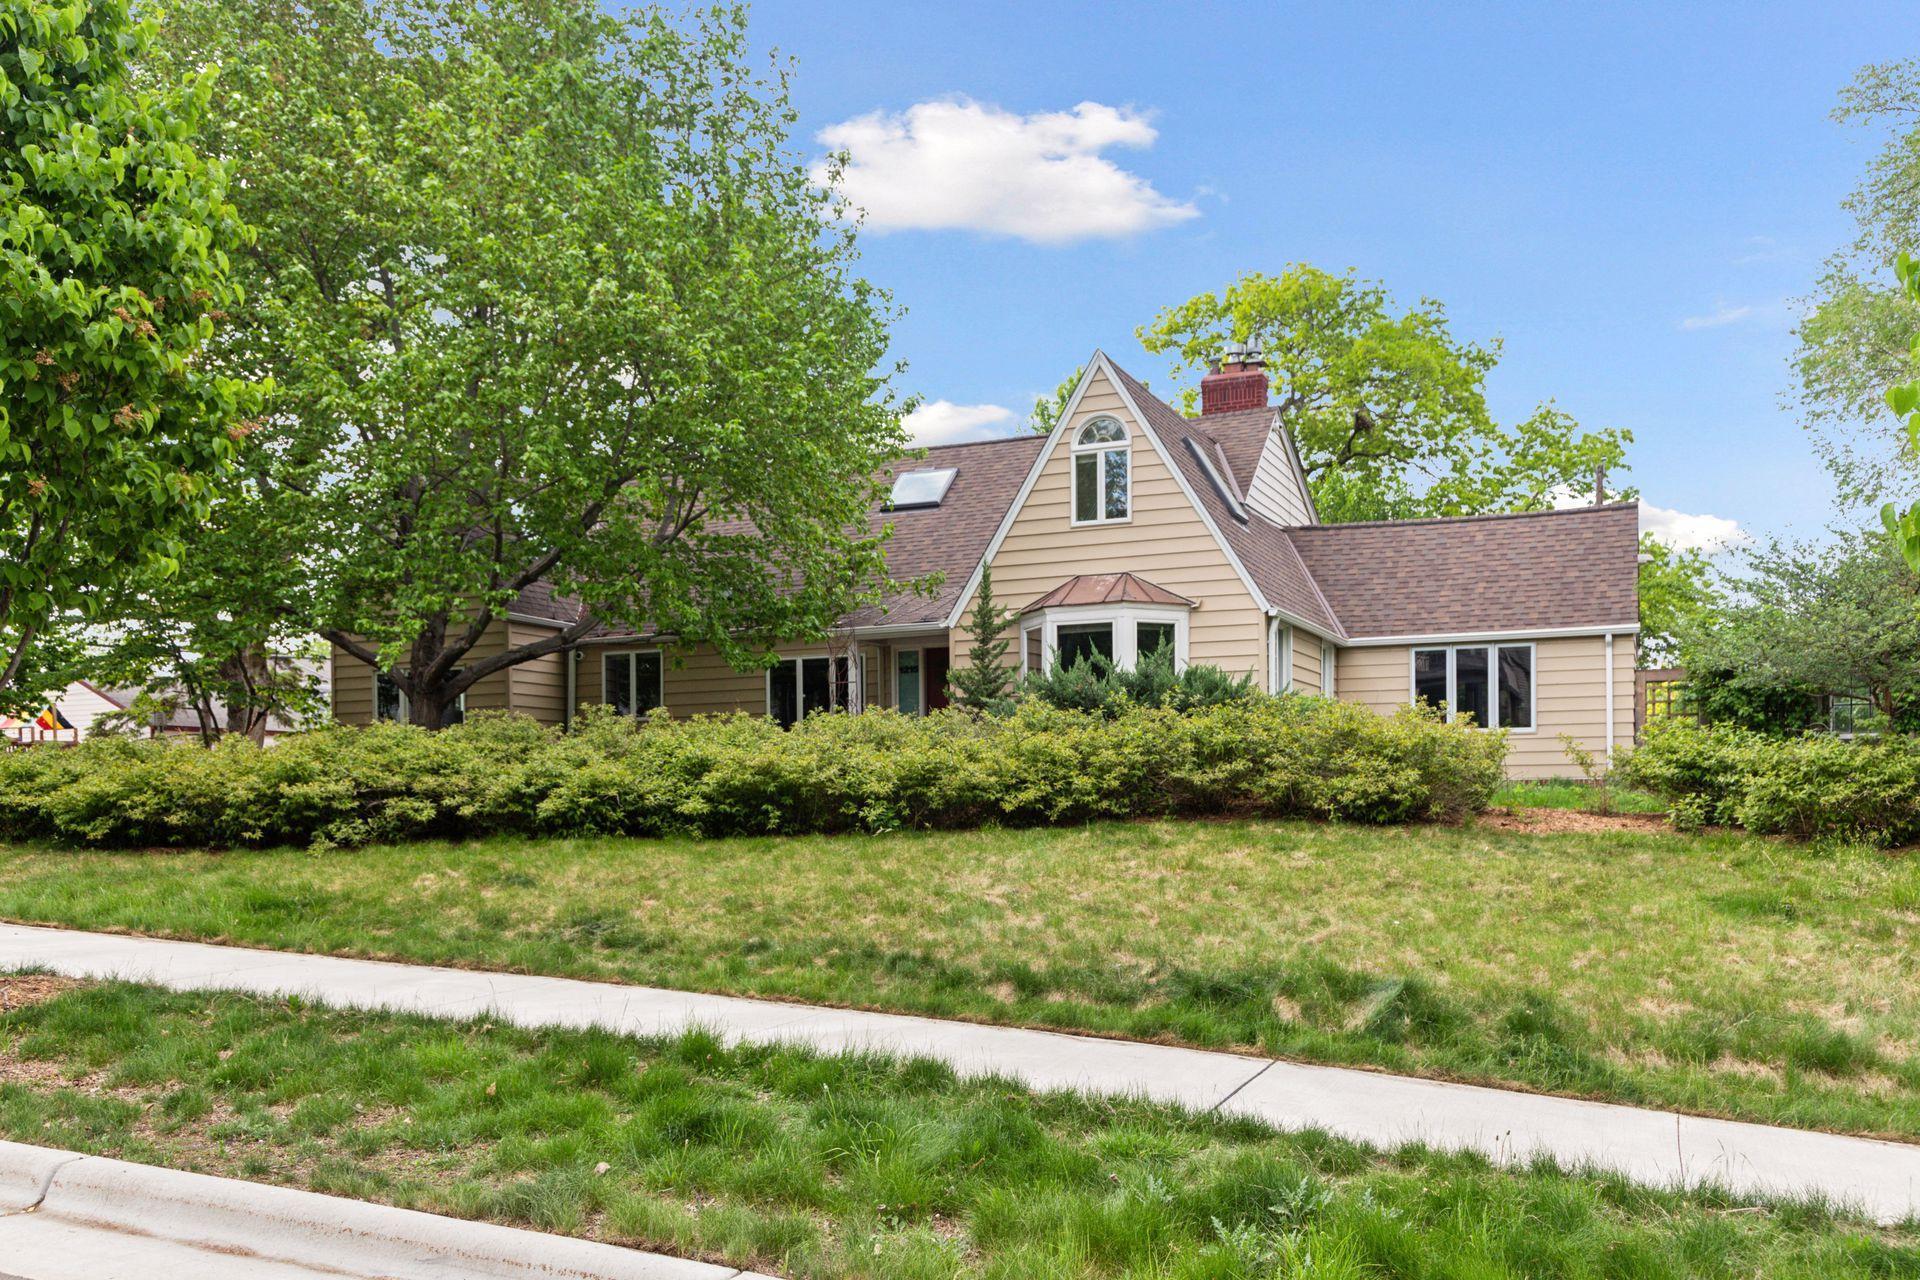
Active
$1,150,000
4
bds
|
4
ba
|
4,140
sqft
|
built
1933
1215 Eleanor Ave, Saint Paul, MN 55116
$-3,709
Cash flow
-16.8%
Cash-on-Cash Return
1.8%
Cap rate
0.4%
Rent to Value Ratio
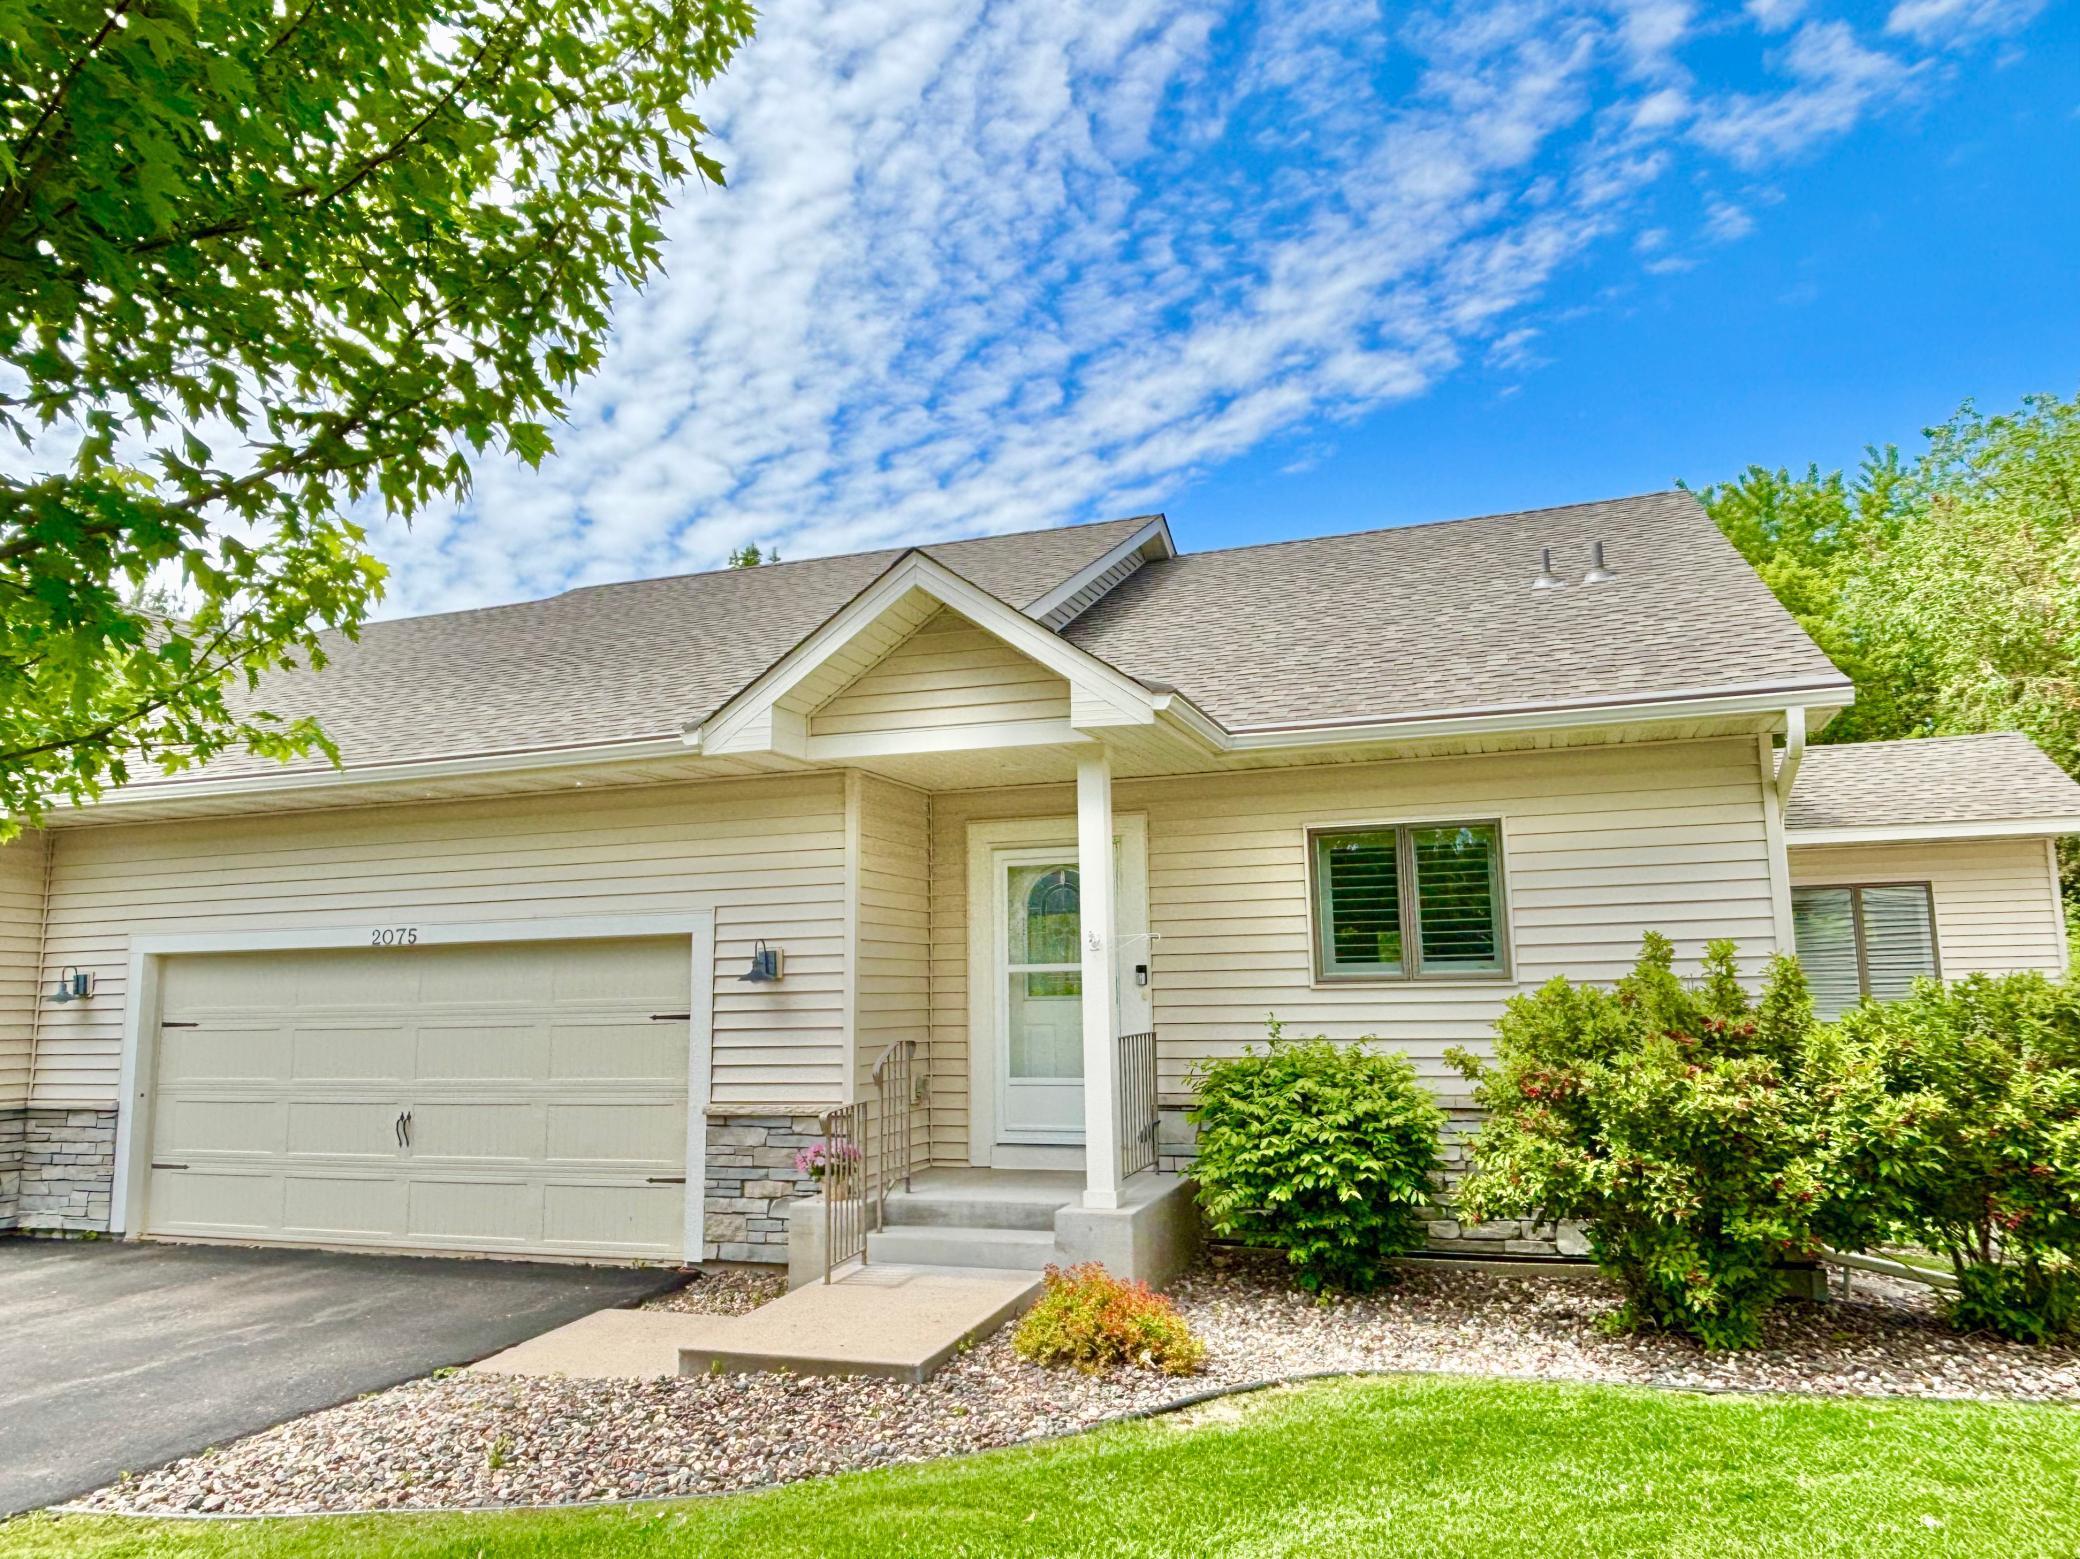
Active
$364,500
2
bds
|
2
ba
|
1,564
sqft
|
built
2017
2075 Cardinal Gln, Saint Paul, MN 55109
$-439
Cash flow
-6.3%
Cash-on-Cash Return
4.2%
Cap rate
0.7%
Rent to Value Ratio
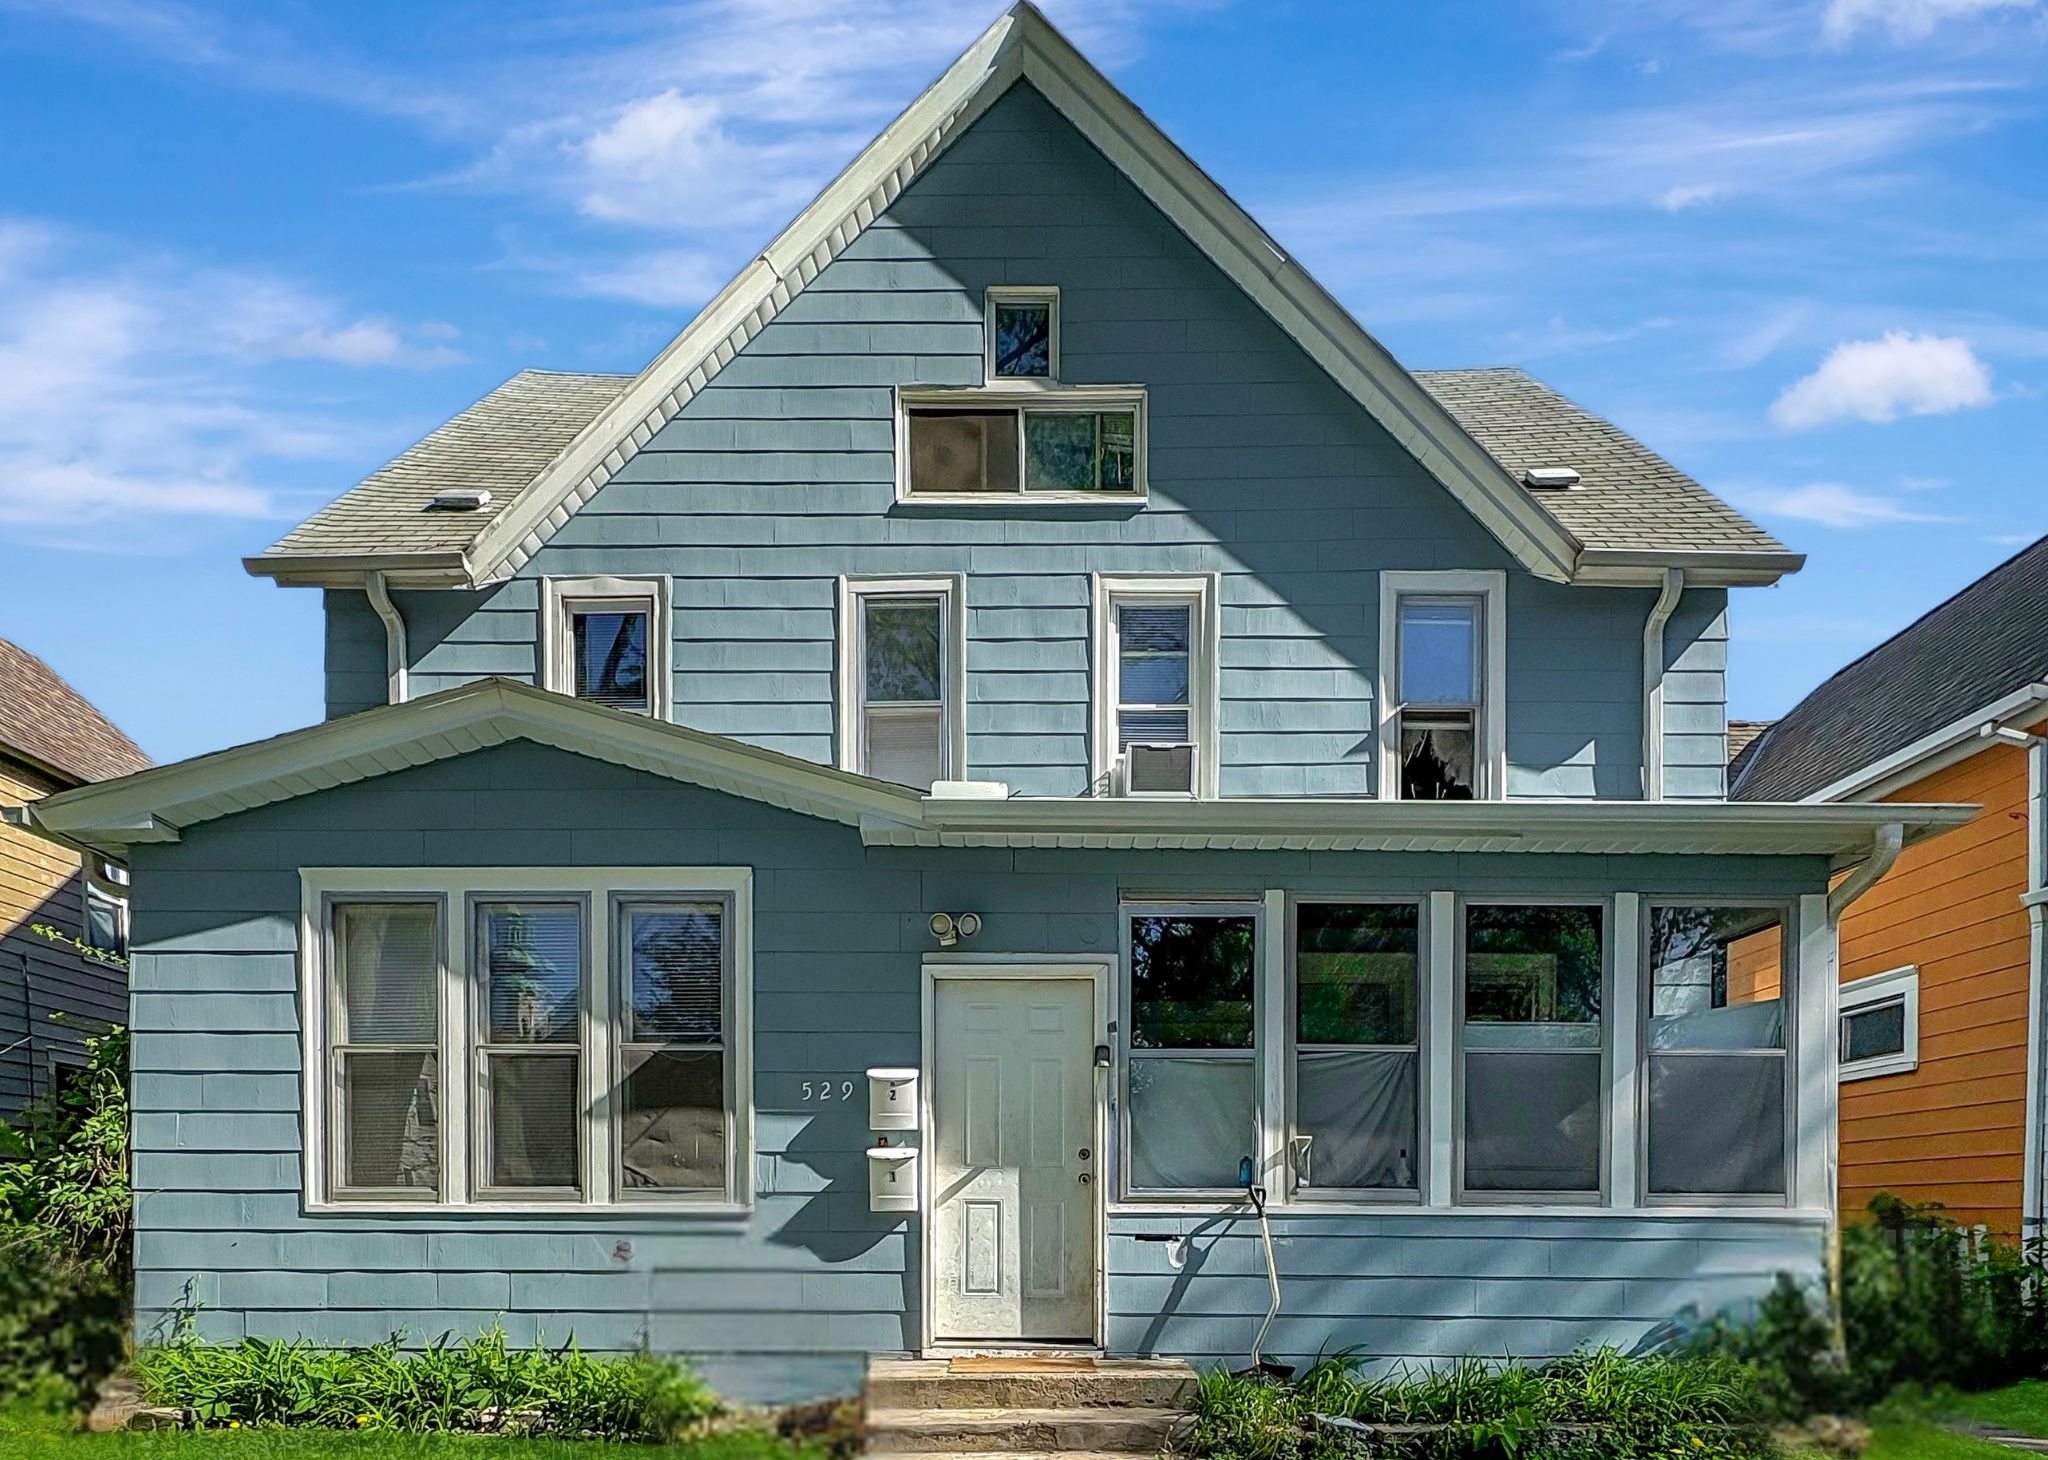
Active
$285,000
10
bds
|
2
ba
|
1,264
sqft
|
built
1892
529 Blair Ave, Saint Paul, MN 55103
$-246
Cash flow
-4.5%
Cash-on-Cash Return
4.6%
Cap rate
0.8%
Rent to Value Ratio
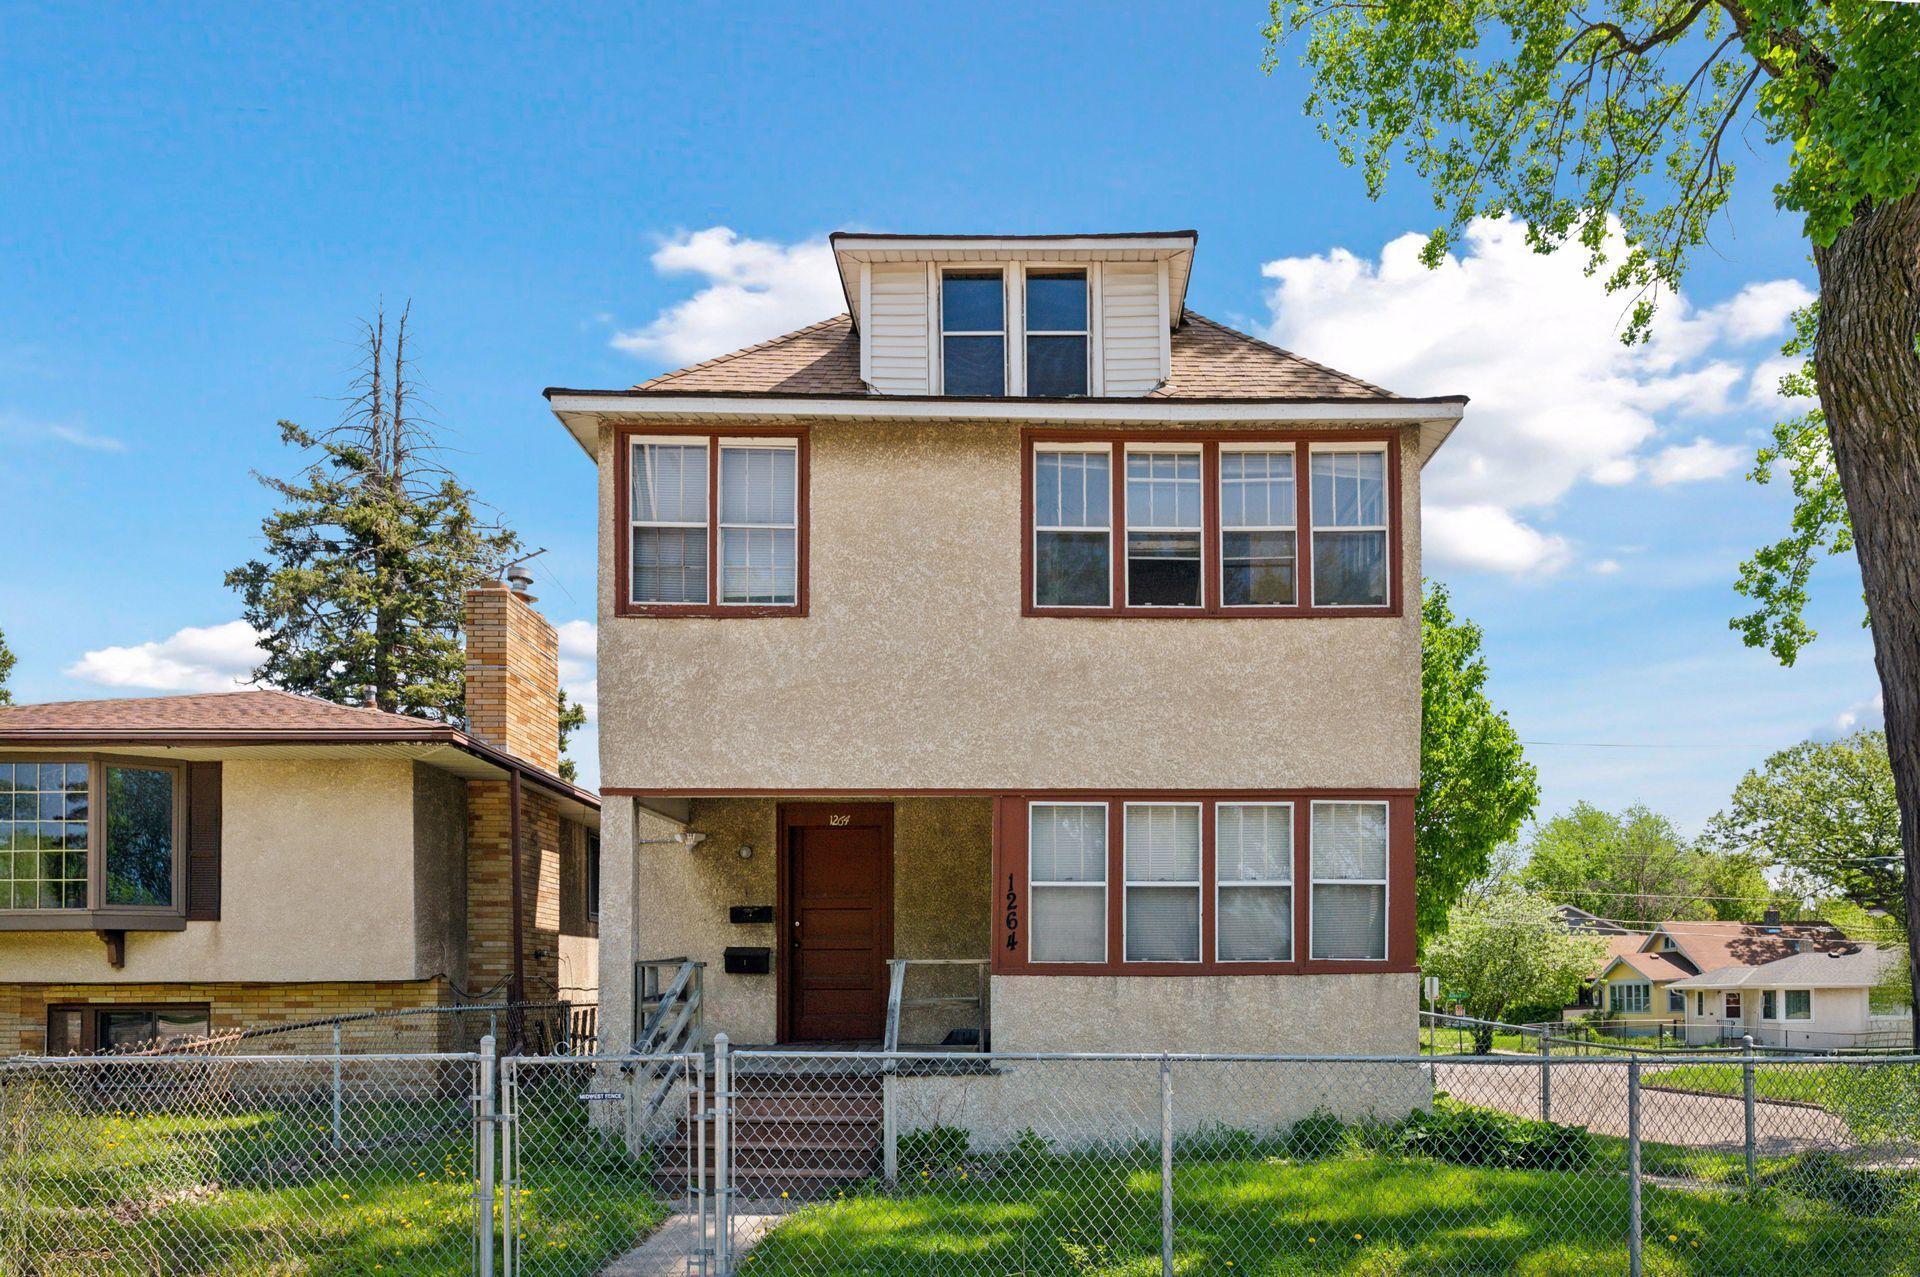
Active
$325,000
5
bds
|
2
ba
|
2,112
sqft
|
built
1906
1264 Snelling Ave N, Saint Paul, MN 55108
$-873
Cash flow
-14.0%
Cash-on-Cash Return
2.5%
Cap rate
0.6%
Rent to Value Ratio
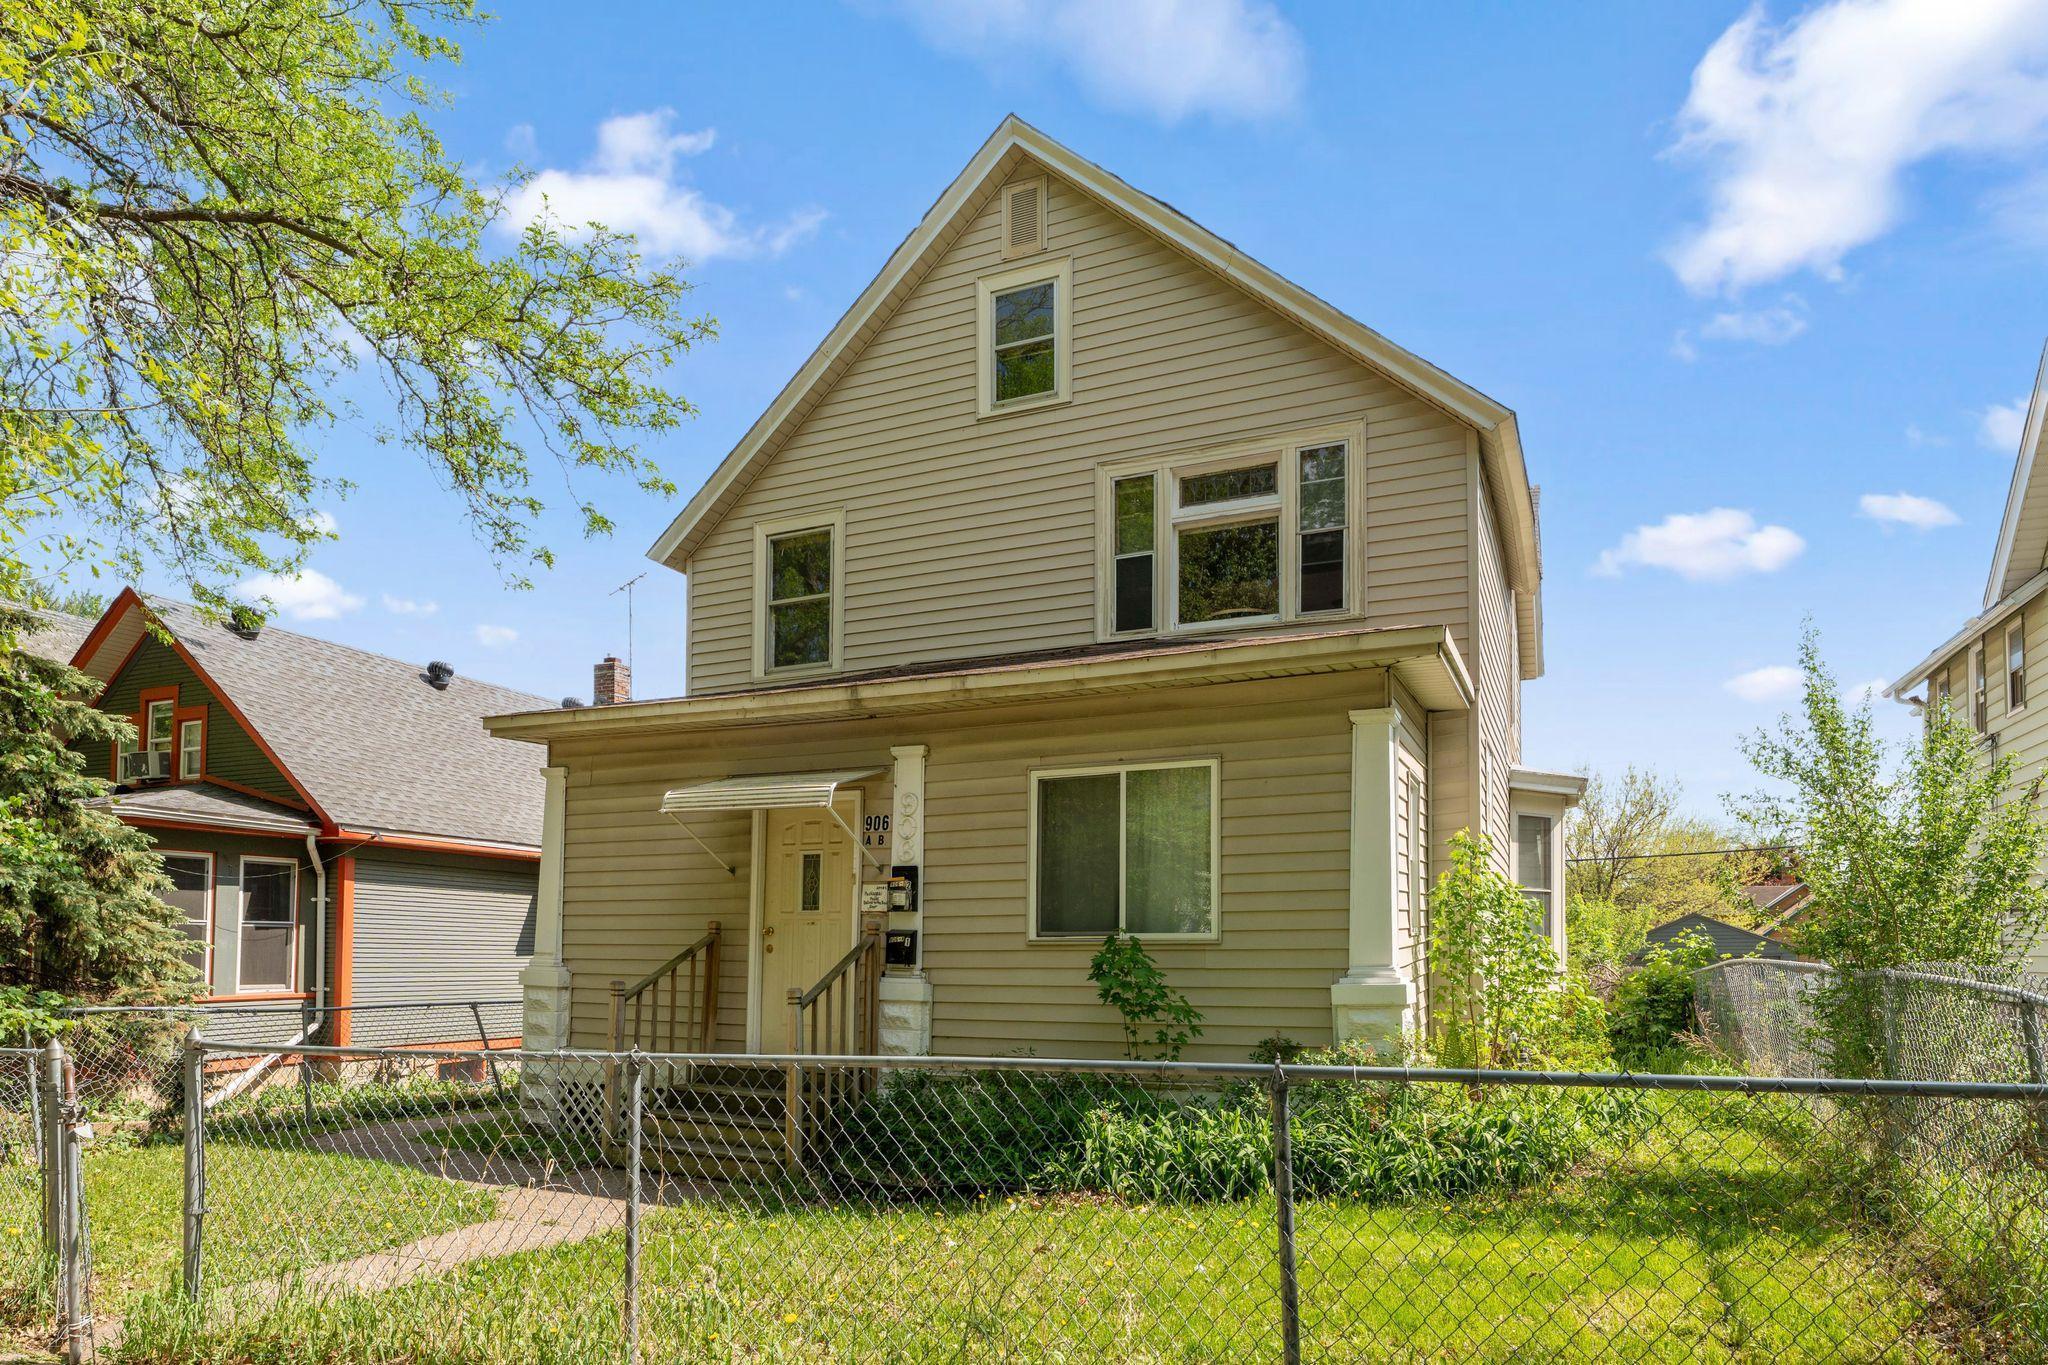
Active
$249,900
5
bds
|
2
ba
|
2,200
sqft
|
built
1896
906 5th St E, Saint Paul, MN 55106
$-375
Cash flow
-7.8%
Cash-on-Cash Return
3.9%
Cap rate
0.7%
Rent to Value Ratio
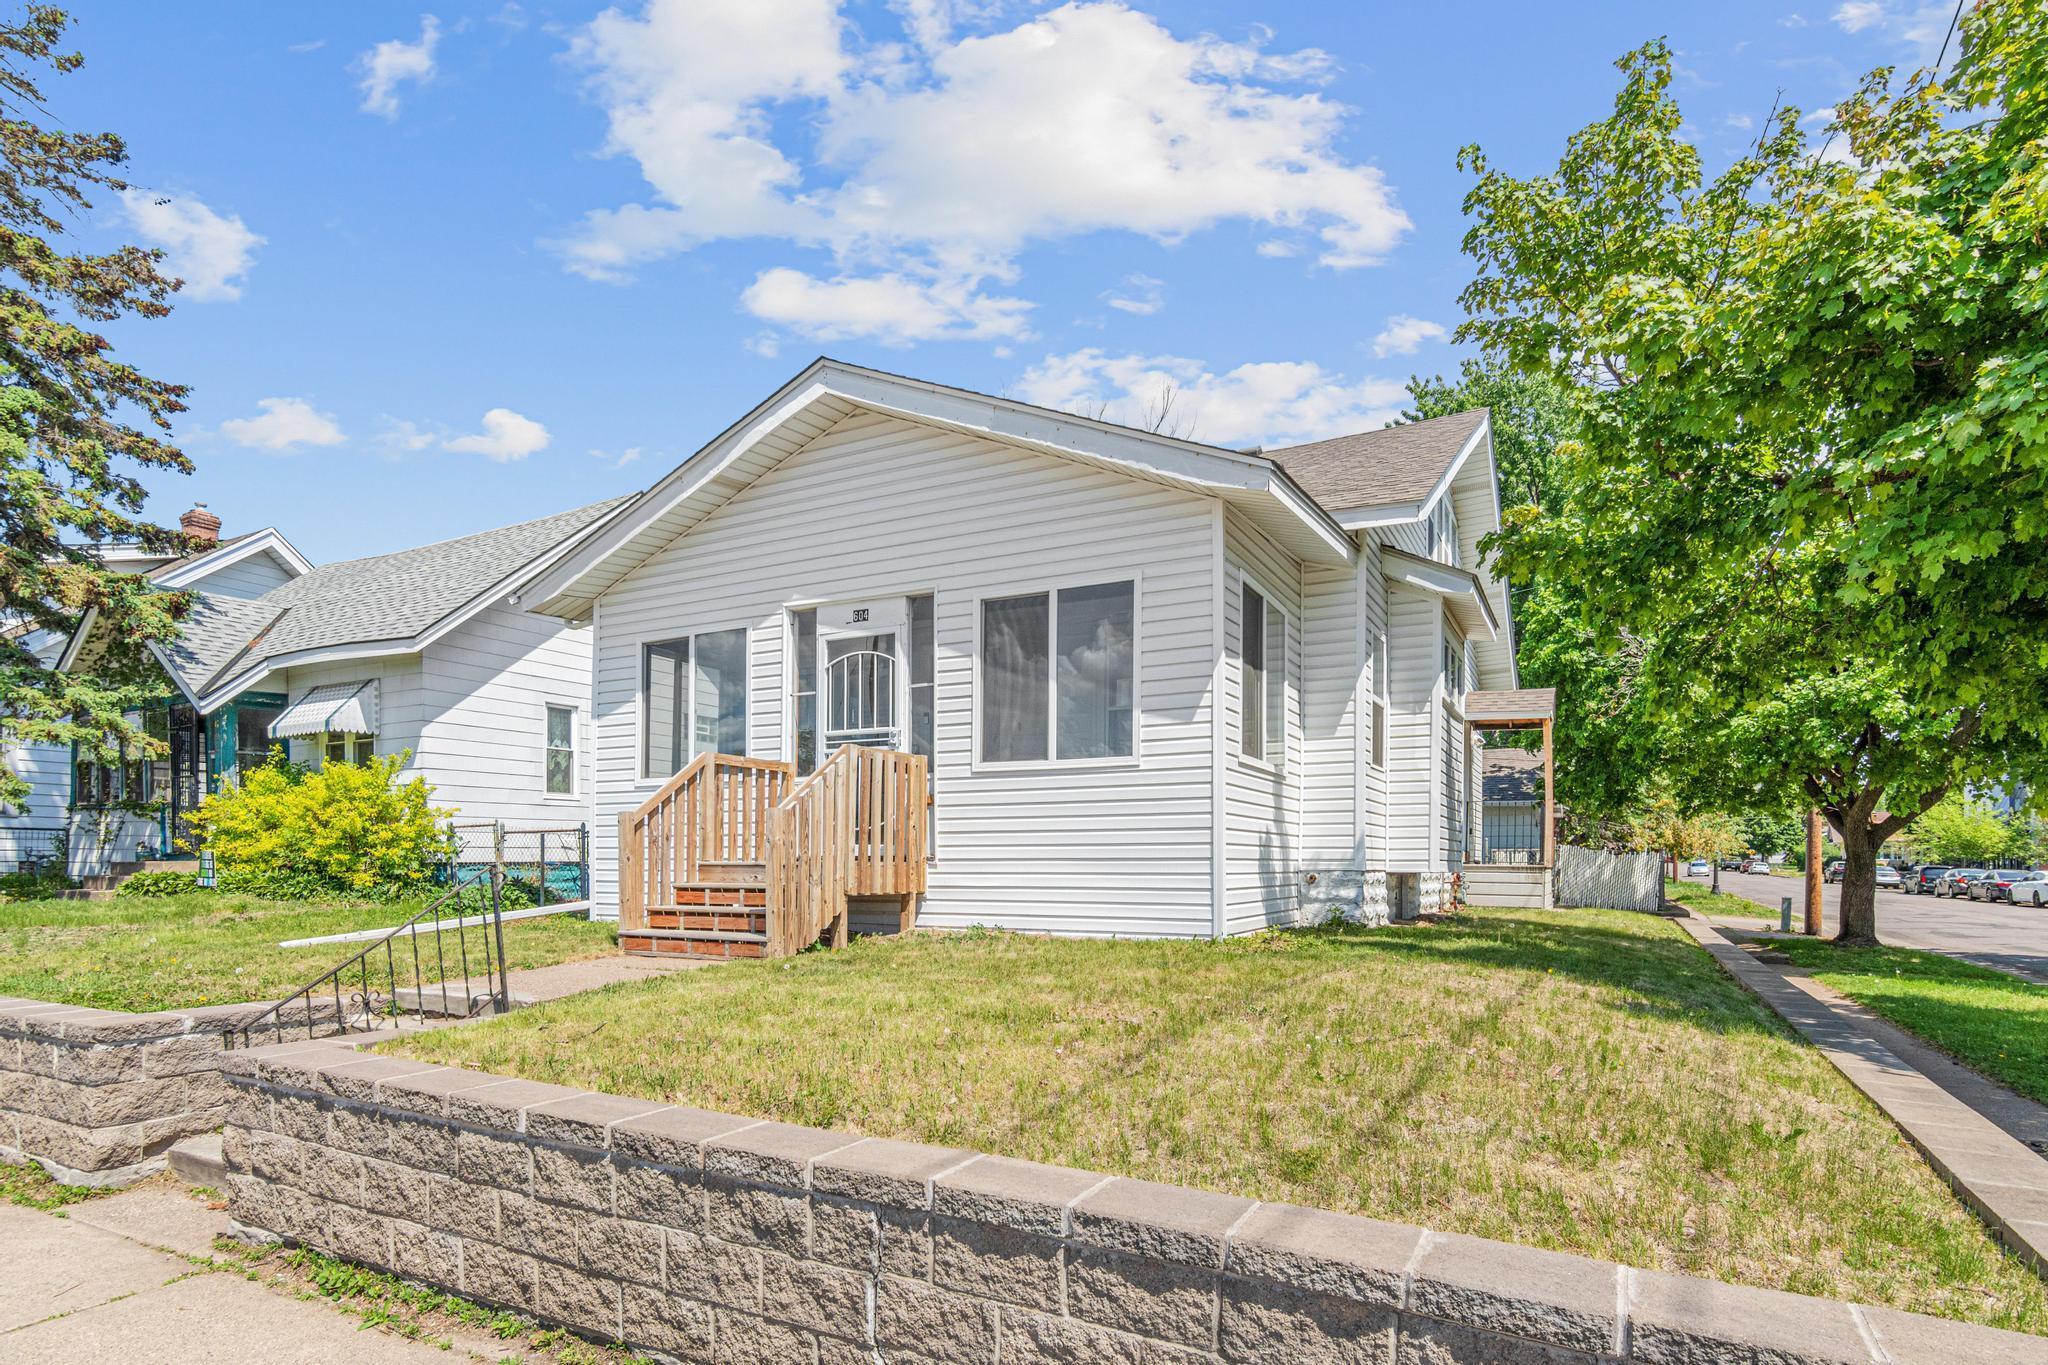
Active
$295,000
4
bds
|
2
ba
|
1,208
sqft
|
built
1917
604 Asbury St, Saint Paul, MN 55104
$-225
Cash flow
-4.0%
Cash-on-Cash Return
4.8%
Cap rate
0.7%
Rent to Value Ratio
Active
$359,900
2
bds
|
2
ba
|
1,271
sqft
|
built
2004
270 4th St E, Saint Paul, MN 55101
$-1,535
Cash flow
-22.3%
Cash-on-Cash Return
0.6%
Cap rate
0.6%
Rent to Value Ratio

Active
$359,000
3
bds
|
3
ba
|
1,924
sqft
|
built
1976
1423 Winchell St, Saint Paul, MN 55106
$-279
Cash flow
-4.1%
Cash-on-Cash Return
4.7%
Cap rate
0.8%
Rent to Value Ratio
Active
$329,900
3
bds
|
2
ba
|
1,025
sqft
|
built
1960
761 Labore Rd, Saint Paul, MN 55117
$-701
Cash flow
-11.1%
Cash-on-Cash Return
3.1%
Cap rate
0.5%
Rent to Value Ratio
Active
$286,998
2
bds
|
2
ba
|
1,726
sqft
|
built
1997
428 Hickory Ln N, Saint Paul, MN 55128
$-524
Cash flow
-9.5%
Cash-on-Cash Return
3.5%
Cap rate
0.8%
Rent to Value Ratio
Active
$239,000
1
bds
|
2
ba
|
871
sqft
|
built
2003
820 Emerald St, Saint Paul, MN 55114
$-639
Cash flow
-13.9%
Cash-on-Cash Return
2.5%
Cap rate
0.7%
Rent to Value Ratio
Active
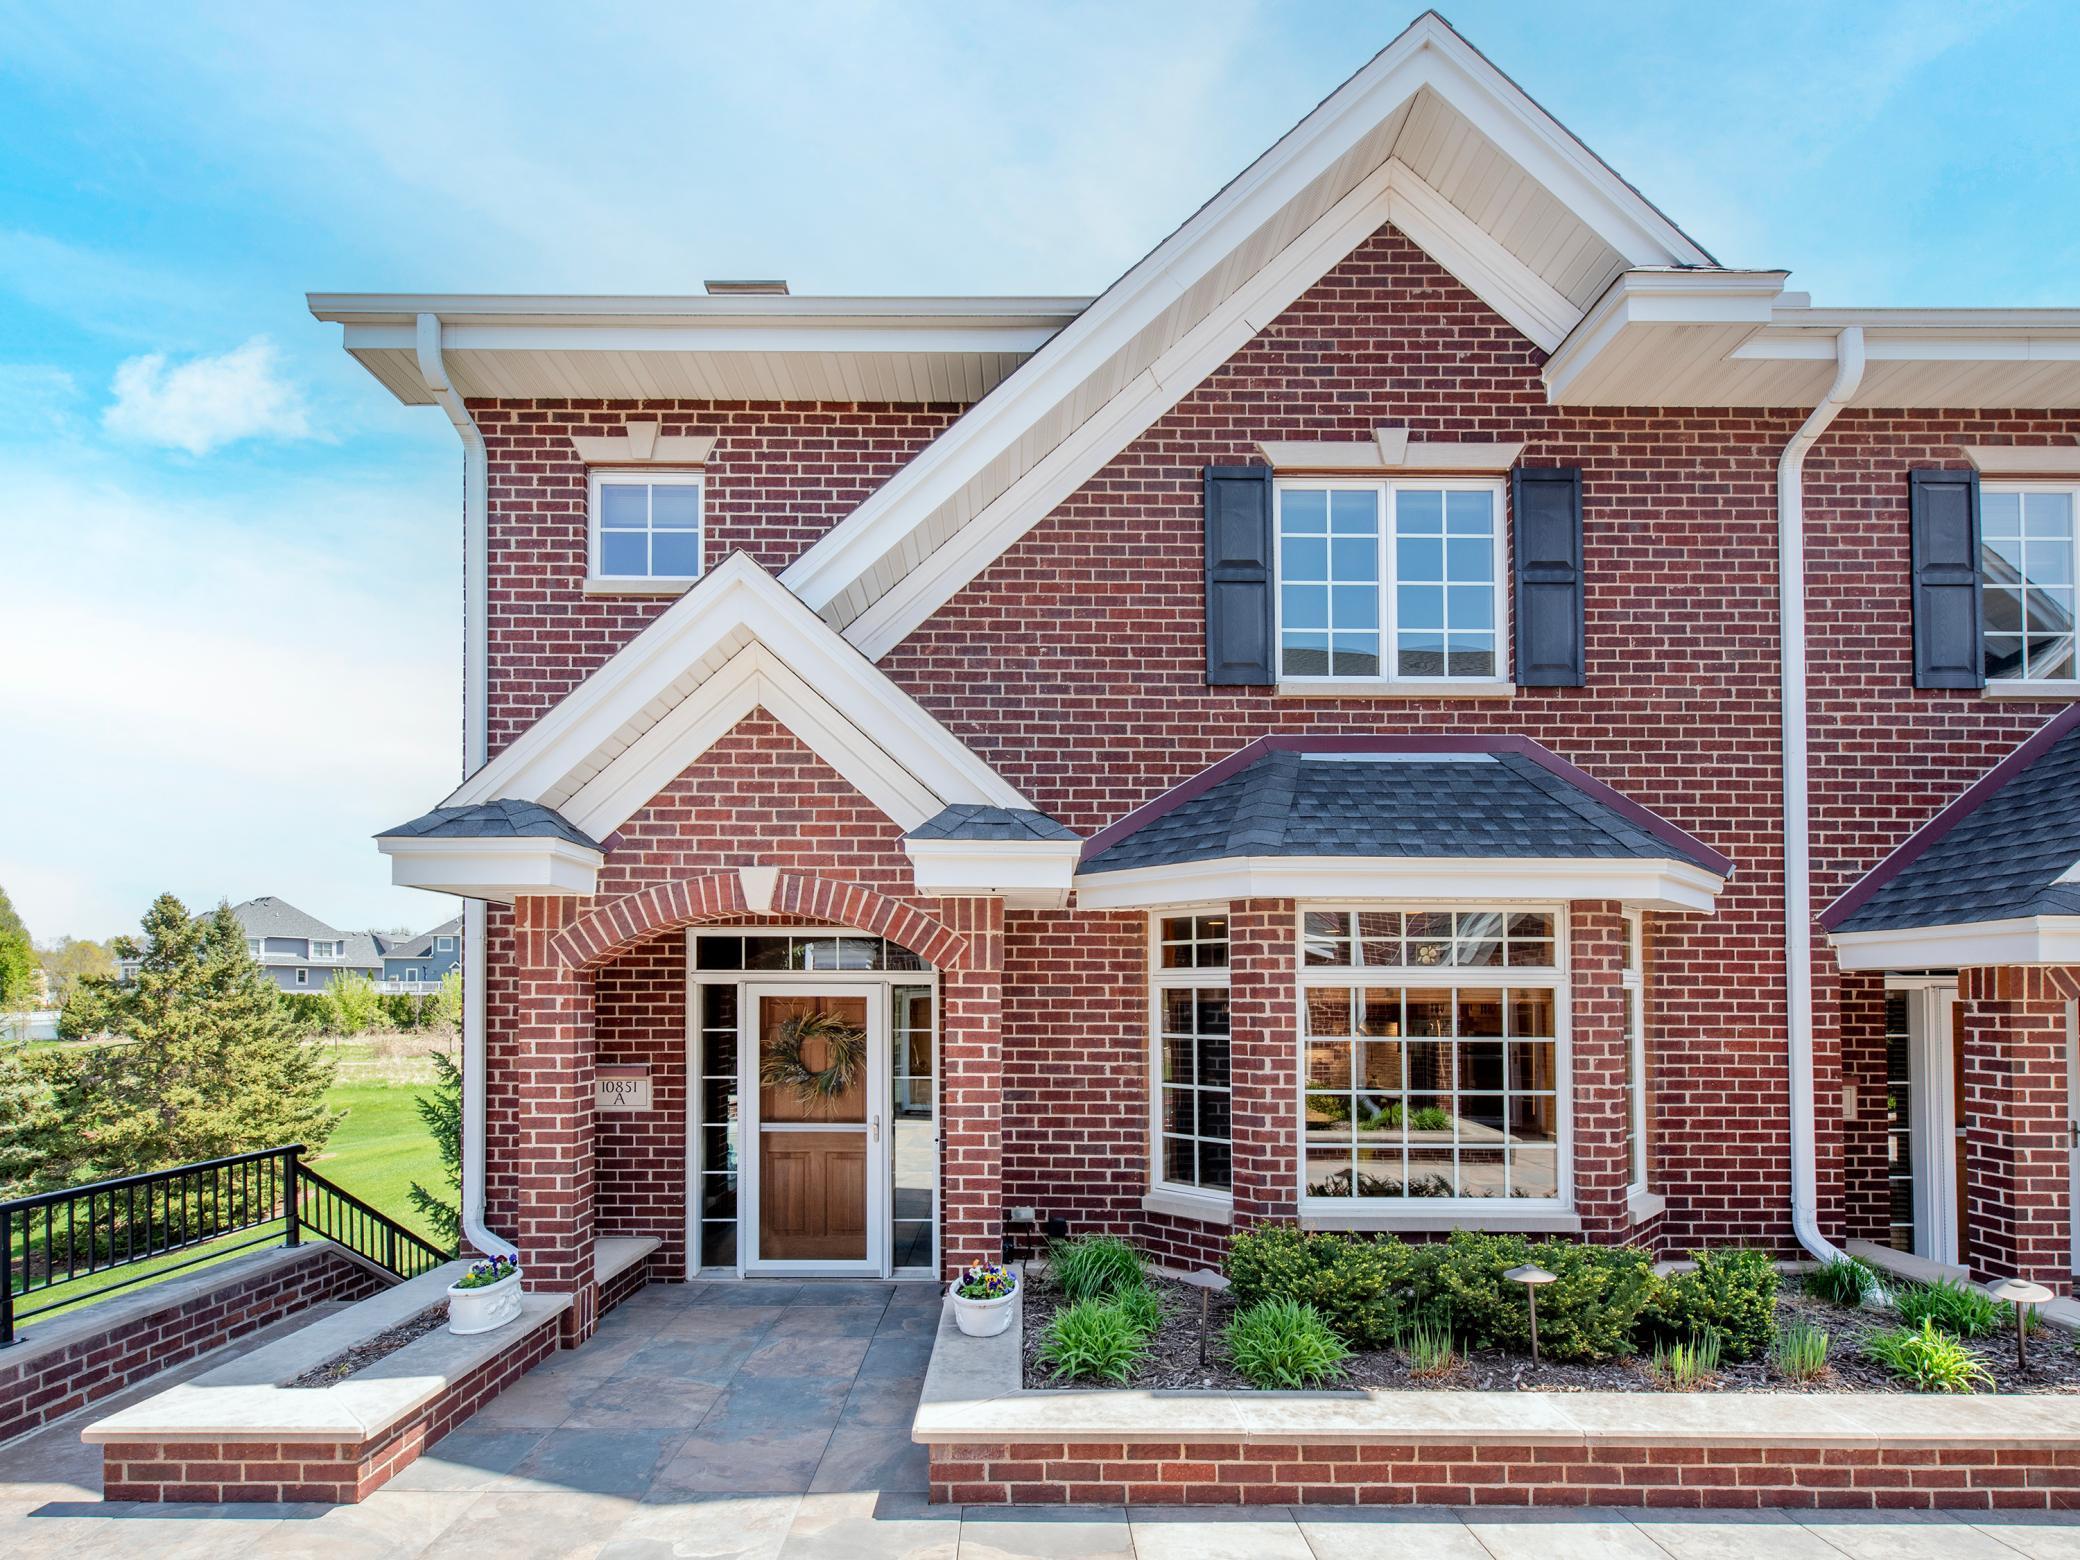
$650,000
3
bds
|
3
ba
|
3,184
sqft
|
built
2006
10851 Falling Water Ln, Saint Paul, MN 55129
$-2,028
Cash flow
-16.3%
Cash-on-Cash Return
1.9%
Cap rate
0.5%
Rent to Value Ratio
Active
$1,849,000
6
bds
|
5
ba
|
5,738
sqft
|
built
1907
46 Crocus Pl, Saint Paul, MN 55102
$-5,300
Cash flow
-15.0%
Cash-on-Cash Return
2.2%
Cap rate
0.3%
Rent to Value Ratio
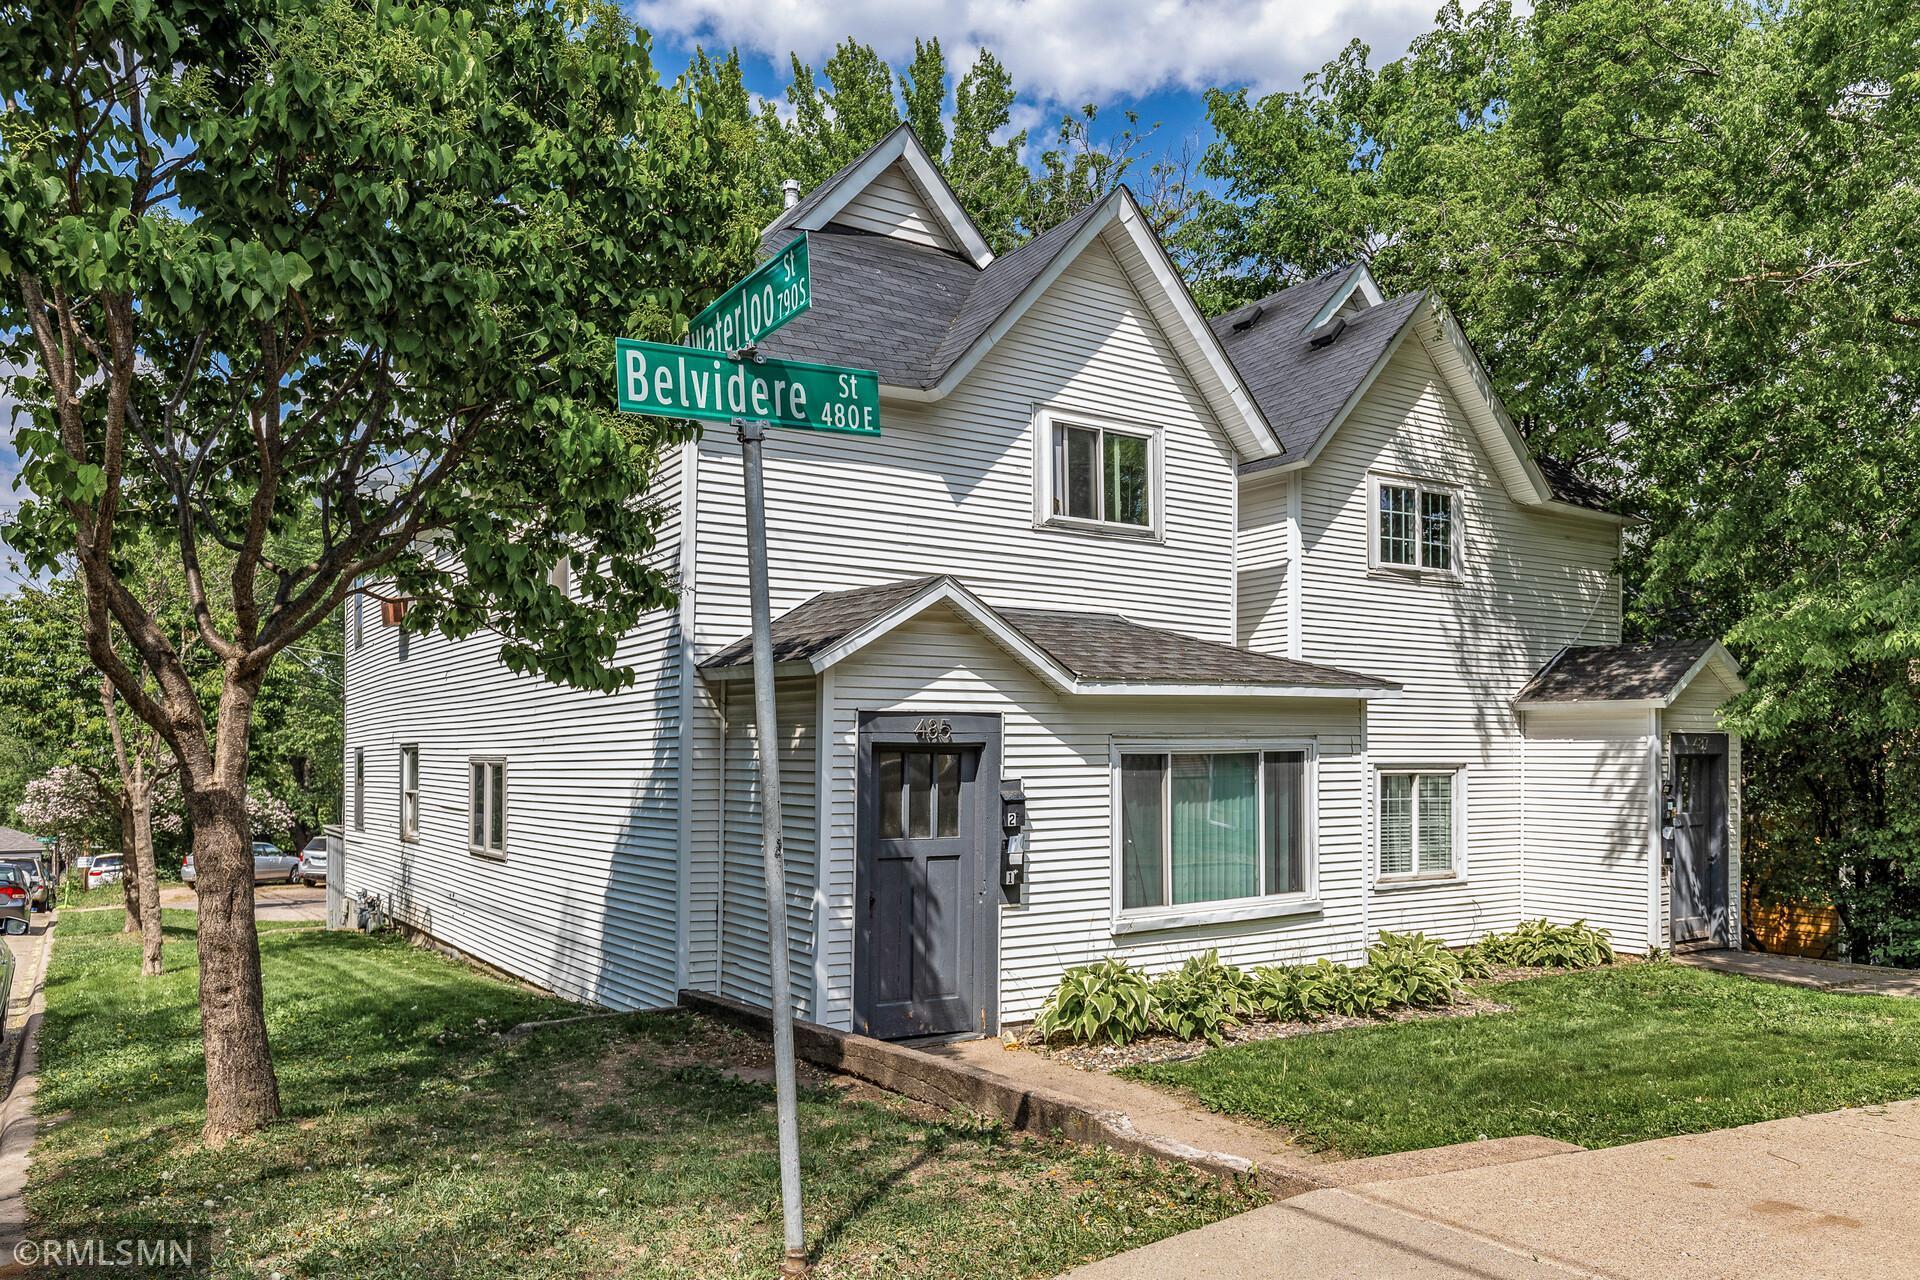
Active
$499,000
6
bds
|
4
ba
|
3,600
sqft
|
built
1893
485 Belvidere St E, Saint Paul, MN 55107
$-1,168
Cash flow
-12.2%
Cash-on-Cash Return
2.9%
Cap rate
0.4%
Rent to Value Ratio
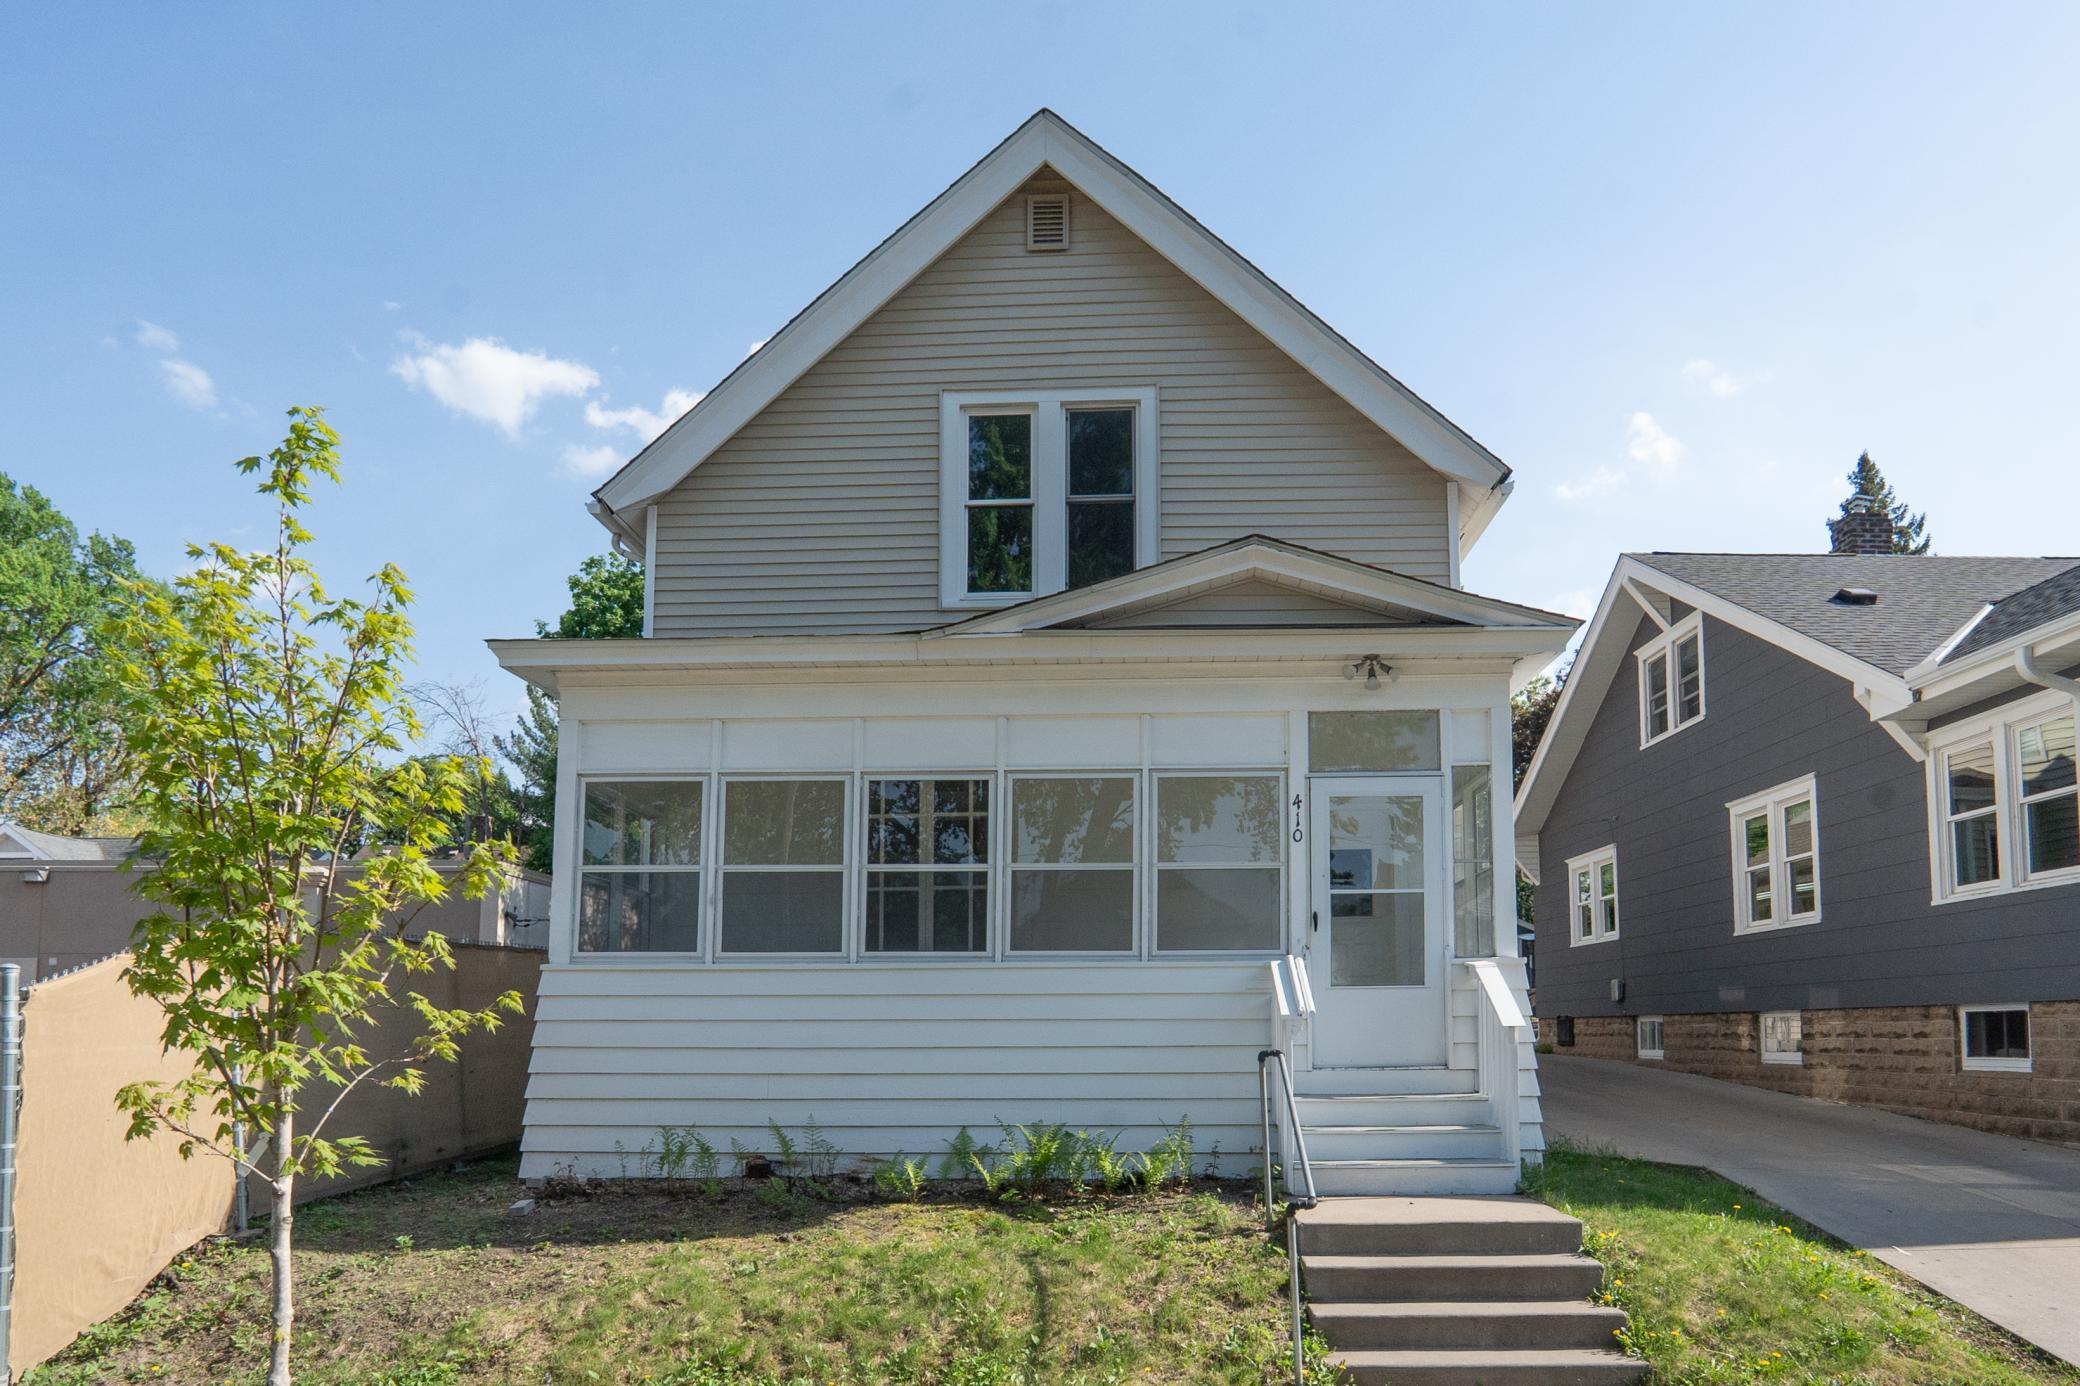
Active
$239,900
4
bds
|
2
ba
|
1,320
sqft
|
built
1900
410 Baker St W, Saint Paul, MN 55107
$-41
Cash flow
-0.9%
Cash-on-Cash Return
5.5%
Cap rate
0.8%
Rent to Value Ratio
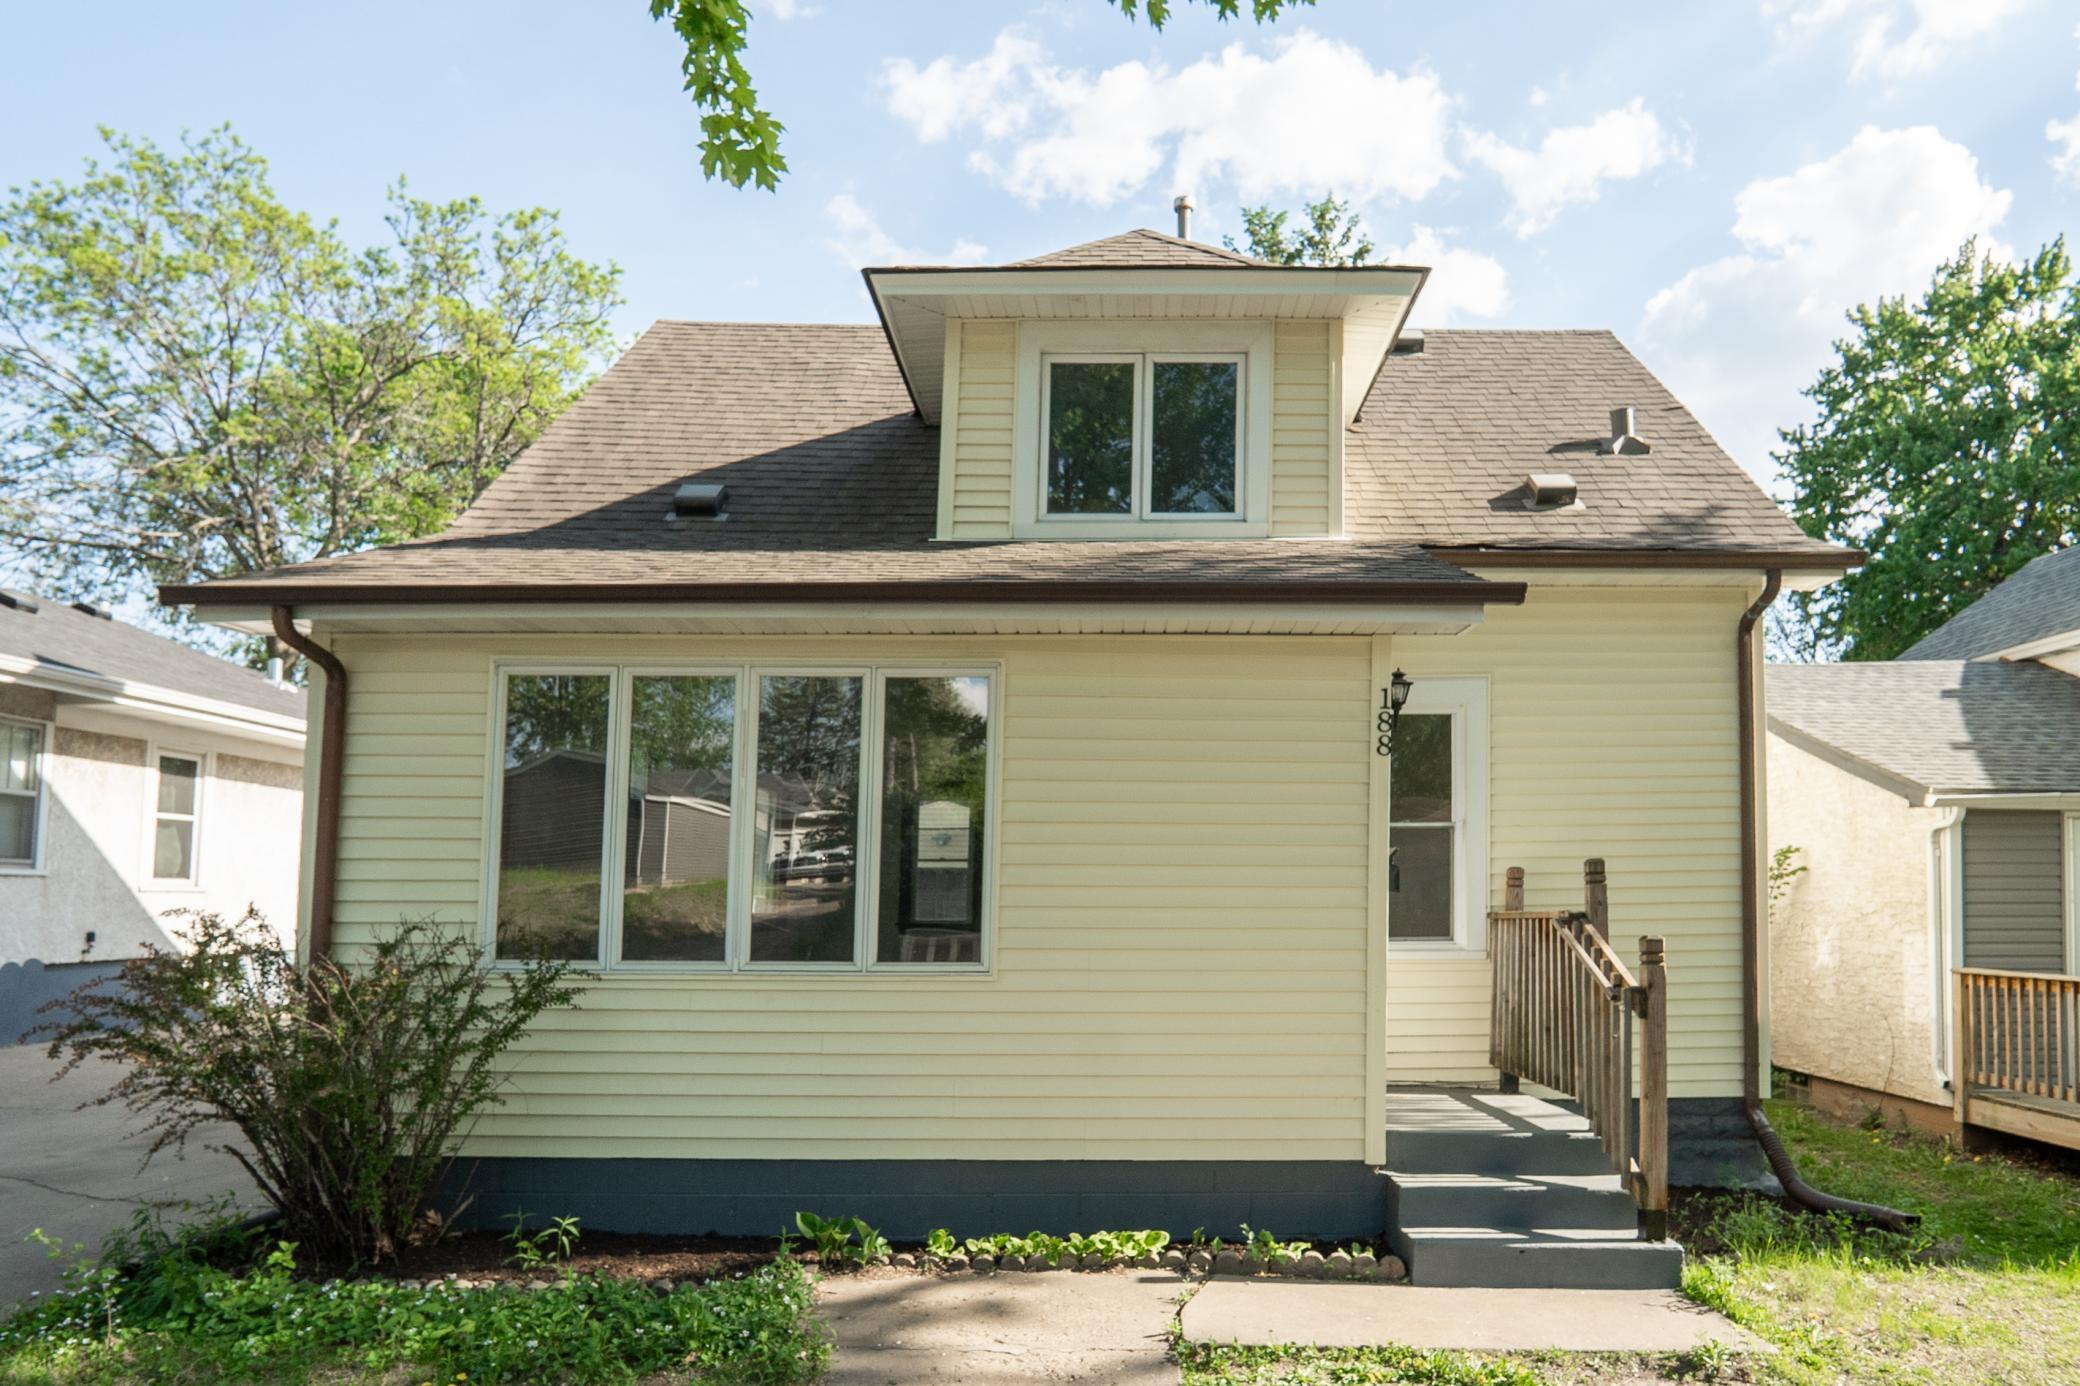
Active
$299,900
3
bds
|
1
ba
|
1,038
sqft
|
built
1909
188 Wyoming St E, Saint Paul, MN 55107
$-460
Cash flow
-8.0%
Cash-on-Cash Return
3.8%
Cap rate
0.6%
Rent to Value Ratio
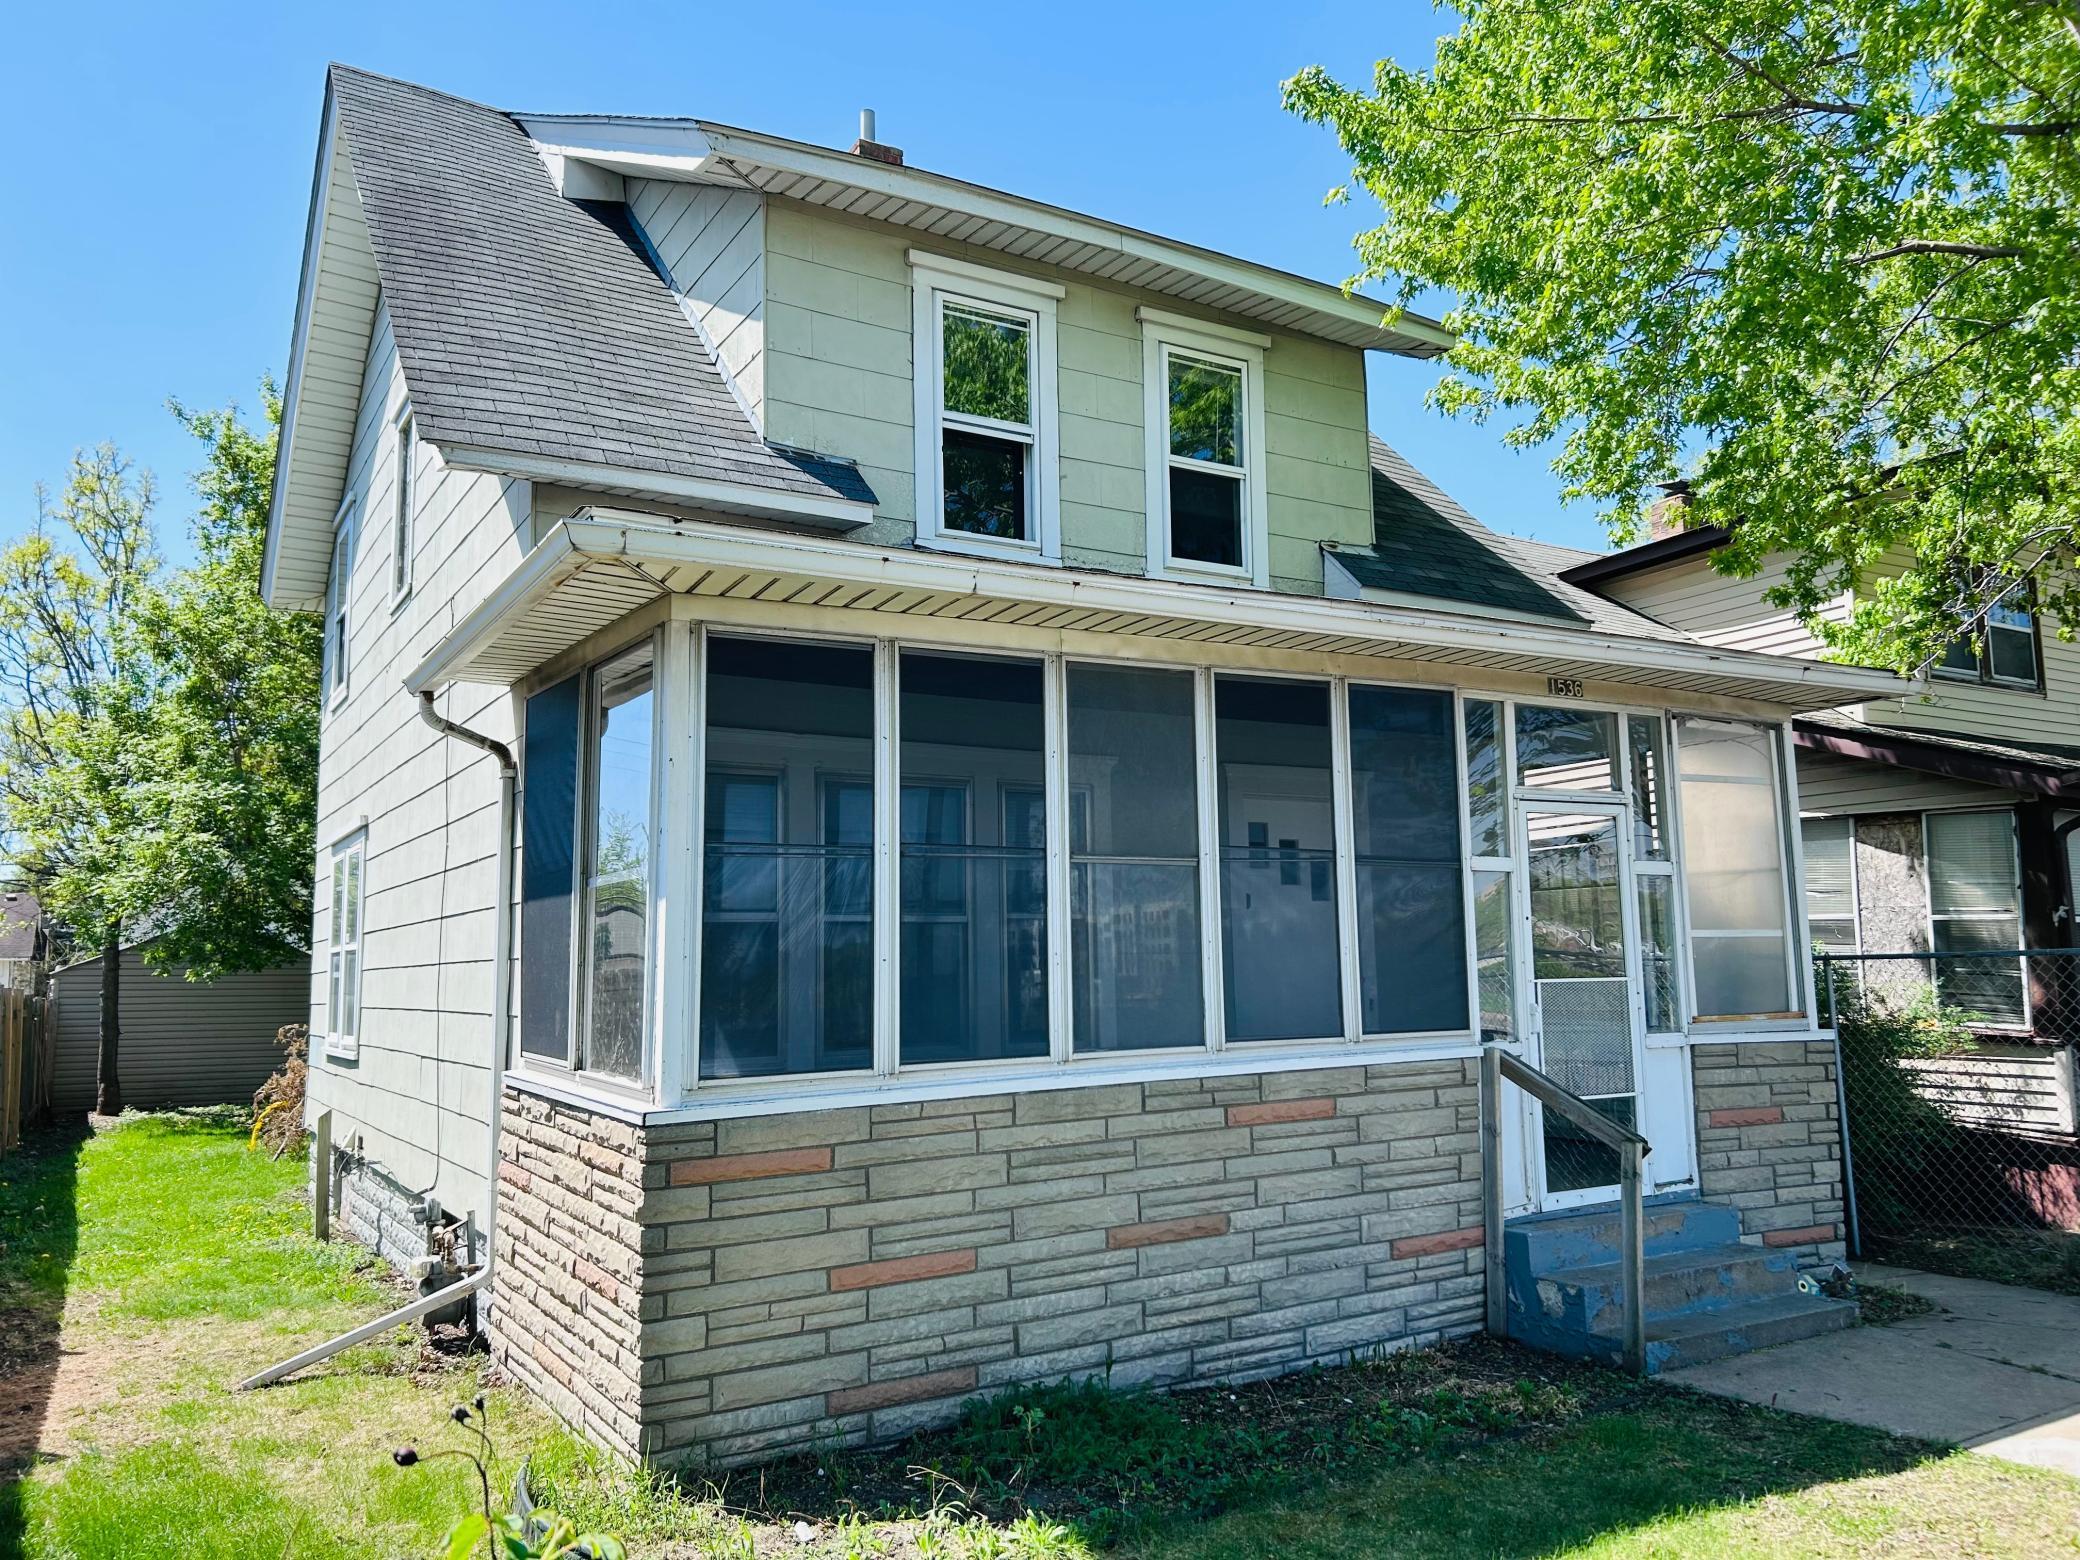
Active
$239,900
3
bds
|
1
ba
|
1,061
sqft
|
built
1914
1536 Concordia Ave, Saint Paul, MN 55104
$-49
Cash flow
-1.1%
Cash-on-Cash Return
5.4%
Cap rate
0.8%
Rent to Value Ratio
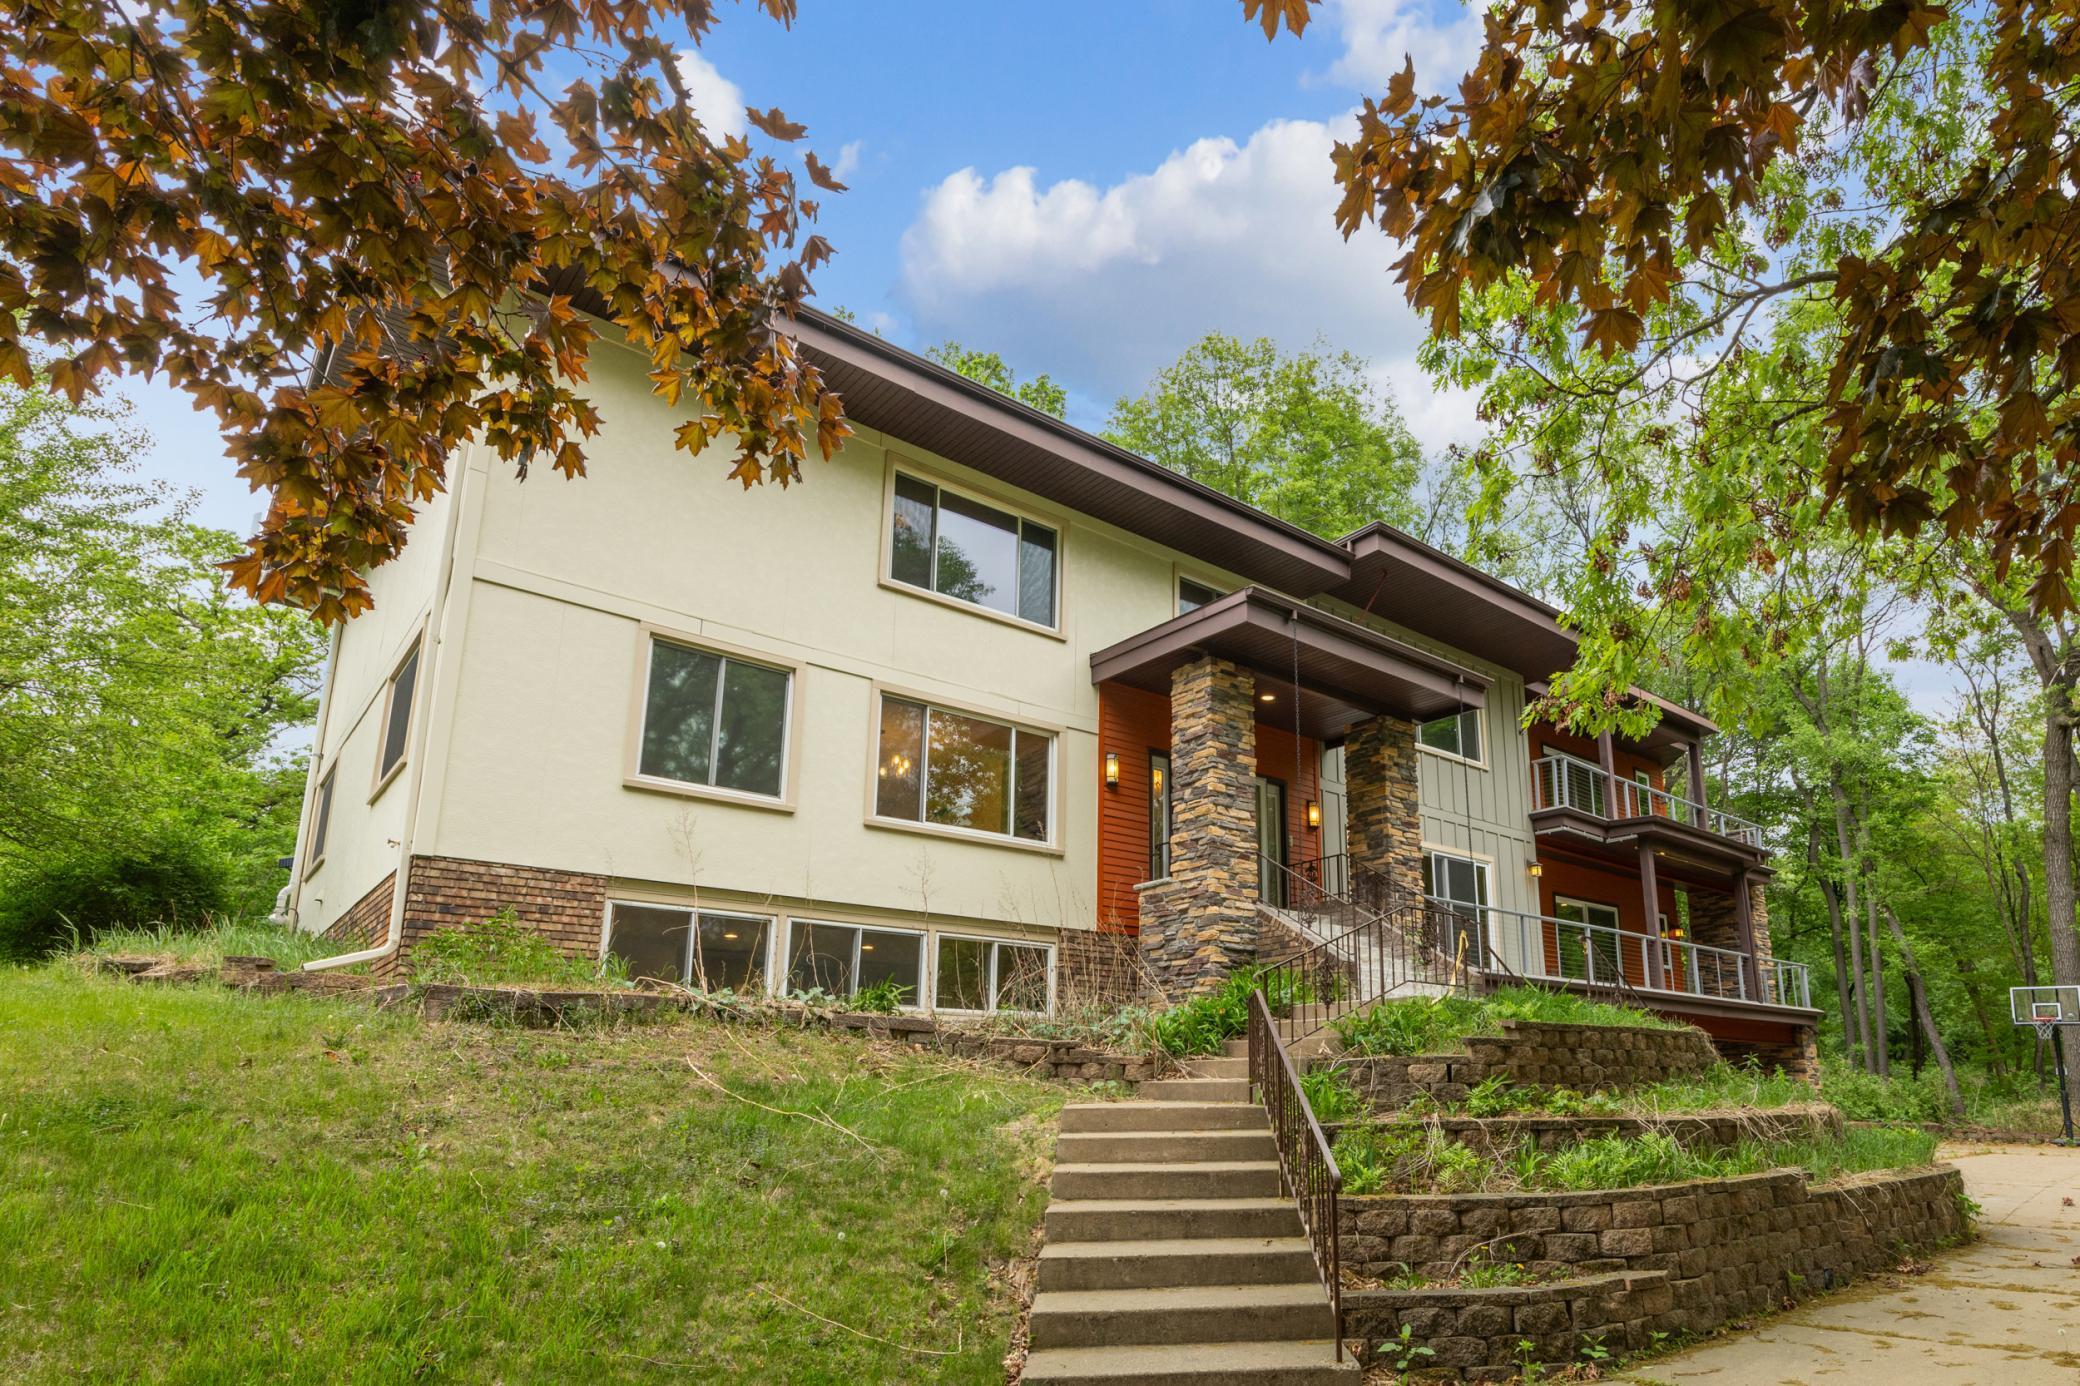
Active
$875,000
7
bds
|
5
ba
|
5,134
sqft
|
built
1972
21 Red Fox Rd, Saint Paul, MN 55127
$-1,155
Cash flow
-6.9%
Cash-on-Cash Return
4.1%
Cap rate
0.6%
Rent to Value Ratio
Active
$339,900
4
bds
|
2
ba
|
1,768
sqft
|
built
1977
1120 Mackubin St, Saint Paul, MN 55117
$-437
Cash flow
-6.7%
Cash-on-Cash Return
4.1%
Cap rate
0.6%
Rent to Value Ratio
Active
$725,000
2
bds
|
2
ba
|
2,116
sqft
|
built
1984
168 6th St E, Saint Paul, MN 55101
$-3,014
Cash flow
-21.7%
Cash-on-Cash Return
0.7%
Cap rate
0.6%
Rent to Value Ratio
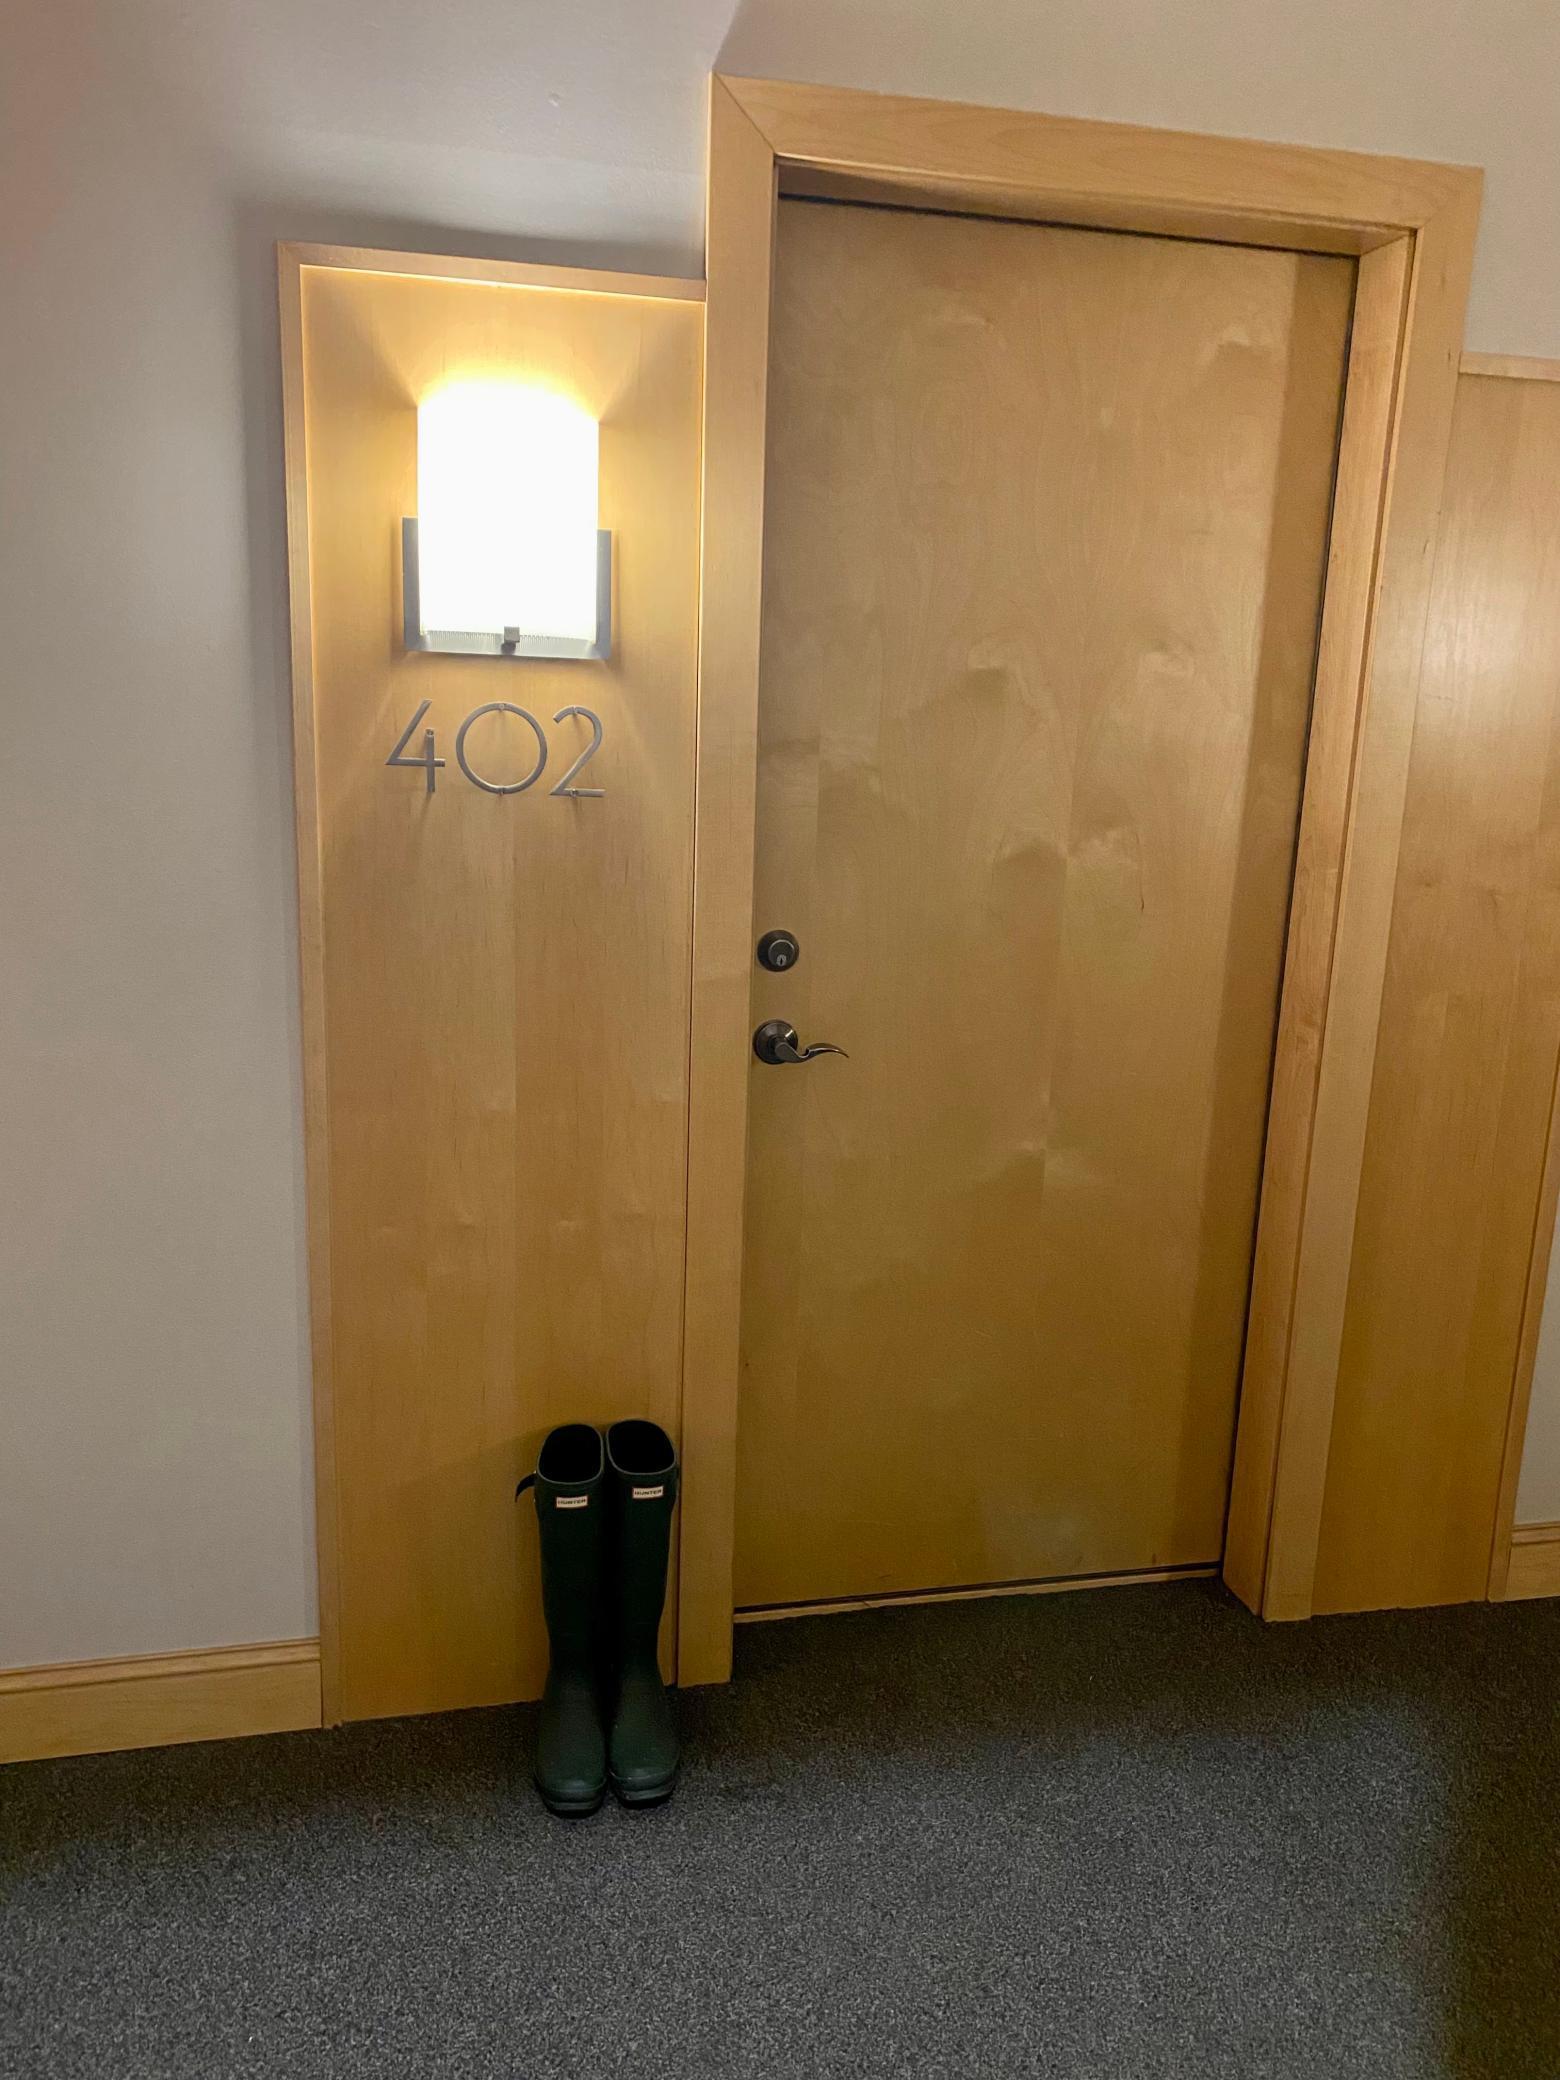
Active
$379,000
2
bds
|
2
ba
|
1,825
sqft
|
built
1896
402 Laurel Ave, Saint Paul, MN 55102
$-600
Cash flow
-8.3%
Cash-on-Cash Return
3.8%
Cap rate
0.7%
Rent to Value Ratio
Active
$240,000
2
bds
|
1
ba
|
896
sqft
|
built
1912
1251 Sherburne Ave, Saint Paul, MN 55104
$-386
Cash flow
-8.4%
Cash-on-Cash Return
3.8%
Cap rate
0.7%
Rent to Value Ratio
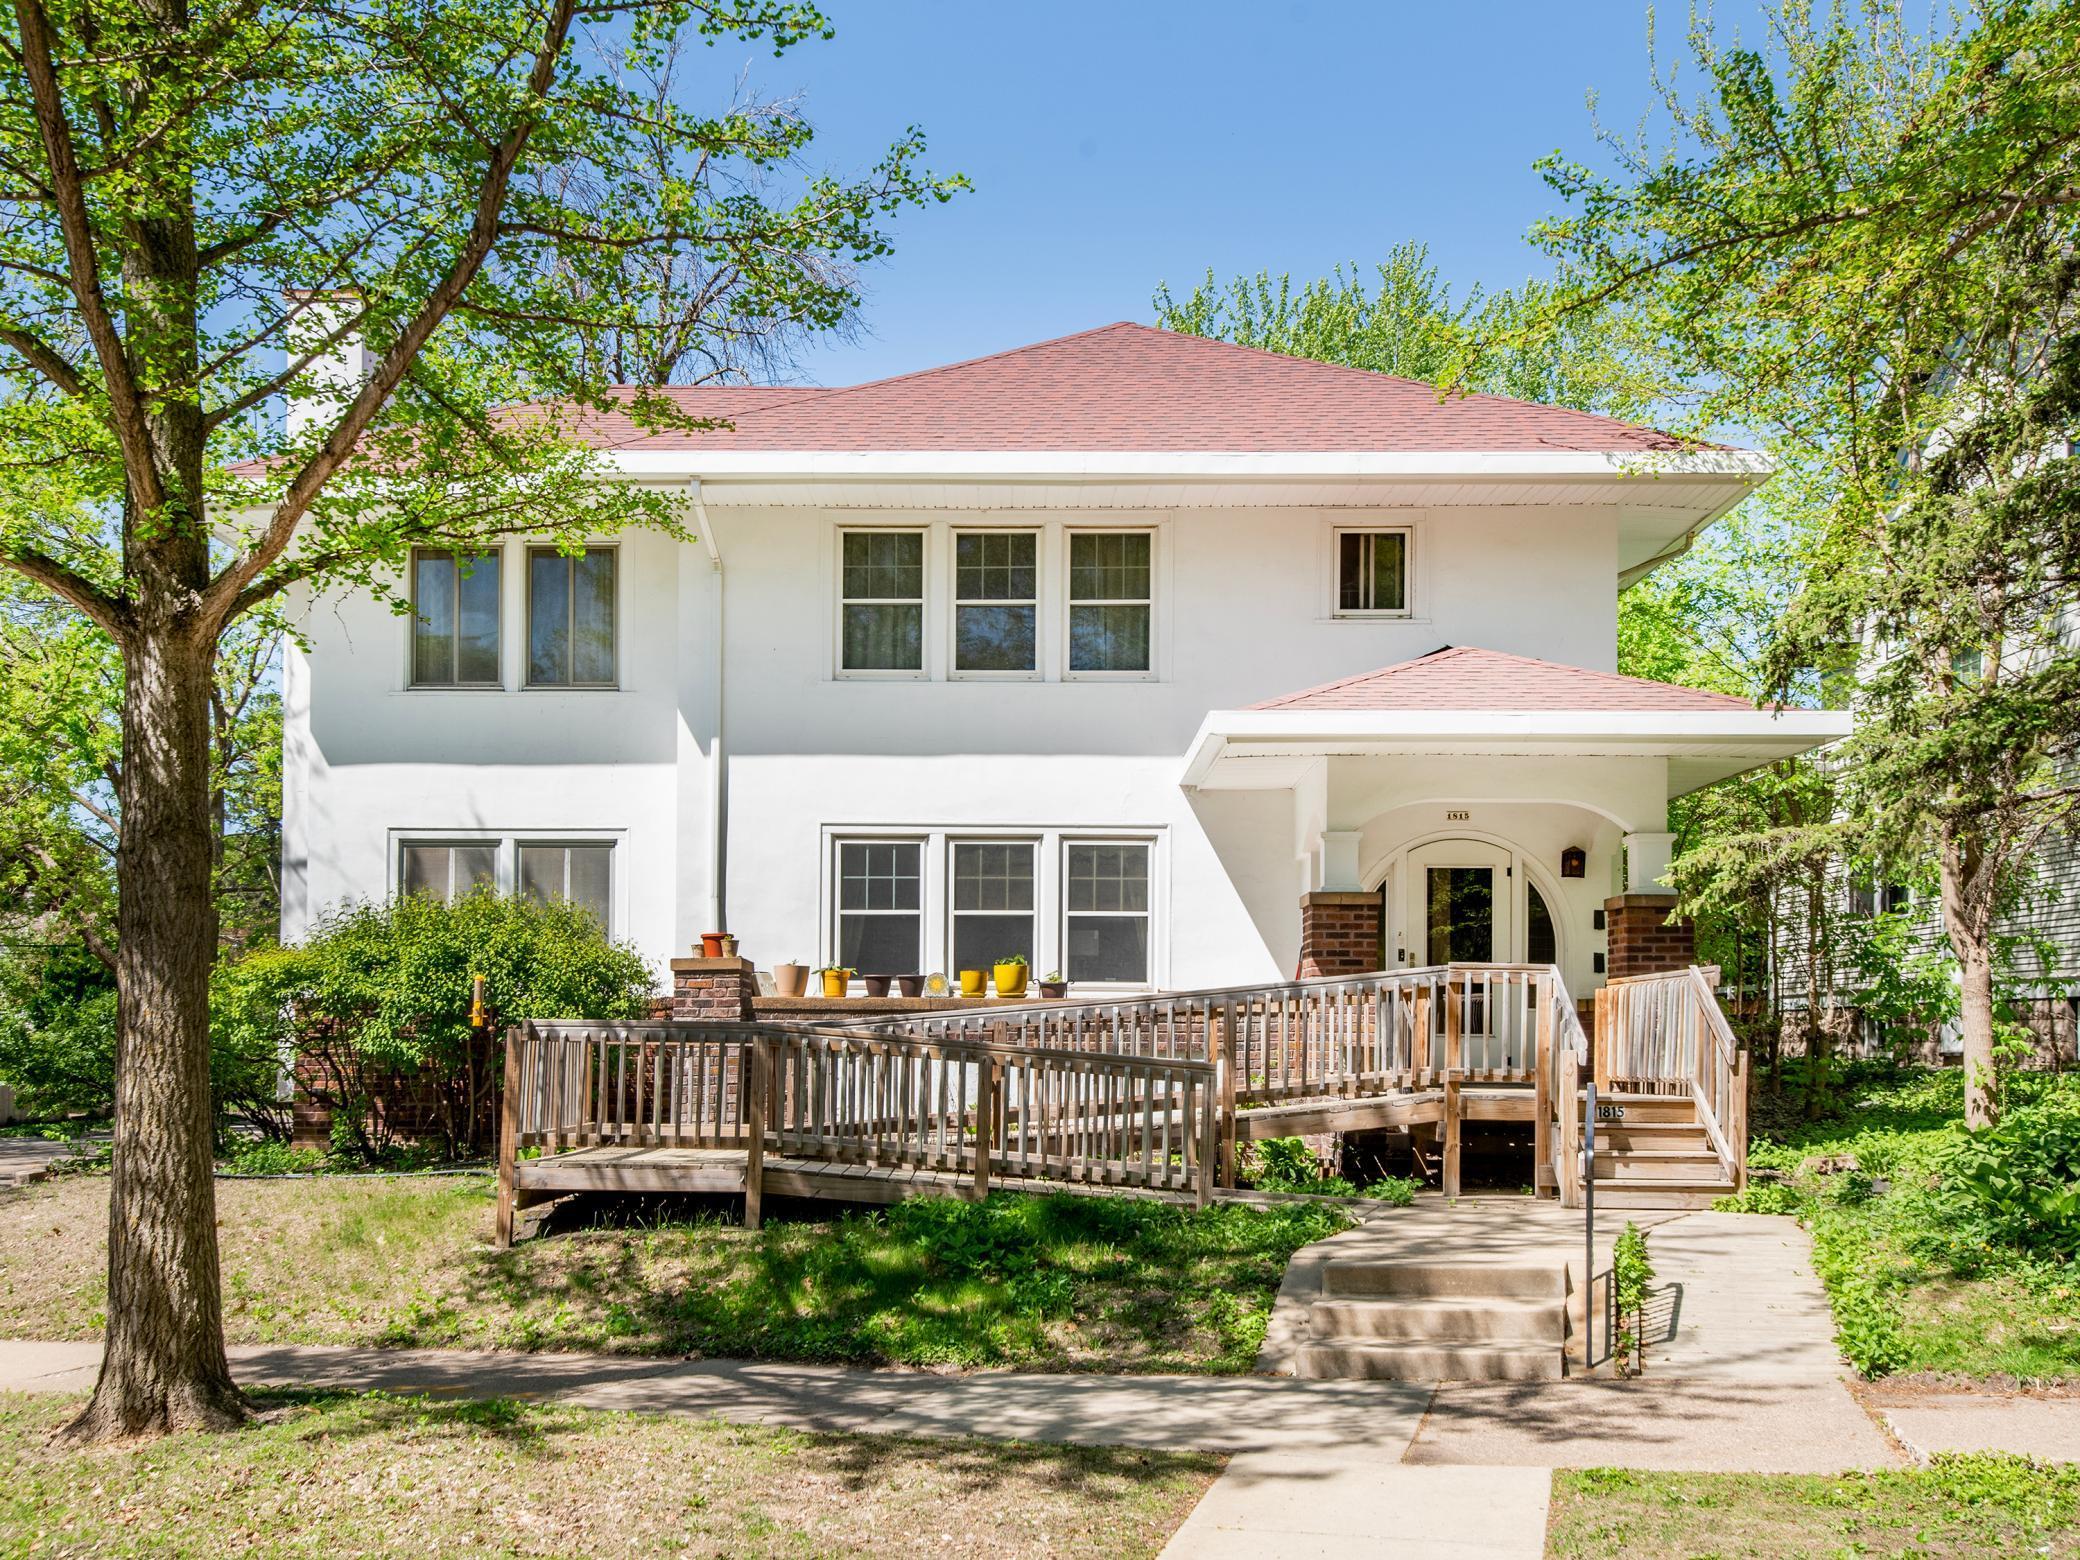
Active
$768,000
8
bds
|
4
ba
|
3,850
sqft
|
built
1923
1815 Goodrich Ave, Saint Paul, MN 55105
$-3,145
Cash flow
-21.4%
Cash-on-Cash Return
0.8%
Cap rate
0.3%
Rent to Value Ratio
Active
$300,000
2
bds
|
2
ba
|
1,878
sqft
|
built
1912
1324 Marshall Ave, Saint Paul, MN 55104
$-195
Cash flow
-3.4%
Cash-on-Cash Return
4.9%
Cap rate
0.8%
Rent to Value Ratio