Saline, MI Investment Properties for Sale
Browse homes for sale and investment properties in Saline, MI. Refine your search by price, property type, or more.
Best cash flowing properties in Saline, MI
Active
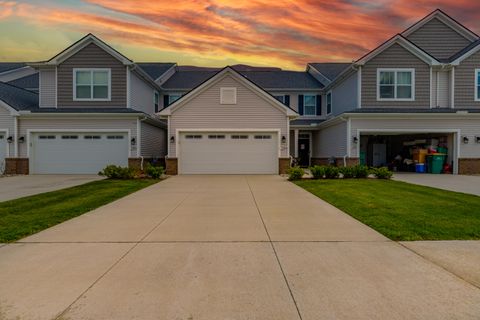
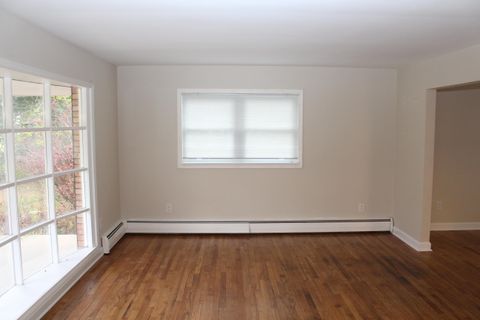
$325,000
2
bds
|
3
ba
|
1,558
sqft
|
built
2022
1003 Saltsprings Dr, Saline, MI 48176
$-185
Cash flow
-3.0%
Cash-on-Cash Return
5.5%
Cap rate
0.8%
Rent to Value Ratio
Active
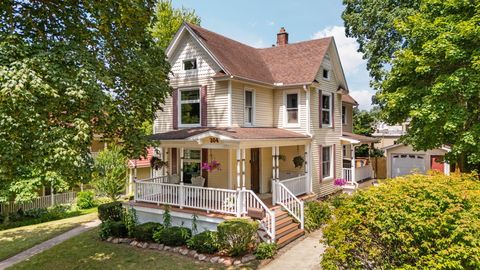
$475,000
4
bds
|
3
ba
|
2,290
sqft
|
built
1910
204 W Henry St, Saline, MI 48176
$-225
Cash flow
-2.5%
Cash-on-Cash Return
5.6%
Cap rate
0.7%
Rent to Value Ratio
19 out of 22 properties for sale in Saline, MI
Limited Results Shown
Create a free account, or log in to reveal all property listings and enjoy the complete experience.
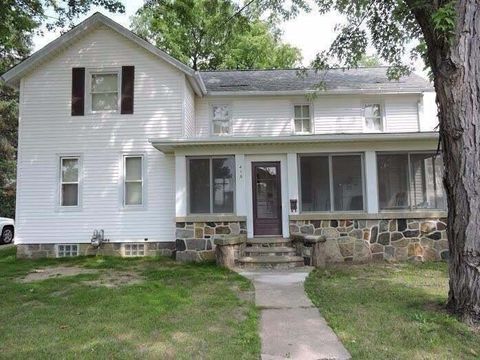
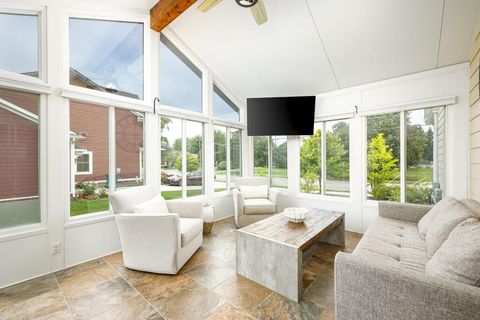
Active
$305,500
4
bds
|
2
ba
|
1,972
sqft
|
built
1880
410 N Ann Arbor St, Saline, MI 48176
$-261
Cash flow
-4.5%
Cash-on-Cash Return
5.1%
Cap rate
0.9%
Rent to Value Ratio

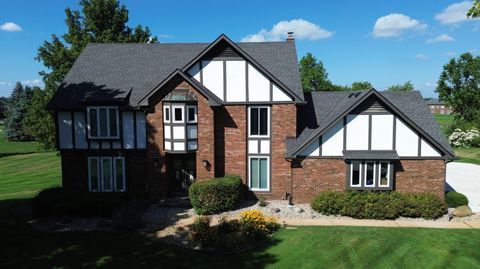
Active
$675,000
4
bds
|
4
ba
|
2,499
sqft
|
built
1992
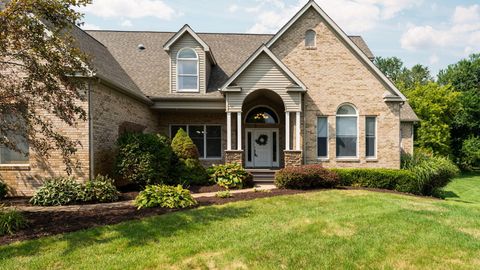
7144 Hunter Ridge Ct, Saline, MI 48176
$-1,810
Cash flow
-14.0%
Cash-on-Cash Return
2.9%
Cap rate
0.5%
Rent to Value Ratio
Active
$520,000
4
bds
|
4
ba
|
2,328
sqft
|
built
2018
407 W Bennett St, Saline, MI 48176
$-1,710
Cash flow
-17.2%
Cash-on-Cash Return
2.2%
Cap rate
0.5%
Rent to Value Ratio
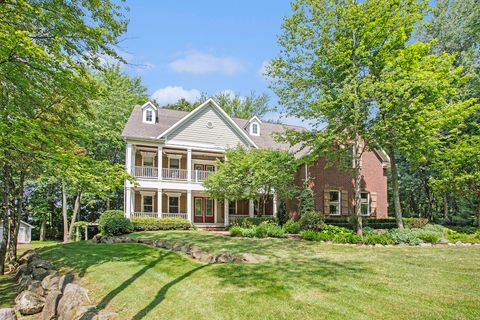
Active
$735,000
5
bds
|
4
ba
|
4,723
sqft
|
built
2004
9069 Emerson Dr, Saline, MI 48176
$-2,133
Cash flow
-15.1%
Cash-on-Cash Return
2.7%
Cap rate
0.5%
Rent to Value Ratio
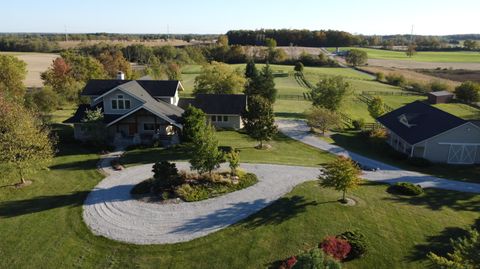
Active
$875,000
4
bds
|
4
ba
|
4,521
sqft
|
built
1998
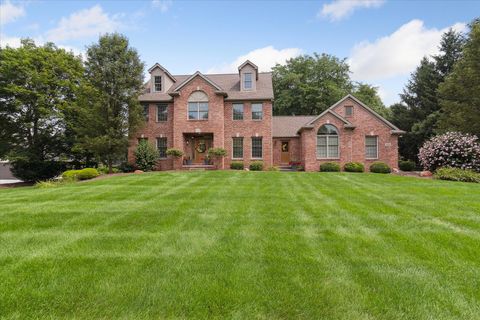
9559 Sherwood Dr, Saline, MI 48176
$-2,414
Cash flow
-14.4%
Cash-on-Cash Return
2.8%
Cap rate
0.5%
Rent to Value Ratio

Active
$550,000
3
bds
|
2
ba
|
2,472
sqft
|
built
1979
7241 S Green Hills Dr, Saline, MI 48176
$-1,350
Cash flow
-12.8%
Cash-on-Cash Return
3.2%
Cap rate
0.5%
Rent to Value Ratio
Active
$535,000
4
bds
|
3
ba
|
2,695
sqft
|
built
1969
3540 Meadow Ln, Saline, MI 48176
$-848
Cash flow
-8.3%
Cash-on-Cash Return
4.2%
Cap rate
0.7%
Rent to Value Ratio

Active
$283,000
3
bds
|
1
ba
|
1,044
sqft
|
built
1951
315 Spring St, Saline, MI 48176
$-684
Cash flow
-12.6%
Cash-on-Cash Return
3.2%
Cap rate
0.6%
Rent to Value Ratio

Active
$440,000
4
bds
|
3
ba
|
2,408
sqft
|
built
1993
1101 Heritage Dr, Saline, MI 48176
$-943
Cash flow
-11.2%
Cash-on-Cash Return
3.6%
Cap rate
0.7%
Rent to Value Ratio
Active
$325,000
3
bds
|
3
ba
|
2,010
sqft
|
built
2003
217 Old Creek Dr, Saline, MI 48176
$-768
Cash flow
-12.3%
Cash-on-Cash Return
3.3%
Cap rate
0.8%
Rent to Value Ratio

Active
$369,900
3
bds
|
2
ba
|
2,025
sqft
|
built
1869
9148 Austin Rd, Saline, MI 48176
$-523
Cash flow
-7.4%
Cash-on-Cash Return
4.5%
Cap rate
0.7%
Rent to Value Ratio
Active
$540,000
5
bds
|
3
ba
|
2,740
sqft
|
built
1970
9370 Moon Rd, Saline, MI 48176
$-1,598
Cash flow
-15.4%
Cash-on-Cash Return
2.6%
Cap rate
0.6%
Rent to Value Ratio

Active
$335,000
3
bds
|
3
ba
|
2,232
sqft
|
built
2004
237 Old Creek Dr, Saline, MI 48176
$-945
Cash flow
-14.7%
Cash-on-Cash Return
2.8%
Cap rate
0.7%
Rent to Value Ratio

Active
$669,000
4
bds
|
4
ba
|
2,744
sqft
|
built
1984
5206 Village Rd, Saline, MI 48176
$-1,574
Cash flow
-12.3%
Cash-on-Cash Return
3.3%
Cap rate
0.5%
Rent to Value Ratio
Active
$993,000
5
bds
|
4
ba
|
3,821
sqft
|
built
1980
5449 Countryside Dr, Saline, MI 48176
$-3,485
Cash flow
-18.3%
Cash-on-Cash Return
1.9%
Cap rate
0.4%
Rent to Value Ratio
Active
$1,250,000
4
bds
|
6
ba
|
6,429
sqft
|
built
2005
290 Shelby Ct, Saline, MI 48176
$-4,413
Cash flow
-18.4%
Cash-on-Cash Return
1.9%
Cap rate
0.4%
Rent to Value Ratio
Active
$1,323,000
4
bds
|
4
ba
|
5,160
sqft
|
built
2001
5665 Braun Rd, Saline, MI 48176
$-4,358
Cash flow
-17.2%
Cash-on-Cash Return
2.2%
Cap rate
0.4%
Rent to Value Ratio