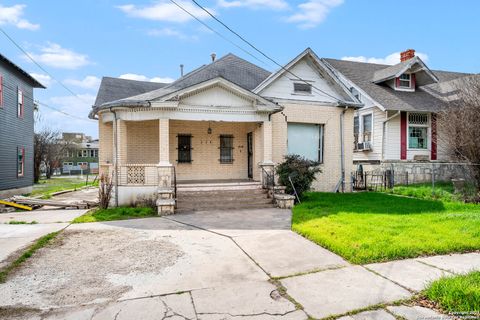
San Antonio, TX Investment Properties for Sale
Browse homes for sale and investment properties in San Antonio, TX. Refine your search by price, property type, or more.
Best cash flowing properties in San Antonio, TX
Active
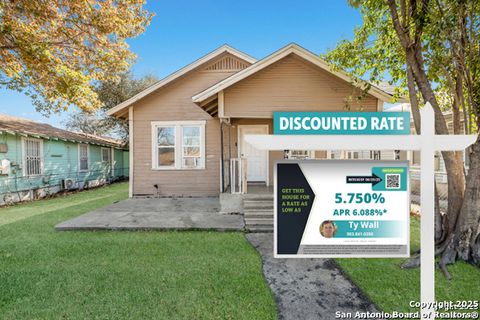
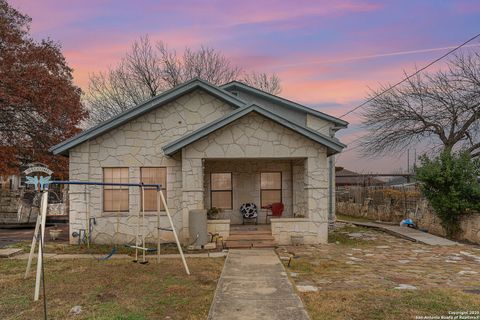
$117,499
3
bds
|
1
ba
|
840
sqft
|
built
1915
826 Lombrano St, San Antonio, TX 78207
$38
Cash flow
1.7%
Cash-on-Cash Return
6.6%
Cap rate
1.2%
Rent to Value Ratio
Active
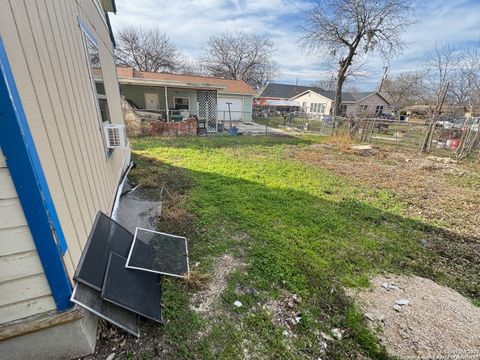
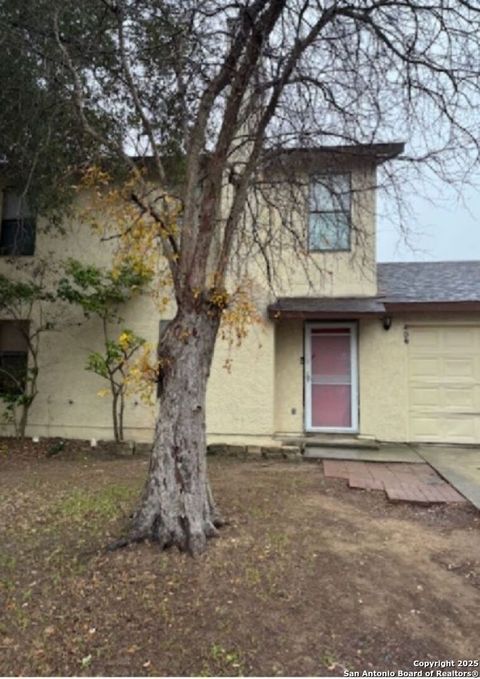
$99,980
2
bds
|
1
ba
|
840
sqft
|
built
1950
1409 Flanders Ave, San Antonio, TX 78211
$-81
Cash flow
-4.2%
Cash-on-Cash Return
5.3%
Cap rate
1.0%
Rent to Value Ratio
6,094 out of 6,389 properties for sale in San Antonio, TX
Limited Results Shown
Create a free account, or log in to reveal all property listings and enjoy the complete experience.
Active
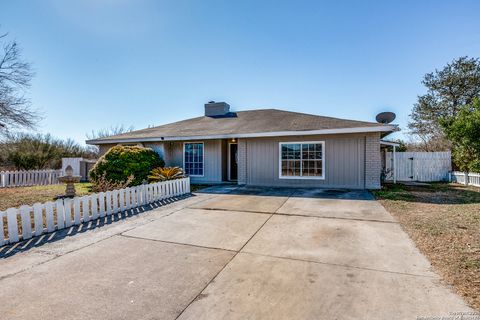
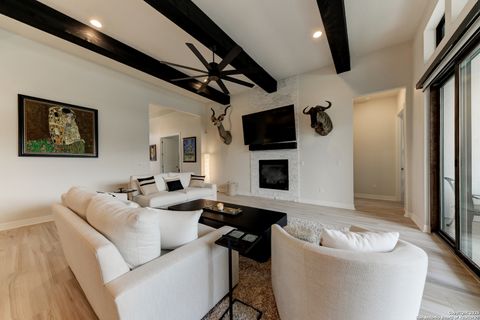
$229,900
4
bds
|
2
ba
|
1,732
sqft
|
built
1974
4603 Brierbrook, San Antonio, TX 78238
$-47,970
Cash flow
-1088.6%
Cash-on-Cash Return
-244.1%
Cap rate
0.8%
Rent to Value Ratio
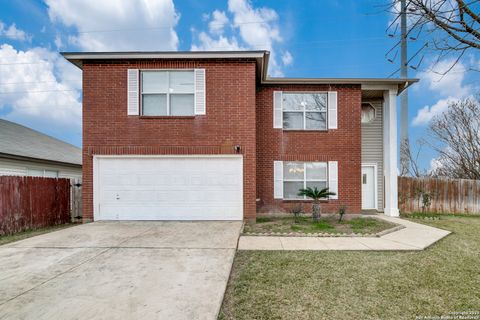
Active
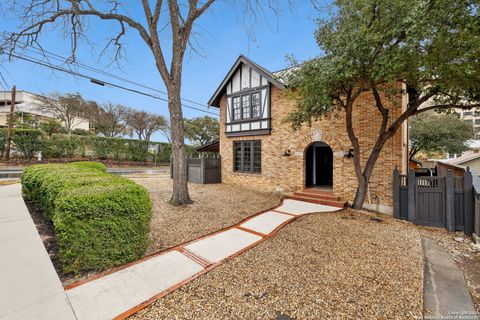
$875,000
6
bds
|
0
ba
|
3,259
sqft
|
built
1963
162 Davis Ct, San Antonio, TX 78209
$-4,246
Cash flow
-25.3%
Cash-on-Cash Return
0.4%
Cap rate
0.3%
Rent to Value Ratio
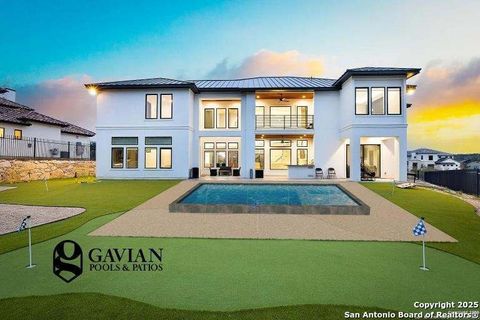
Active
$1,849,900
6
bds
|
6
ba
|
6,092
sqft
|
built
2022
10206 Kendall Cyn, San Antonio, TX 78255
$-6,896
Cash flow
-19.4%
Cash-on-Cash Return
1.8%
Cap rate
0.4%
Rent to Value Ratio
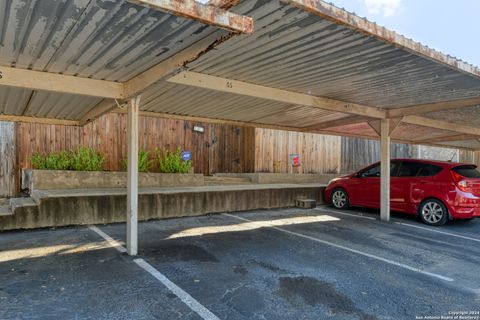
Active
$150,000
2
bds
|
3
ba
|
1,109
sqft
|
built
1967
6718 Callaghan Rd, San Antonio, TX 78229
$-444
Cash flow
-15.4%
Cash-on-Cash Return
2.7%
Cap rate
0.9%
Rent to Value Ratio
Active
$99,980
2
bds
|
1
ba
|
840
sqft
|
built
1950
1409 Flanders Ave, San Antonio, TX 78211
$-81
Cash flow
-4.2%
Cash-on-Cash Return
5.3%
Cap rate
1.0%
Rent to Value Ratio

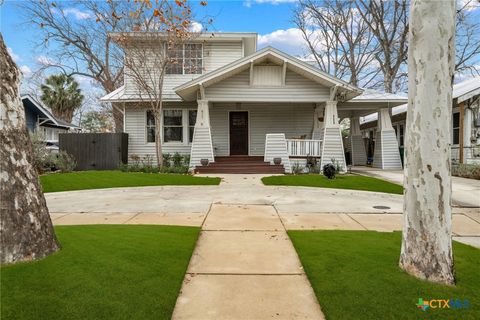
Active
$225,000
4
bds
|
1
ba
|
1,318
sqft
|
built
1920
241 Keller St, San Antonio, TX 78204
$-924
Cash flow
-21.4%
Cash-on-Cash Return
1.3%
Cap rate
0.6%
Rent to Value Ratio

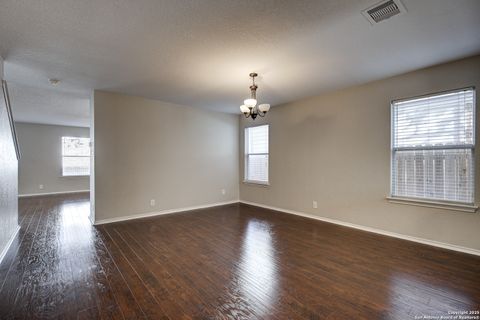
Active
$833,000
5
bds
|
2
ba
|
2,857
sqft
|
built
2000
4714 Del Mar Trl, San Antonio, TX 78251
$-4,727
Cash flow
-29.6%
Cash-on-Cash Return
-0.5%
Cap rate
0.2%
Rent to Value Ratio
Active
$649,000
4
bds
|
3
ba
|
2,506
sqft
|
built
1922
617 E Park Ave, San Antonio, TX 78212
$-2,331
Cash flow
-18.7%
Cash-on-Cash Return
2.0%
Cap rate
0.5%
Rent to Value Ratio
Active
$300,000
3
bds
|
3
ba
|
2,175
sqft
|
built
2005
4931 Bending Trl, San Antonio, TX 78247
$-968
Cash flow
-16.8%
Cash-on-Cash Return
2.4%
Cap rate
0.6%
Rent to Value Ratio

Active
$1,370,000
7
bds
|
8
ba
|
5,349
sqft
|
built
2010
334 Springside, San Antonio, TX 78260
$-4,862
Cash flow
-18.5%
Cash-on-Cash Return
2.0%
Cap rate
0.4%
Rent to Value Ratio
Active
$265,000
4
bds
|
3
ba
|
2,233
sqft
|
built
1985
239 Azucena St, San Antonio, TX 78237
$-357
Cash flow
-7.0%
Cash-on-Cash Return
4.6%
Cap rate
0.8%
Rent to Value Ratio
Active
$153,000
3
bds
|
2
ba
|
1,008
sqft
|
built
1985
409 Rene Levy, San Antonio, TX 78227
$-210
Cash flow
-7.2%
Cash-on-Cash Return
4.6%
Cap rate
0.8%
Rent to Value Ratio
Active
$720,000
3
bds
|
4
ba
|
2,928
sqft
|
built
2022
23339 Grande Vis, San Antonio, TX 78261
$-2,216
Cash flow
-16.1%
Cash-on-Cash Return
2.6%
Cap rate
0.6%
Rent to Value Ratio
Active
$265,000
4
bds
|
3
ba
|
2,144
sqft
|
built
2000
7910 Dawntree Pl, San Antonio, TX 78251
$-733
Cash flow
-14.4%
Cash-on-Cash Return
2.9%
Cap rate
0.7%
Rent to Value Ratio
Active
$535,000
4
bds
|
3
ba
|
3,136
sqft
|
built
1976
15809 Horse Creek St, San Antonio, TX 78232
$-1,368
Cash flow
-13.3%
Cash-on-Cash Return
3.2%
Cap rate
0.7%
Rent to Value Ratio
Active
$297,000
3
bds
|
3
ba
|
1,844
sqft
|
built
2011
10714 Ranchland Fox, San Antonio, TX 78245
$-626
Cash flow
-11.0%
Cash-on-Cash Return
3.7%
Cap rate
0.7%
Rent to Value Ratio
Active
$565,000
4
bds
|
3
ba
|
3,161
sqft
|
built
2010
25906 Coronado Rdg, San Antonio, TX 78260
$-1,500
Cash flow
-13.9%
Cash-on-Cash Return
3.1%
Cap rate
0.6%
Rent to Value Ratio
Active
$200,000
4
bds
|
2
ba
|
2,332
sqft
|
built
1906
909 W Elsmere Pl, San Antonio, TX 78201
$-412
Cash flow
-10.7%
Cash-on-Cash Return
3.8%
Cap rate
0.9%
Rent to Value Ratio
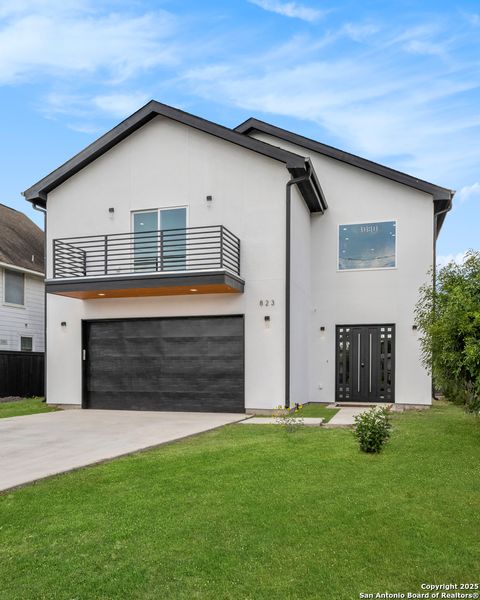
Active
$500,000
4
bds
|
4
ba
|
3,164
sqft
|
built
2022
823 W Pyron Ave, San Antonio, TX 78221
$-656
Cash flow
-6.8%
Cash-on-Cash Return
4.7%
Cap rate
0.7%
Rent to Value Ratio

Active
$299,000
4
bds
|
4
ba
|
1,756
sqft
|
built
2013
102 Cornell Ave, San Antonio, TX 78201
$-181
Cash flow
-3.2%
Cash-on-Cash Return
5.5%
Cap rate
0.7%
Rent to Value Ratio

Active
$175,000
3
bds
|
1
ba
|
1,332
sqft
|
built
1930
512 Nevada St, San Antonio, TX 78203
$-276
Cash flow
-8.2%
Cash-on-Cash Return
4.4%
Cap rate
1.0%
Rent to Value Ratio
Active
$192,000
3
bds
|
3
ba
|
1,750
sqft
|
built
1973
6746 Crown Rdg, San Antonio, TX 78239
$-421
Cash flow
-11.4%
Cash-on-Cash Return
3.6%
Cap rate
0.9%
Rent to Value Ratio
Active
$285,000
3
bds
|
2
ba
|
1,884
sqft
|
built
1910
218 E Park Ave, San Antonio, TX 78212
$-649
Cash flow
-11.9%
Cash-on-Cash Return
3.5%
Cap rate
0.7%
Rent to Value Ratio
Active
$299,000
1
bds
|
1
ba
|
796
sqft
|
built
2008
831 S Flores St, San Antonio, TX 78204
$-1,255
Cash flow
-21.9%
Cash-on-Cash Return
1.2%
Cap rate
0.6%
Rent to Value Ratio

Active
$899,500
5
bds
|
3
ba
|
2,928
sqft
|
built
1906
805 Nolan St, San Antonio, TX 78202
$-4,169
Cash flow
-24.2%
Cash-on-Cash Return
0.7%
Cap rate
0.4%
Rent to Value Ratio
Active
$117,499
3
bds
|
1
ba
|
840
sqft
|
built
1915
826 Lombrano St, San Antonio, TX 78207
$38
Cash flow
1.7%
Cash-on-Cash Return
6.6%
Cap rate
1.2%
Rent to Value Ratio
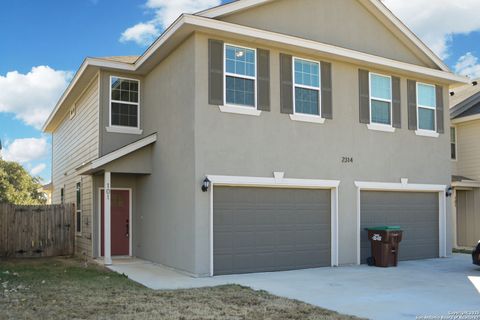
Active
$499,000
6
bds
|
0
ba
|
2,712
sqft
|
built
2021
2314 Tulipwood Cv, San Antonio, TX 78245
$-2,256
Cash flow
-23.6%
Cash-on-Cash Return
0.8%
Cap rate
0.3%
Rent to Value Ratio
Active
$439,900
4
bds
|
3
ba
|
2,693
sqft
|
built
2022
2102 Dalhart, San Antonio, TX 78253
$-1,473
Cash flow
-17.5%
Cash-on-Cash Return
2.2%
Cap rate
0.6%
Rent to Value Ratio
Active
$394,500
3
bds
|
2
ba
|
1,538
sqft
|
built
1967
9207 Whitehall St, San Antonio, TX 78216
$-1,030
Cash flow
-13.6%
Cash-on-Cash Return
3.1%
Cap rate
0.6%
Rent to Value Ratio

Active
$3,499,900
6
bds
|
8
ba
|
7,166
sqft
|
built
2015
202 Wellesley Loop, San Antonio, TX 78231
$-19,710
Cash flow
-29.4%
Cash-on-Cash Return
-0.5%
Cap rate
0.1%
Rent to Value Ratio
Active
$249,900
3
bds
|
2
ba
|
1,536
sqft
|
built
1908
622 W Baylor, San Antonio, TX 78204
$-543
Cash flow
-11.3%
Cash-on-Cash Return
3.7%
Cap rate
0.6%
Rent to Value Ratio
Active
$195,000
3
bds
|
2
ba
|
1,774
sqft
|
built
1986
8040 Dove Trail Dr, San Antonio, TX 78244
$-288
Cash flow
-7.7%
Cash-on-Cash Return
4.5%
Cap rate
0.8%
Rent to Value Ratio
Active
$425,000
4
bds
|
3
ba
|
2,696
sqft
|
built
2022
5519 Jewel Curv, San Antonio, TX 78266
$-1,001
Cash flow
-12.3%
Cash-on-Cash Return
3.4%
Cap rate
0.7%
Rent to Value Ratio
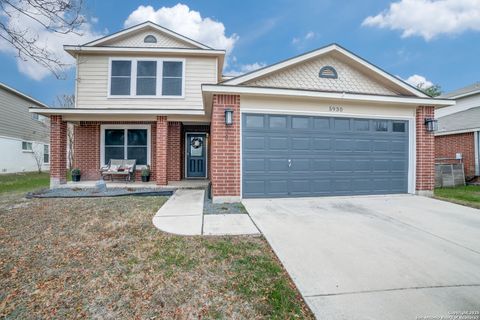
Active
$325,000
5
bds
|
3
ba
|
2,707
sqft
|
built
2002
5930 Oak Blossom, San Antonio, TX 78250
$-832
Cash flow
-13.4%
Cash-on-Cash Return
3.2%
Cap rate
0.7%
Rent to Value Ratio
Active
$379,900
3
bds
|
2
ba
|
1,945
sqft
|
built
2006
12515 Cascade Hls, San Antonio, TX 78253
$-1,145
Cash flow
-15.7%
Cash-on-Cash Return
2.6%
Cap rate
0.6%
Rent to Value Ratio
Active
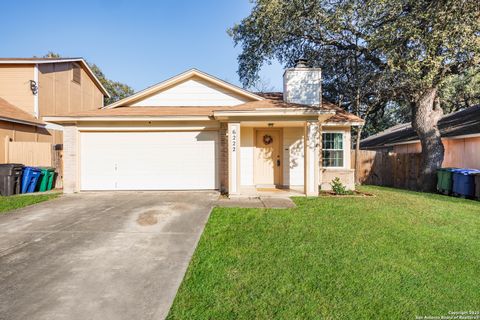
$228,000
3
bds
|
2
ba
|
1,104
sqft
|
built
1983
6222 Ridge Glade St, San Antonio, TX 78250
$-365
Cash flow
-8.4%
Cash-on-Cash Return
4.3%
Cap rate
0.8%
Rent to Value Ratio
Active
$934,999
4
bds
|
5
ba
|
4,055
sqft
|
built
2017
24207 Vecchio, San Antonio, TX 78260
$-3,358
Cash flow
-18.7%
Cash-on-Cash Return
2.0%
Cap rate
0.5%
Rent to Value Ratio
Active
$314,000
4
bds
|
3
ba
|
1,699
sqft
|
built
1999
22230 Goldcrest Run, San Antonio, TX 78260
$-663
Cash flow
-11.0%
Cash-on-Cash Return
3.7%
Cap rate
0.7%
Rent to Value Ratio
Active
$399,000
3
bds
|
3
ba
|
2,033
sqft
|
built
1974
7731 Broadway, San Antonio, TX 78209
$-1,520
Cash flow
-19.9%
Cash-on-Cash Return
1.7%
Cap rate
0.8%
Rent to Value Ratio
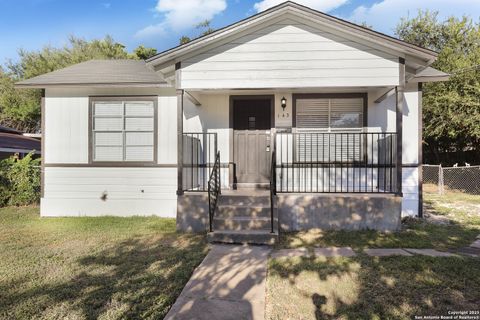
Active
$174,000
2
bds
|
1
ba
|
846
sqft
|
built
1952
143 Loma Park Dr, San Antonio, TX 78228
$-181
Cash flow
-5.4%
Cash-on-Cash Return
5.0%
Cap rate
0.8%
Rent to Value Ratio