San Antonio, TX Investment Properties for Sale
Browse homes for sale and investment properties in San Antonio, TX. Refine your search by price, property type, or more.
Best cash flowing properties in San Antonio, TX
Active
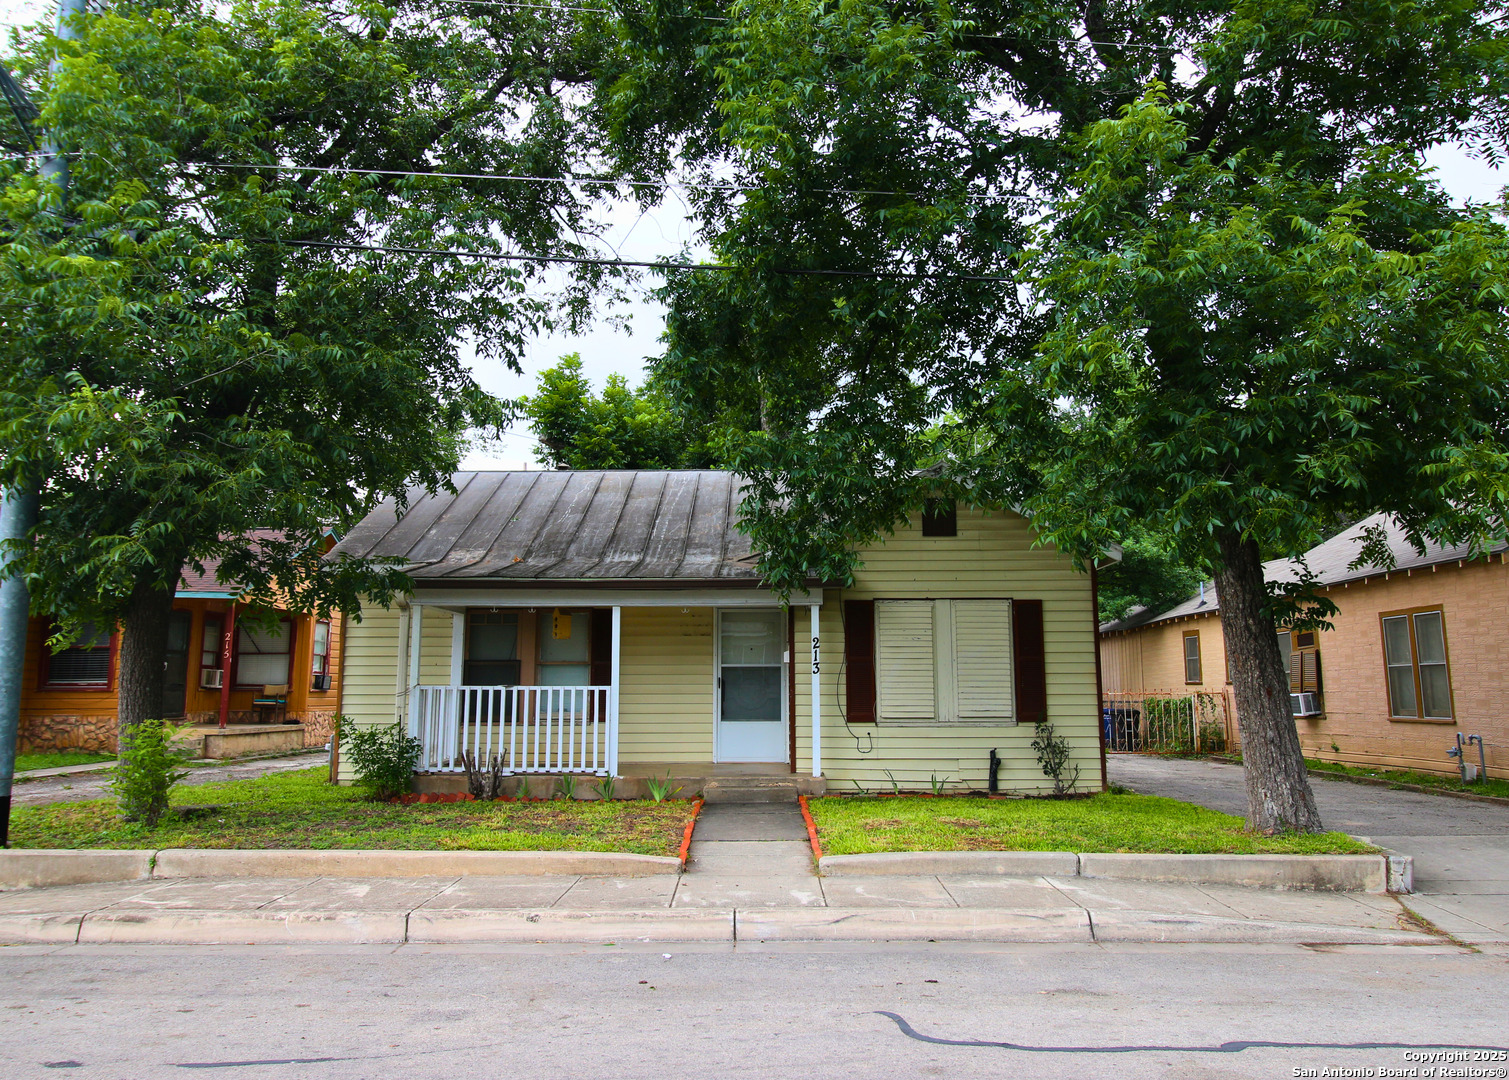
$156,000
3
bds
|
1
ba
|
1,200
sqft
|
built
1930
213 W Hart Ave, San Antonio, TX 78214
$-32
Cash flow
-1.1%
Cash-on-Cash Return
6.0%
Cap rate
1.0%
Rent to Value Ratio
Active
$175,000
3
bds
|
1
ba
|
918
sqft
|
built
1959
207 E Villaret Blvd, San Antonio, TX 78221
$-251
Cash flow
-7.5%
Cash-on-Cash Return
4.6%
Cap rate
0.8%
Rent to Value Ratio
5,832 out of 6,116 properties for sale in San Antonio, TX
Limited Results Shown
Create a free account, or log in to reveal all property listings and enjoy the complete experience.
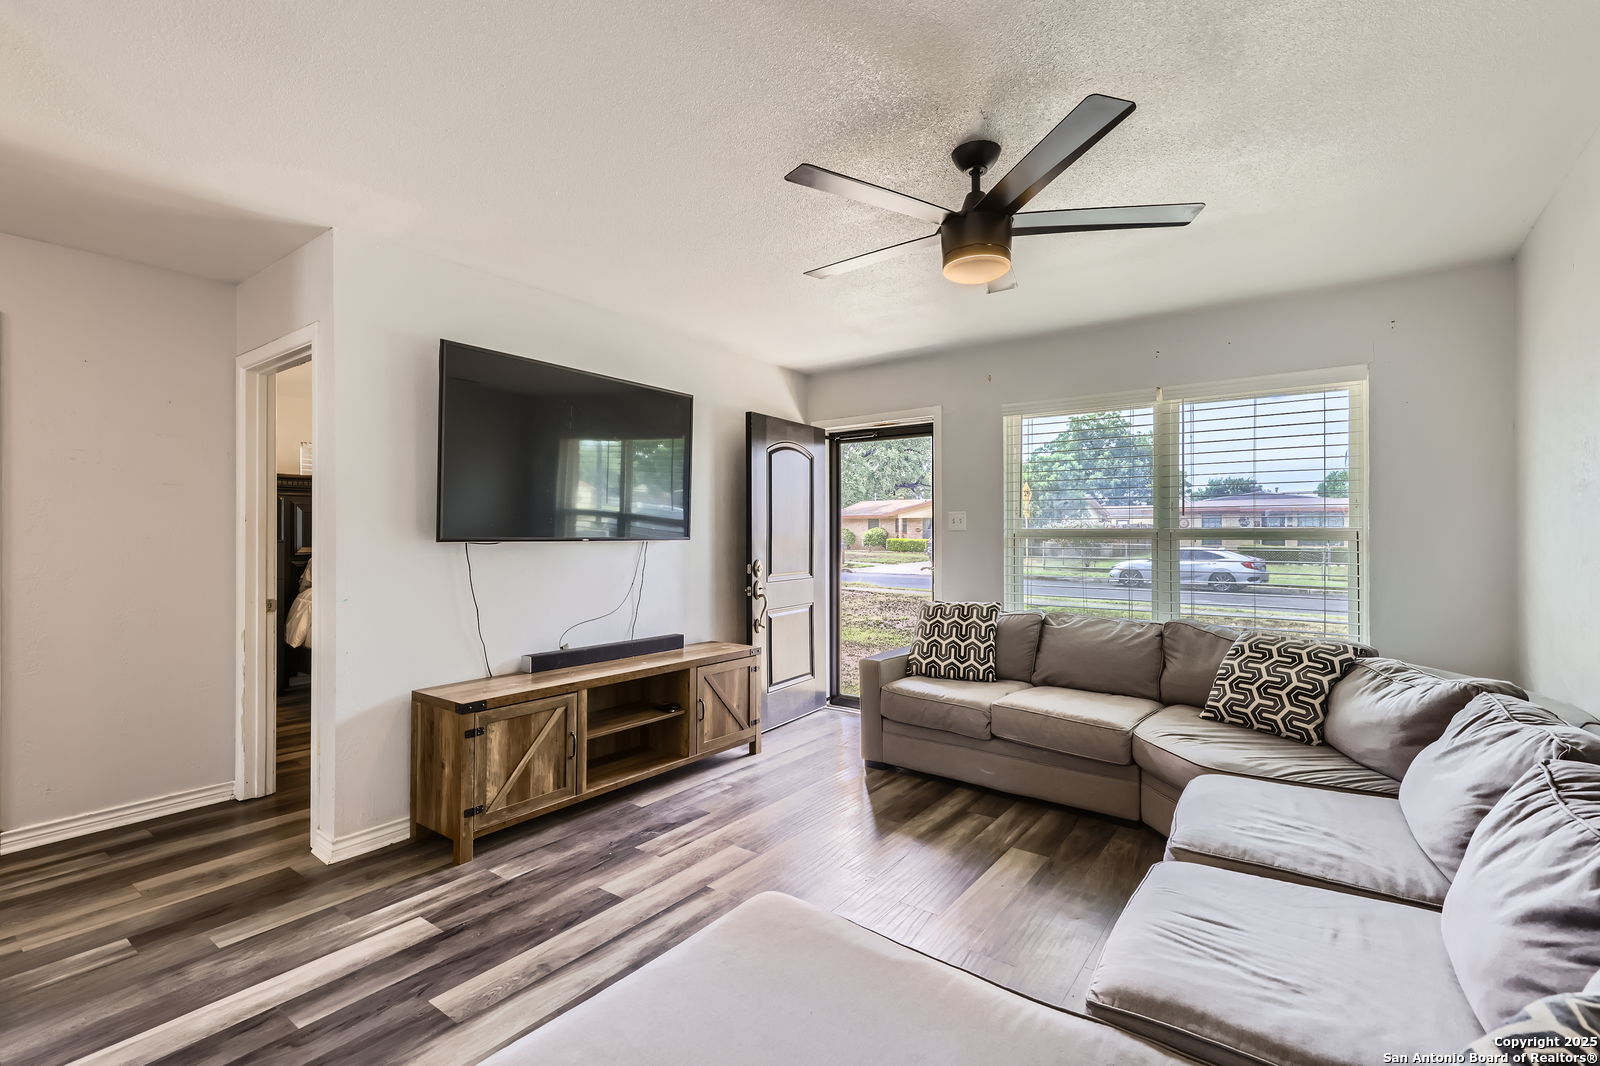
Active under contract
$269,998
4
bds
|
2
ba
|
1,733
sqft
|
built
2003
10518 Staggering Crk, San Antonio, TX 78254
$-739
Cash flow
-14.3%
Cash-on-Cash Return
3.0%
Cap rate
0.7%
Rent to Value Ratio
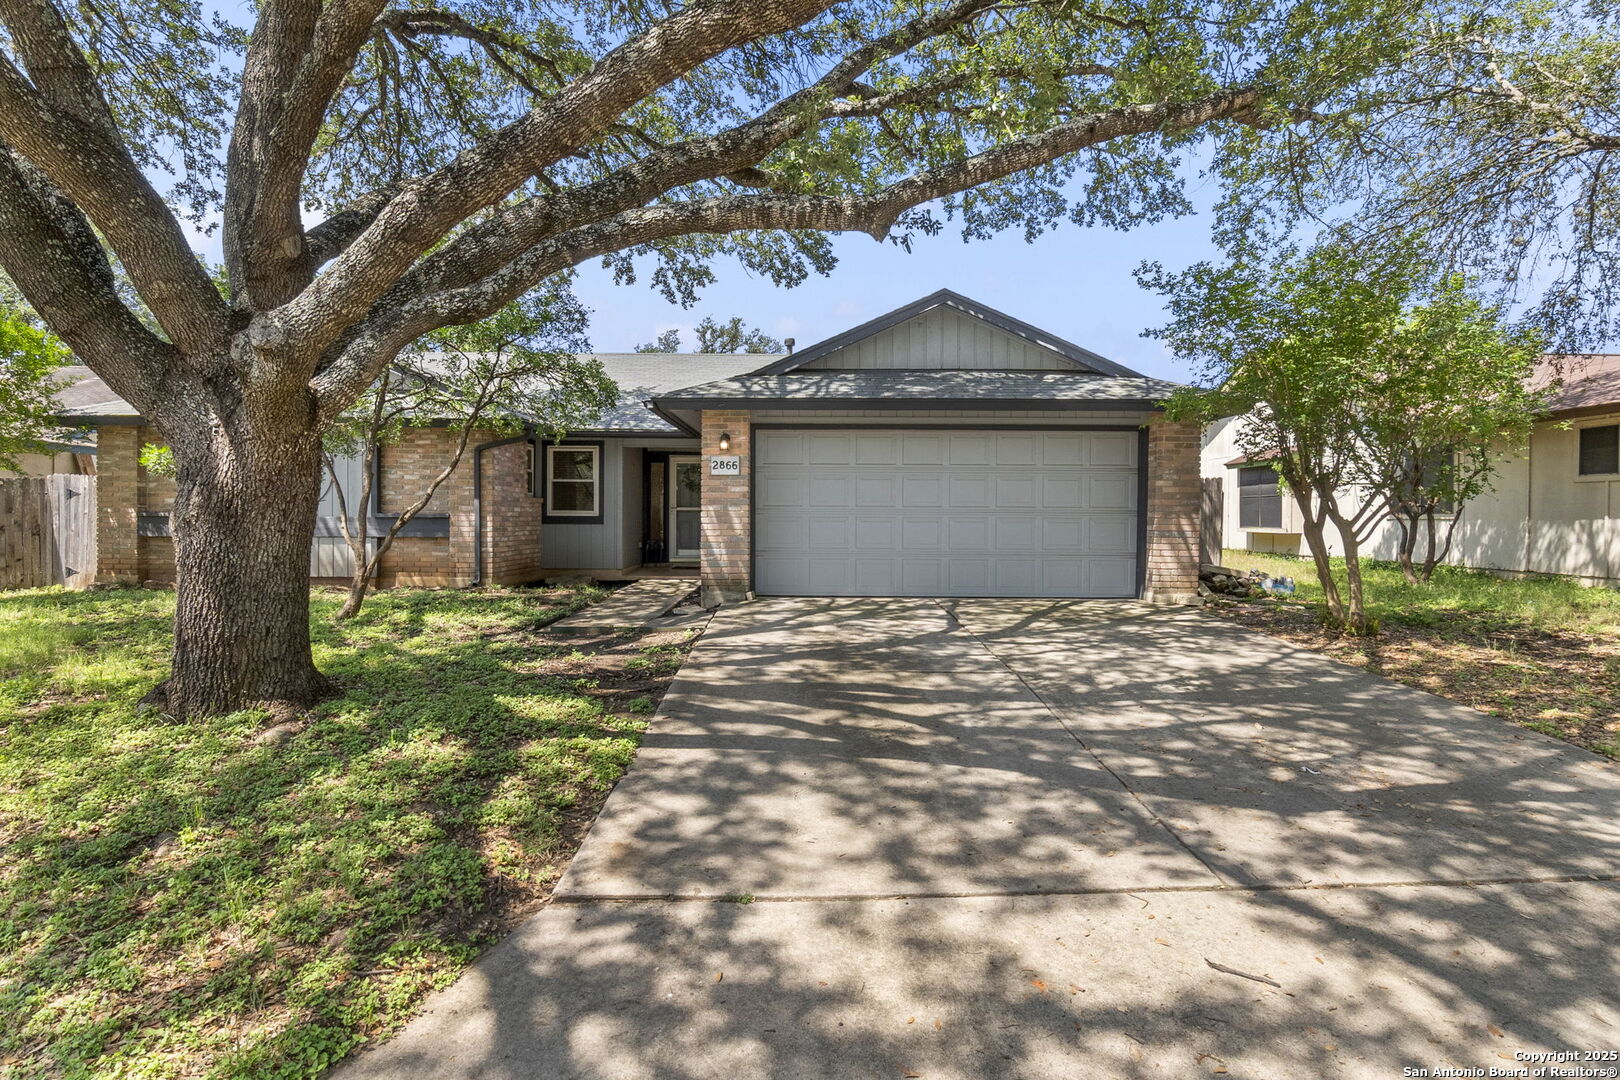
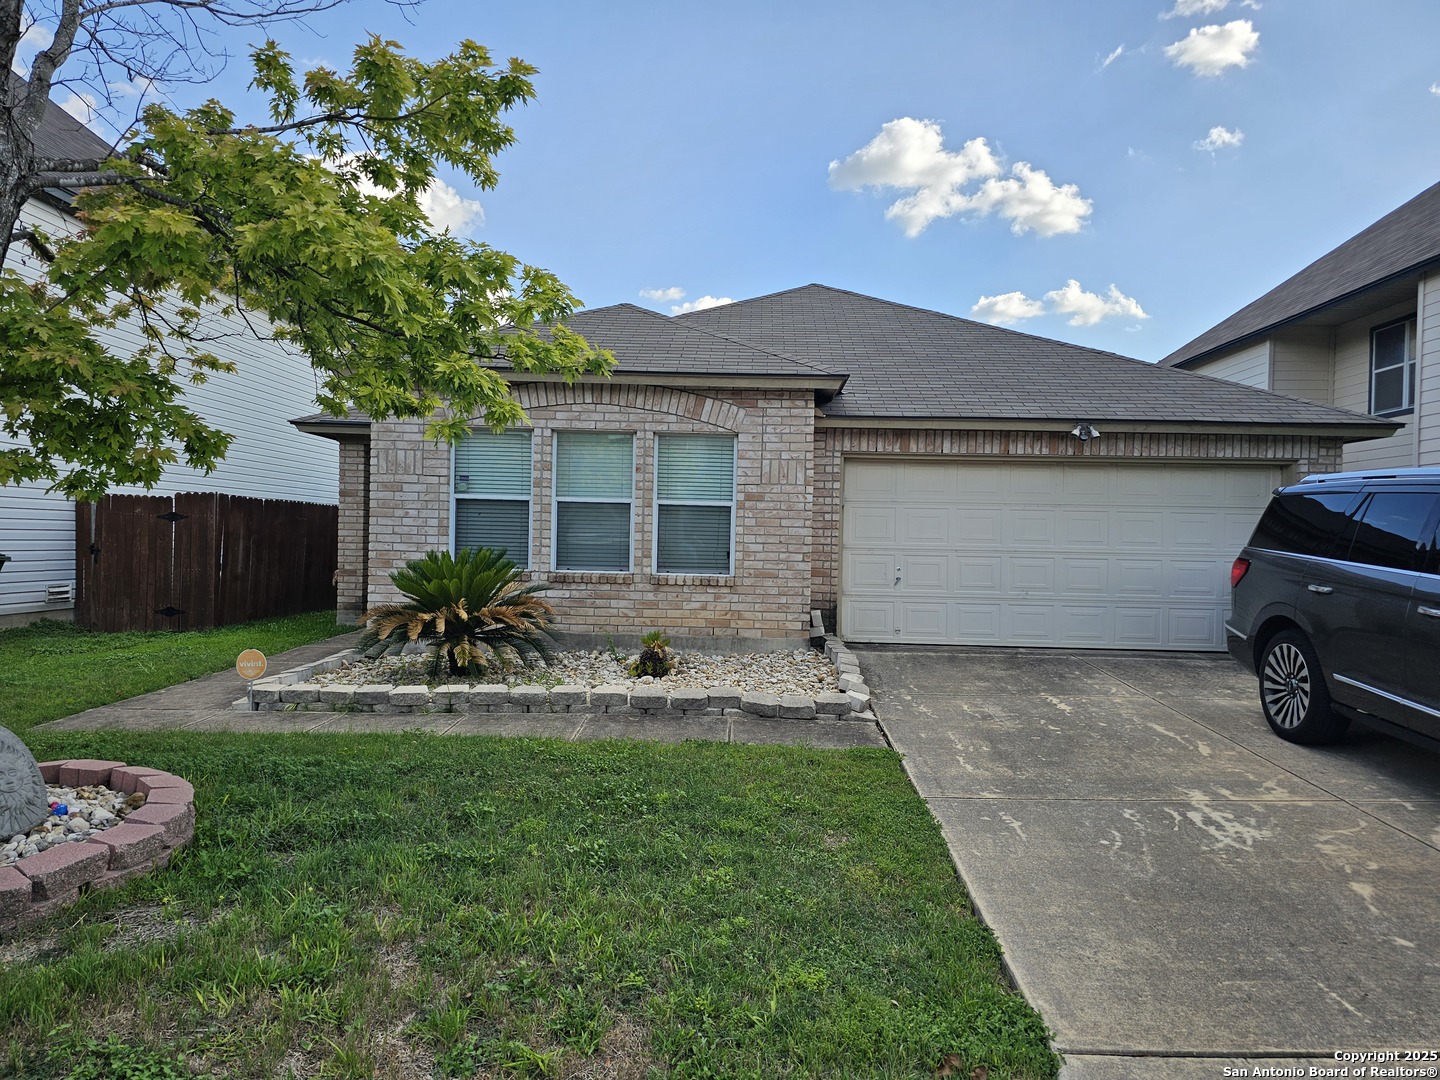
Active
$300,000
3
bds
|
2
ba
|
1,511
sqft
|
built
1983
2866 Burning Rock St, San Antonio, TX 78247
$-899
Cash flow
-15.6%
Cash-on-Cash Return
2.7%
Cap rate
0.6%
Rent to Value Ratio
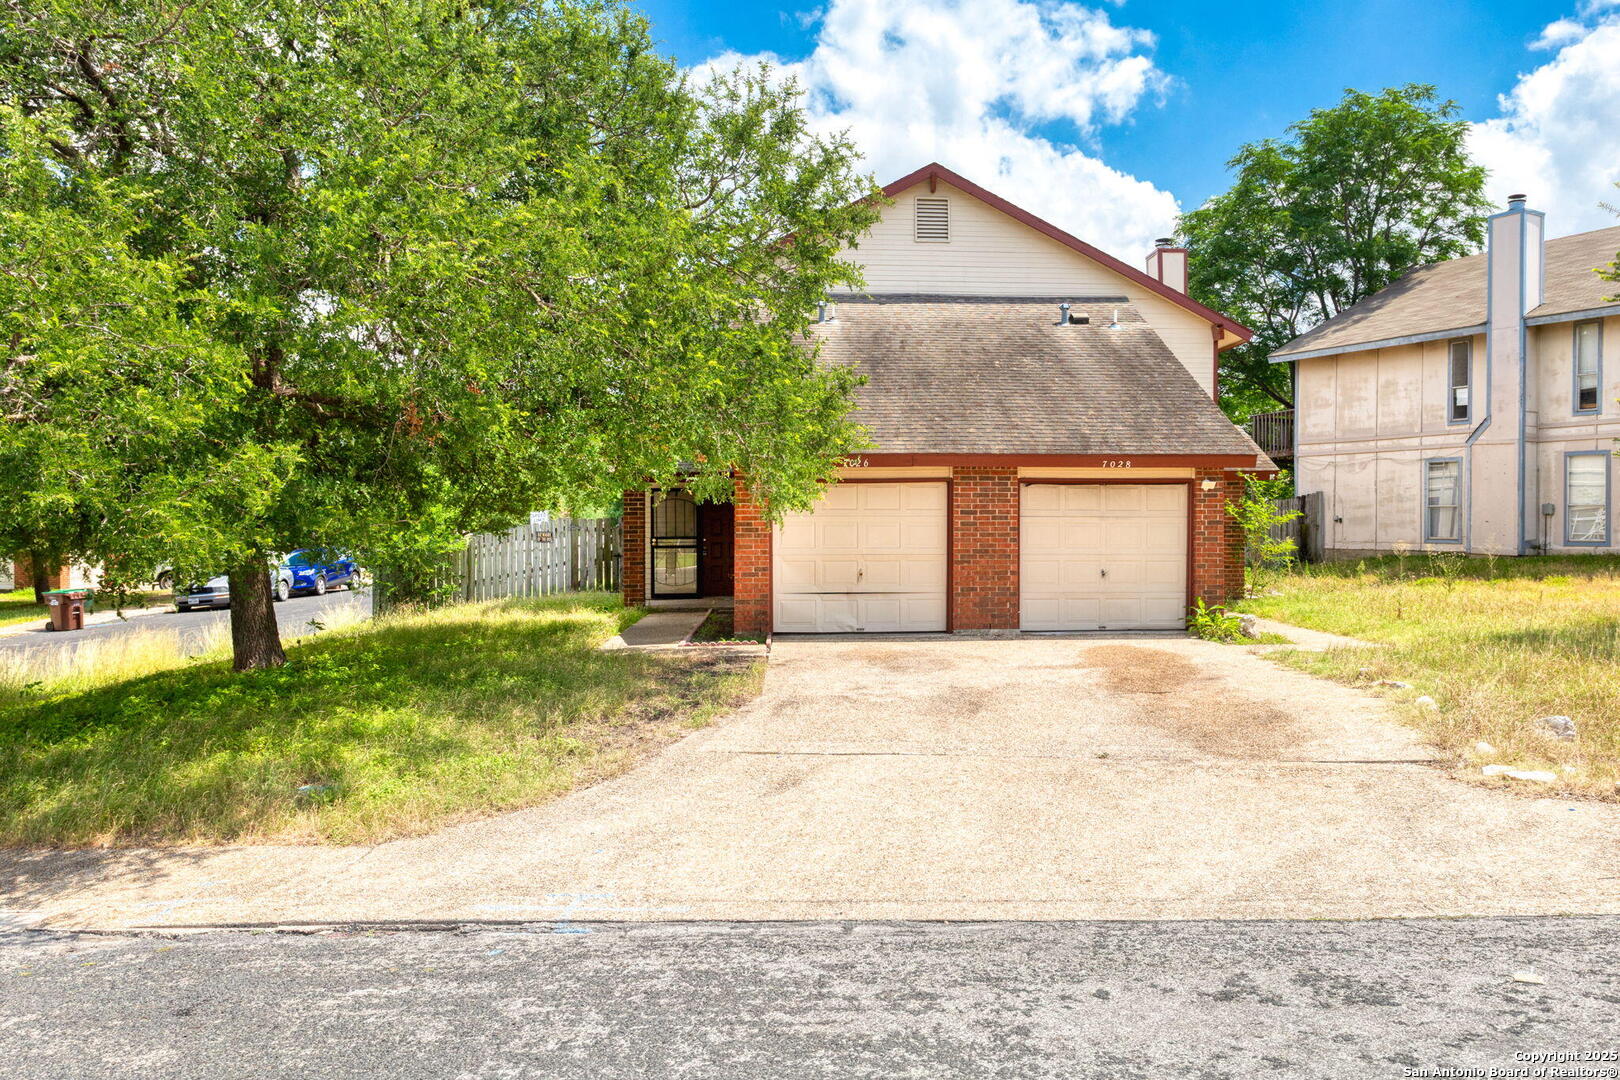
Active
$269,000
4
bds
|
0
ba
|
2,442
sqft
|
built
1984
7026 Elmbank, San Antonio, TX 78244
$-930
Cash flow
-18.0%
Cash-on-Cash Return
2.1%
Cap rate
0.5%
Rent to Value Ratio
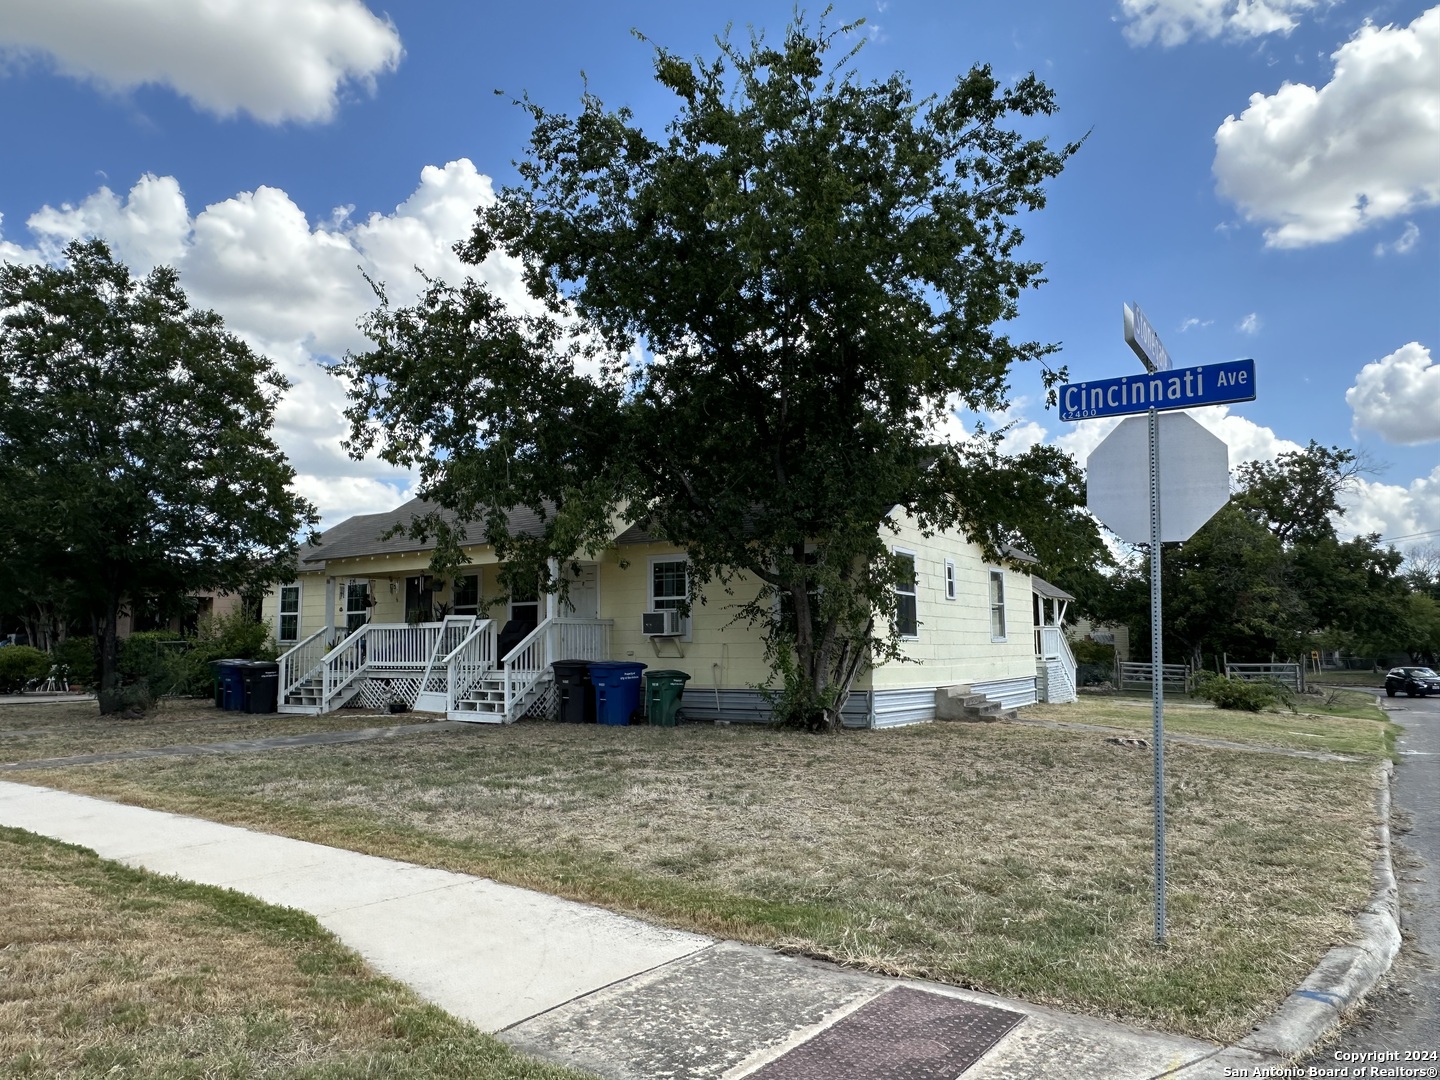
Active
$270,000
4
bds
|
0
ba
|
1,876
sqft
|
built
1948
2456 Cincinnati Ave, San Antonio, TX 78228
$-997
Cash flow
-19.3%
Cash-on-Cash Return
1.9%
Cap rate
0.4%
Rent to Value Ratio
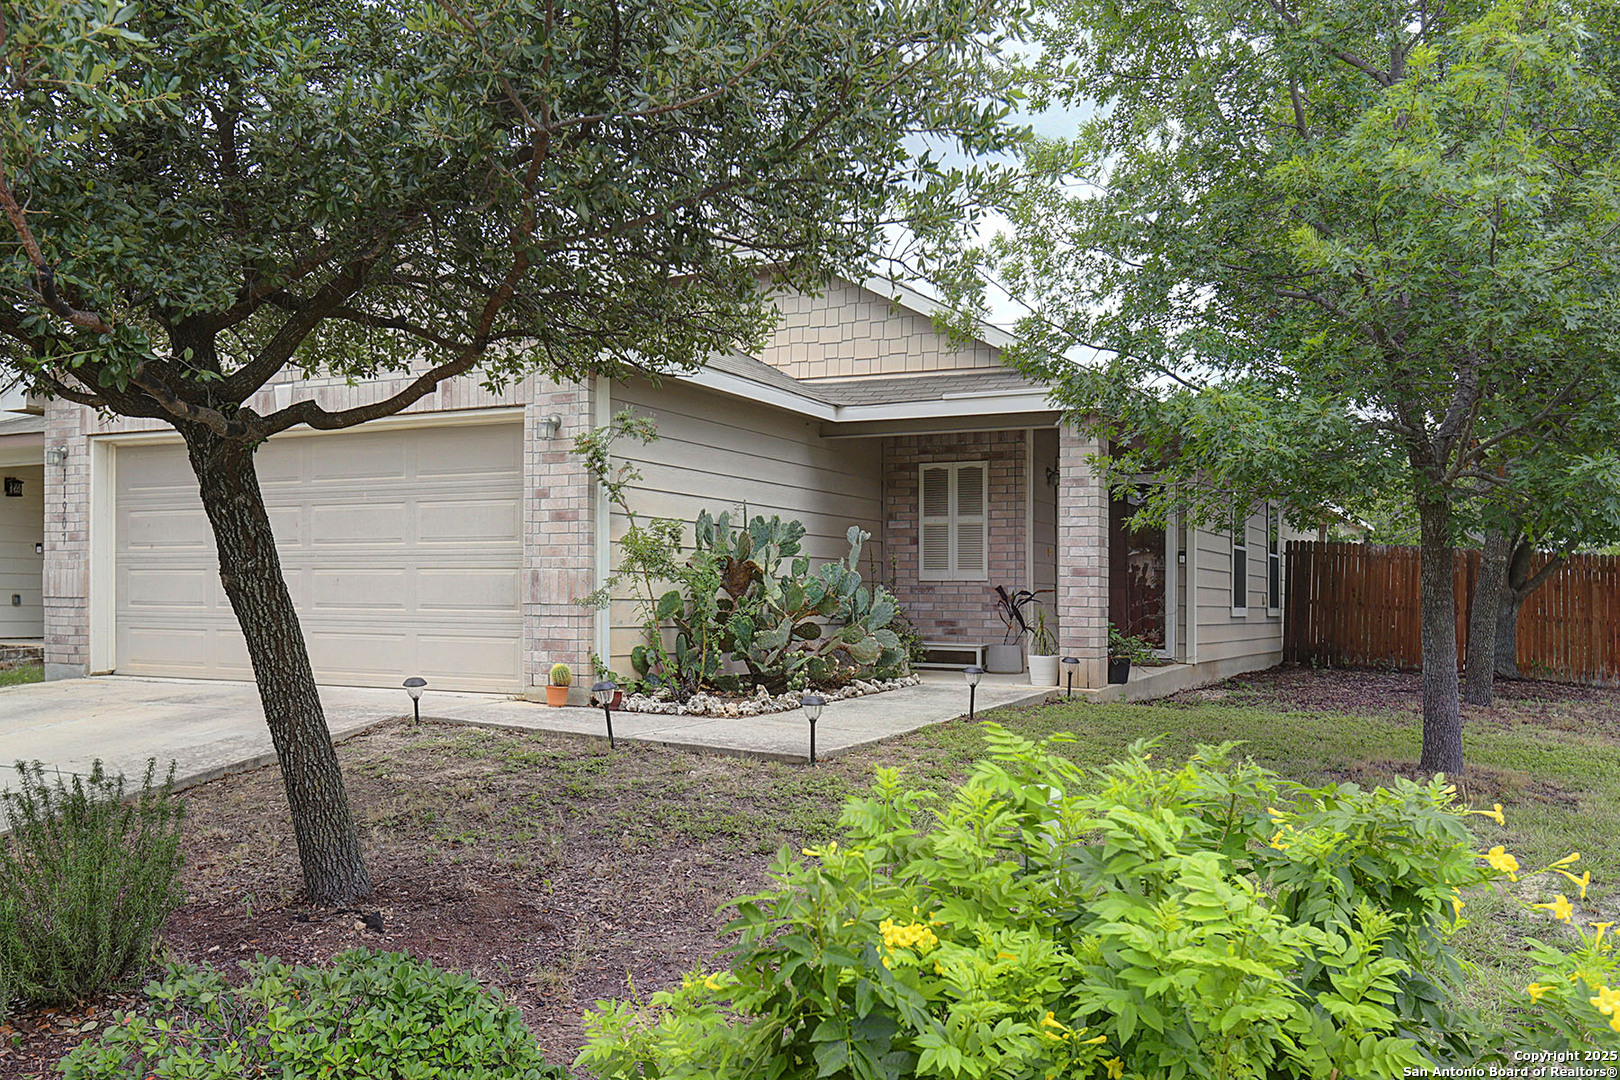
Active
$229,900
3
bds
|
2
ba
|
1,216
sqft
|
built
2012
11907 Pure Silver, San Antonio, TX 78254
$-445
Cash flow
-10.1%
Cash-on-Cash Return
4.0%
Cap rate
0.7%
Rent to Value Ratio
Active
$175,000
3
bds
|
1
ba
|
918
sqft
|
built
1959
207 E Villaret Blvd, San Antonio, TX 78221
$-251
Cash flow
-7.5%
Cash-on-Cash Return
4.6%
Cap rate
0.8%
Rent to Value Ratio
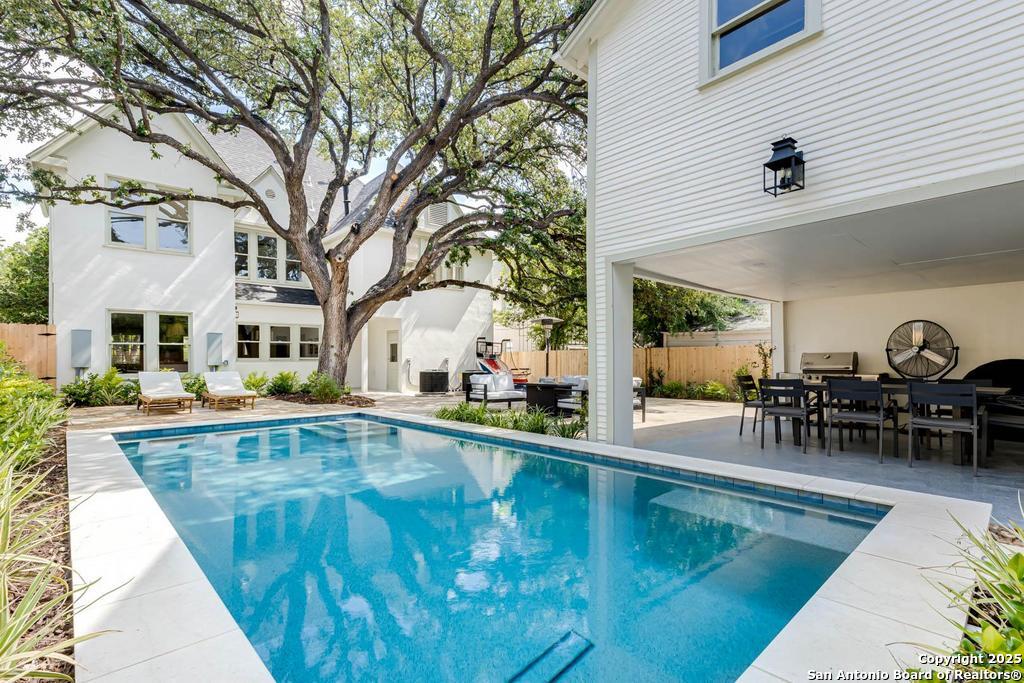
Active
$1,379,900
6
bds
|
6
ba
|
3,064
sqft
|
built
1927
264 E Lullwood Ave, San Antonio, TX 78212
$-7,445
Cash flow
-28.1%
Cash-on-Cash Return
-0.2%
Cap rate
0.1%
Rent to Value Ratio
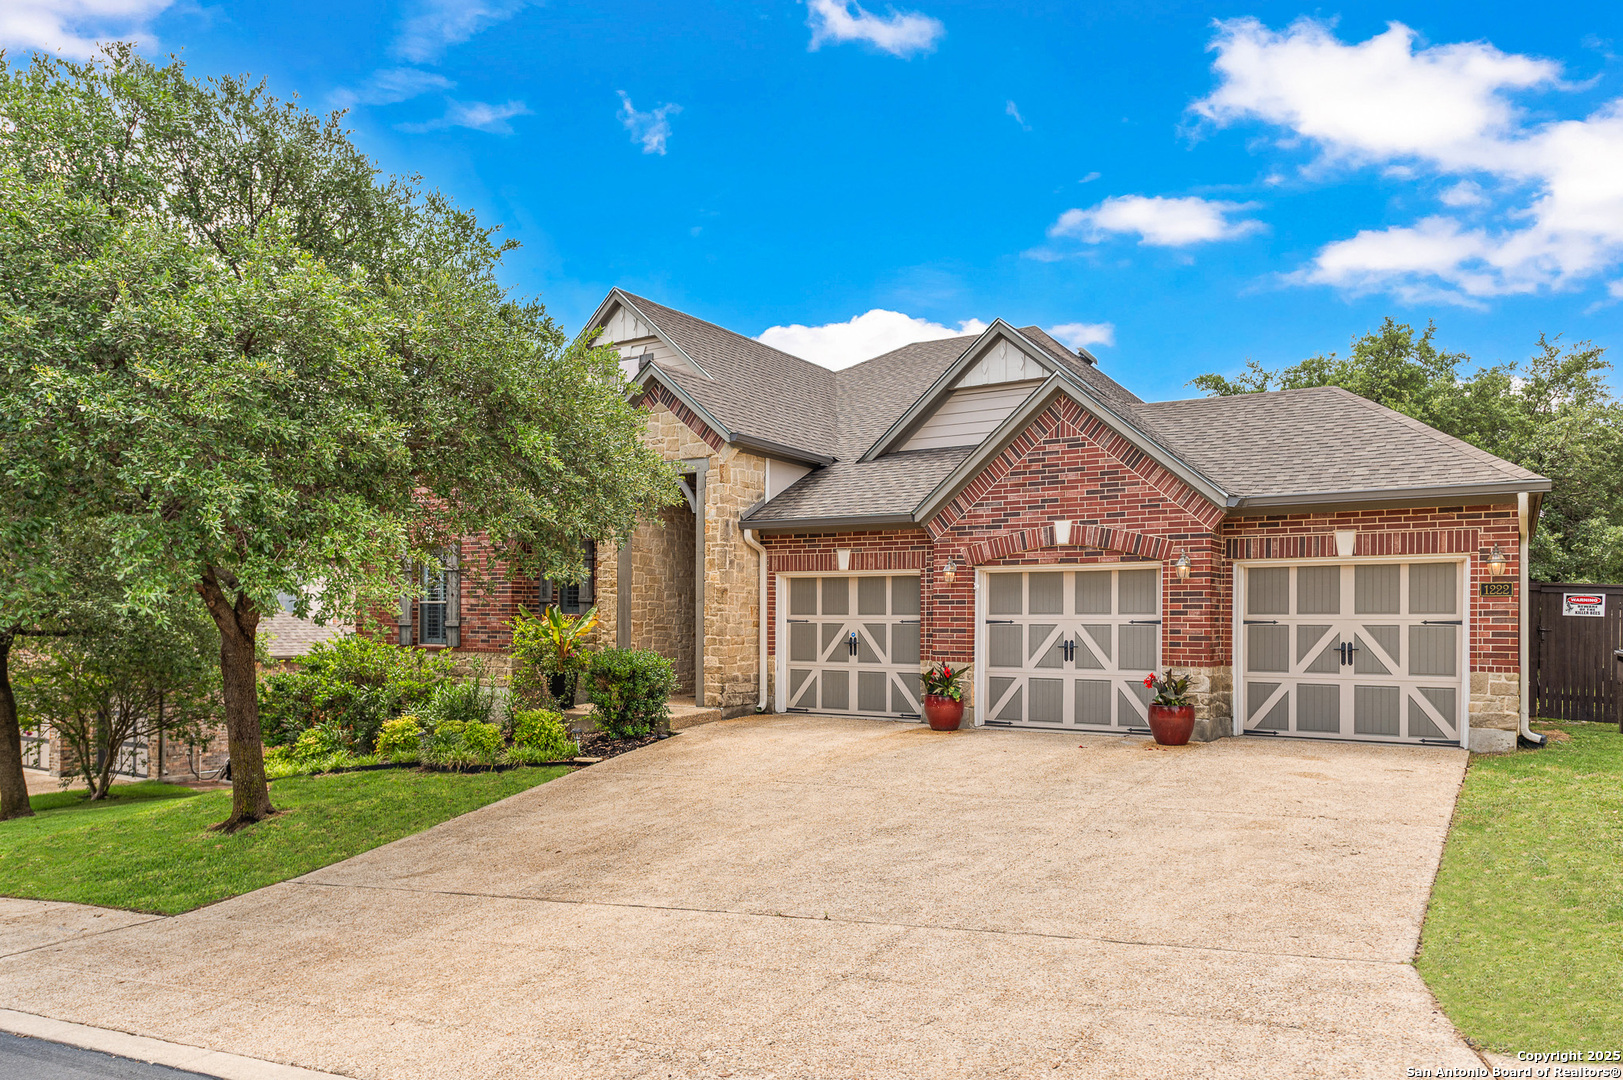
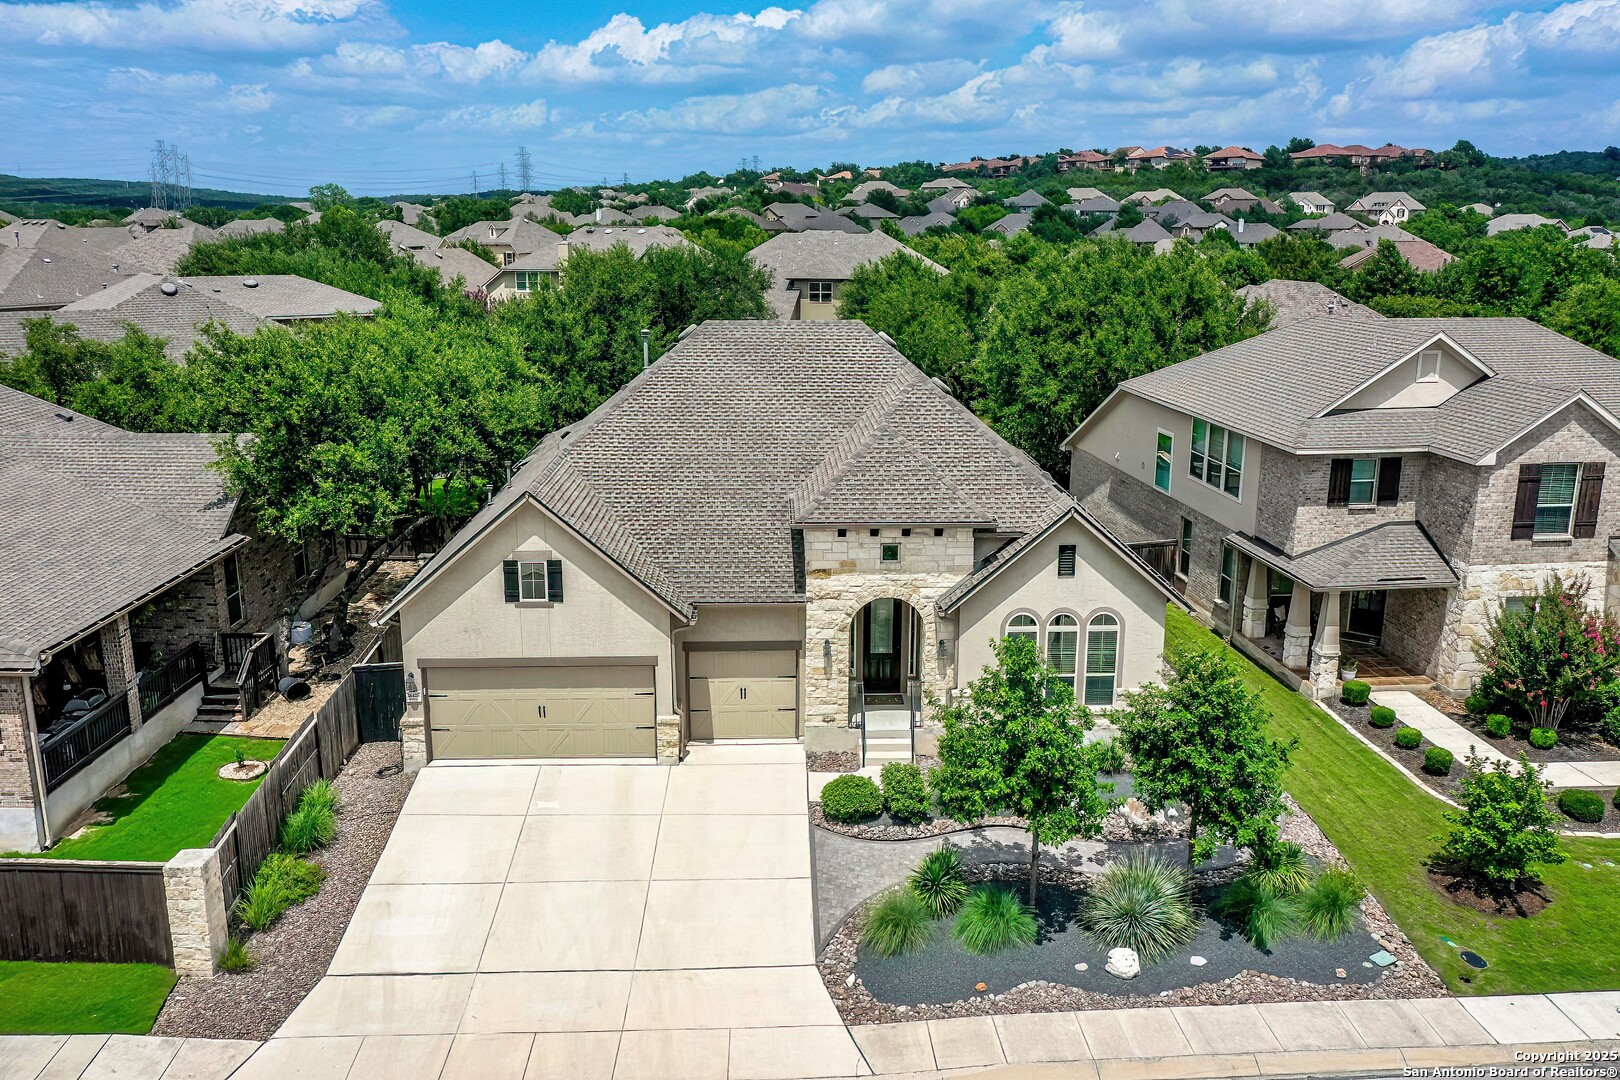
Active
$619,000
4
bds
|
4
ba
|
3,148
sqft
|
built
2008
1222 Ashbury Bay, San Antonio, TX 78258
$-2,144
Cash flow
-18.1%
Cash-on-Cash Return
2.1%
Cap rate
0.5%
Rent to Value Ratio
Active under contract
$279,500
3
bds
|
3
ba
|
1,500
sqft
|
built
1985
13043 Trent St, San Antonio, TX 78232
$-959
Cash flow
-17.9%
Cash-on-Cash Return
2.2%
Cap rate
0.6%
Rent to Value Ratio
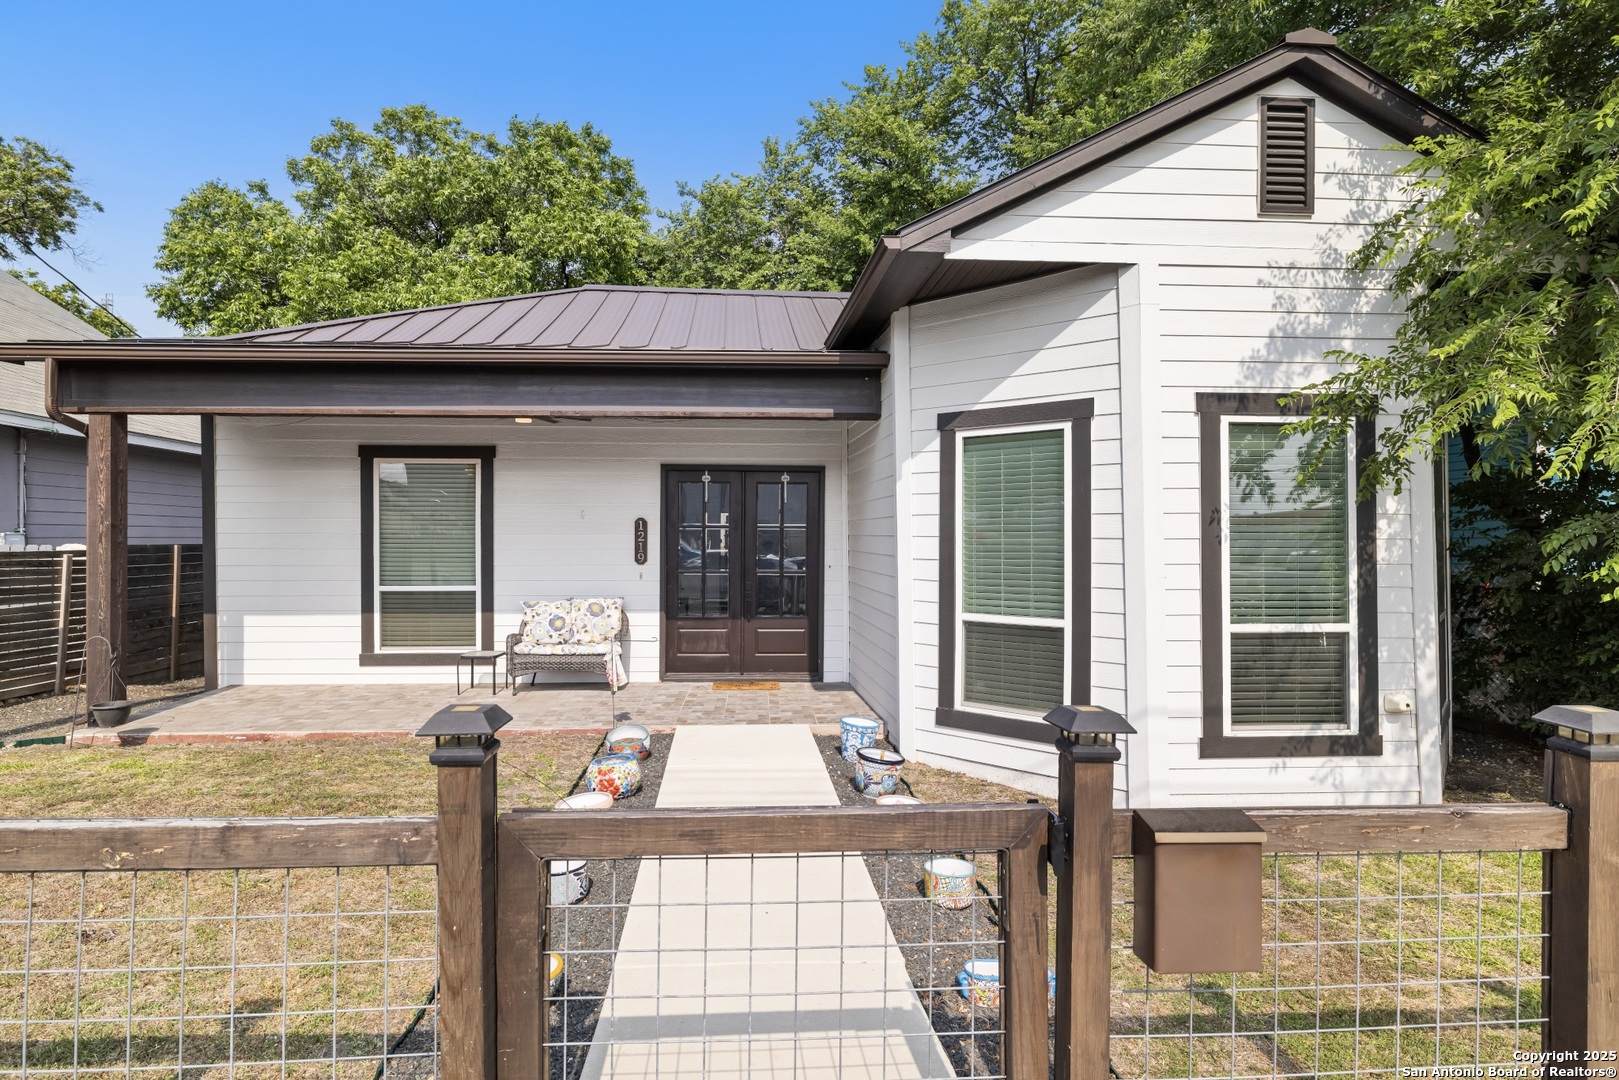
Active
$565,000
3
bds
|
2
ba
|
1,904
sqft
|
built
1900
1219 N Olive St, San Antonio, TX 78202
$-1,934
Cash flow
-17.9%
Cash-on-Cash Return
2.2%
Cap rate
0.5%
Rent to Value Ratio
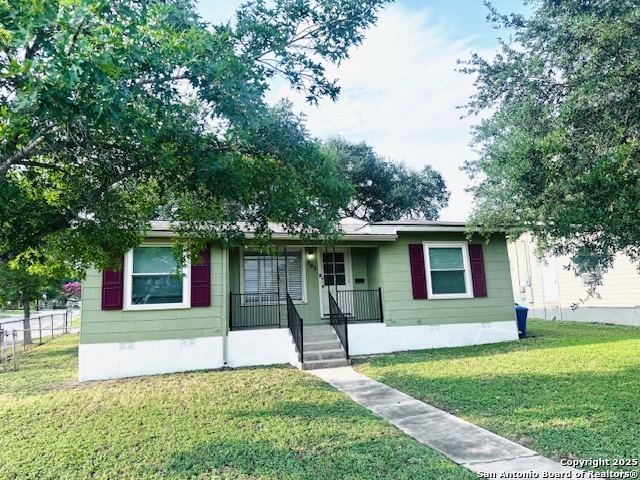
Active
$229,000
3
bds
|
1
ba
|
1,333
sqft
|
built
1952
703 Mc Dougal Ave, San Antonio, TX 78223
$-424
Cash flow
-9.7%
Cash-on-Cash Return
4.1%
Cap rate
0.7%
Rent to Value Ratio
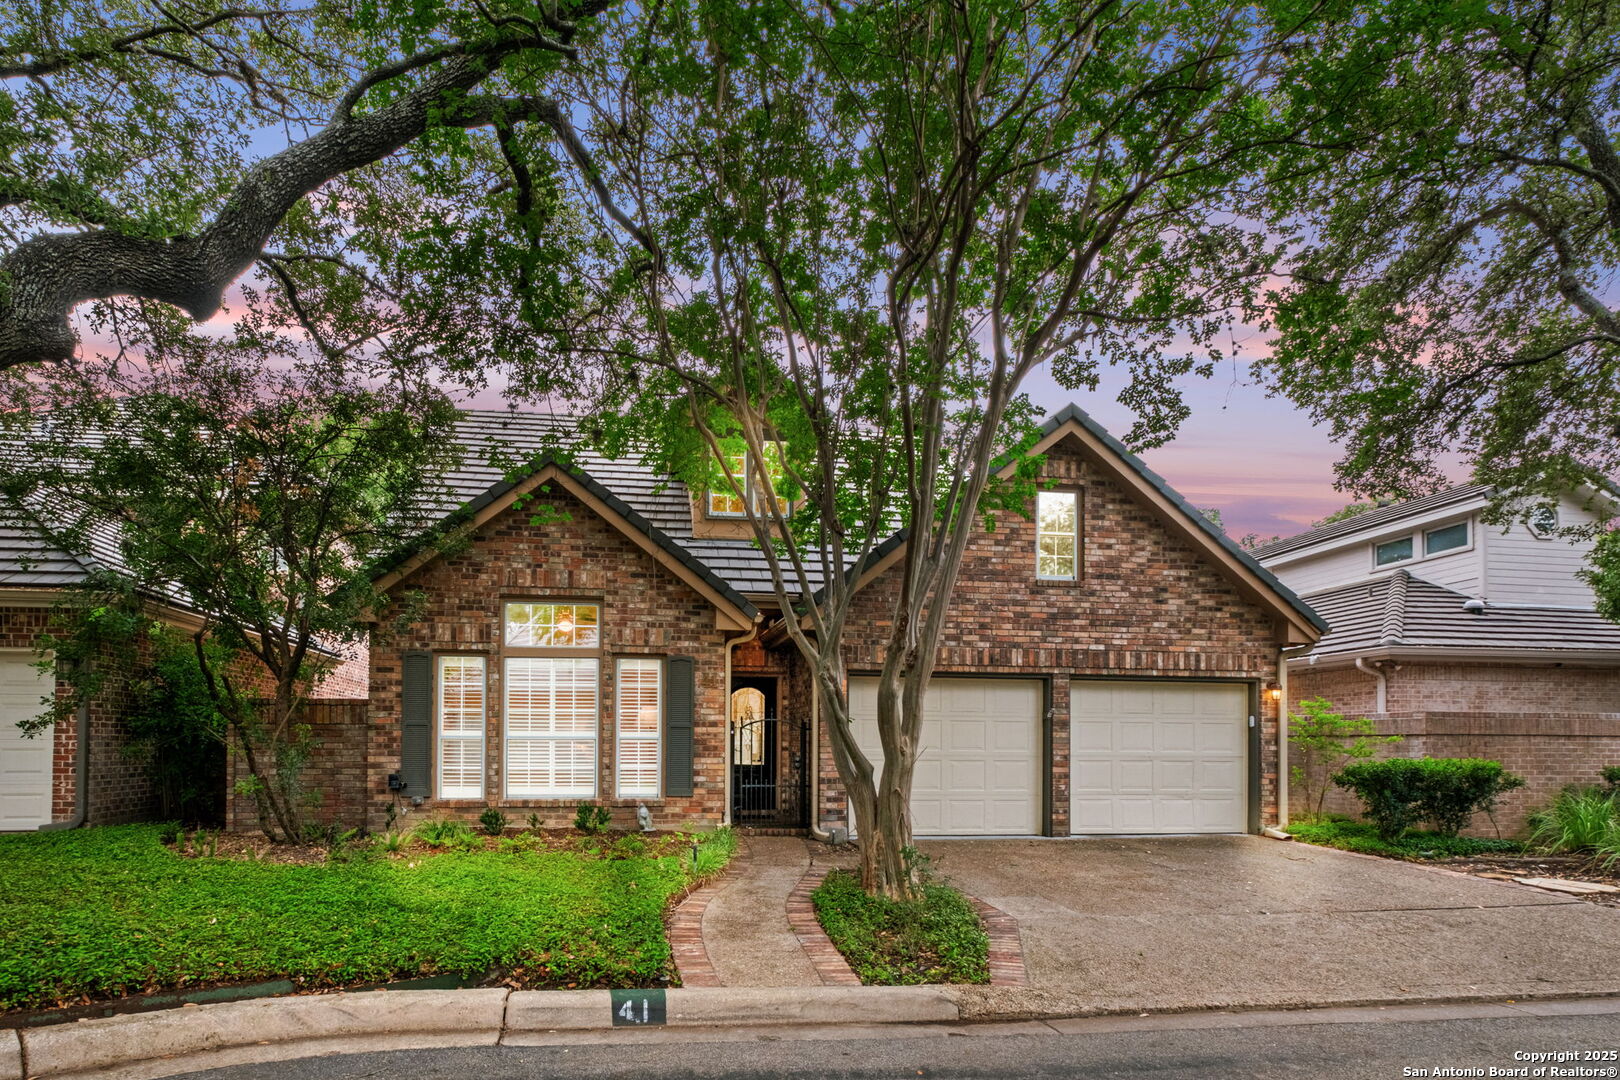
Active
$1,150,000
3
bds
|
3
ba
|
2,652
sqft
|
built
1989
41 Longsford, San Antonio, TX 78209
$-5,007
Cash flow
-22.7%
Cash-on-Cash Return
1.1%
Cap rate
0.3%
Rent to Value Ratio
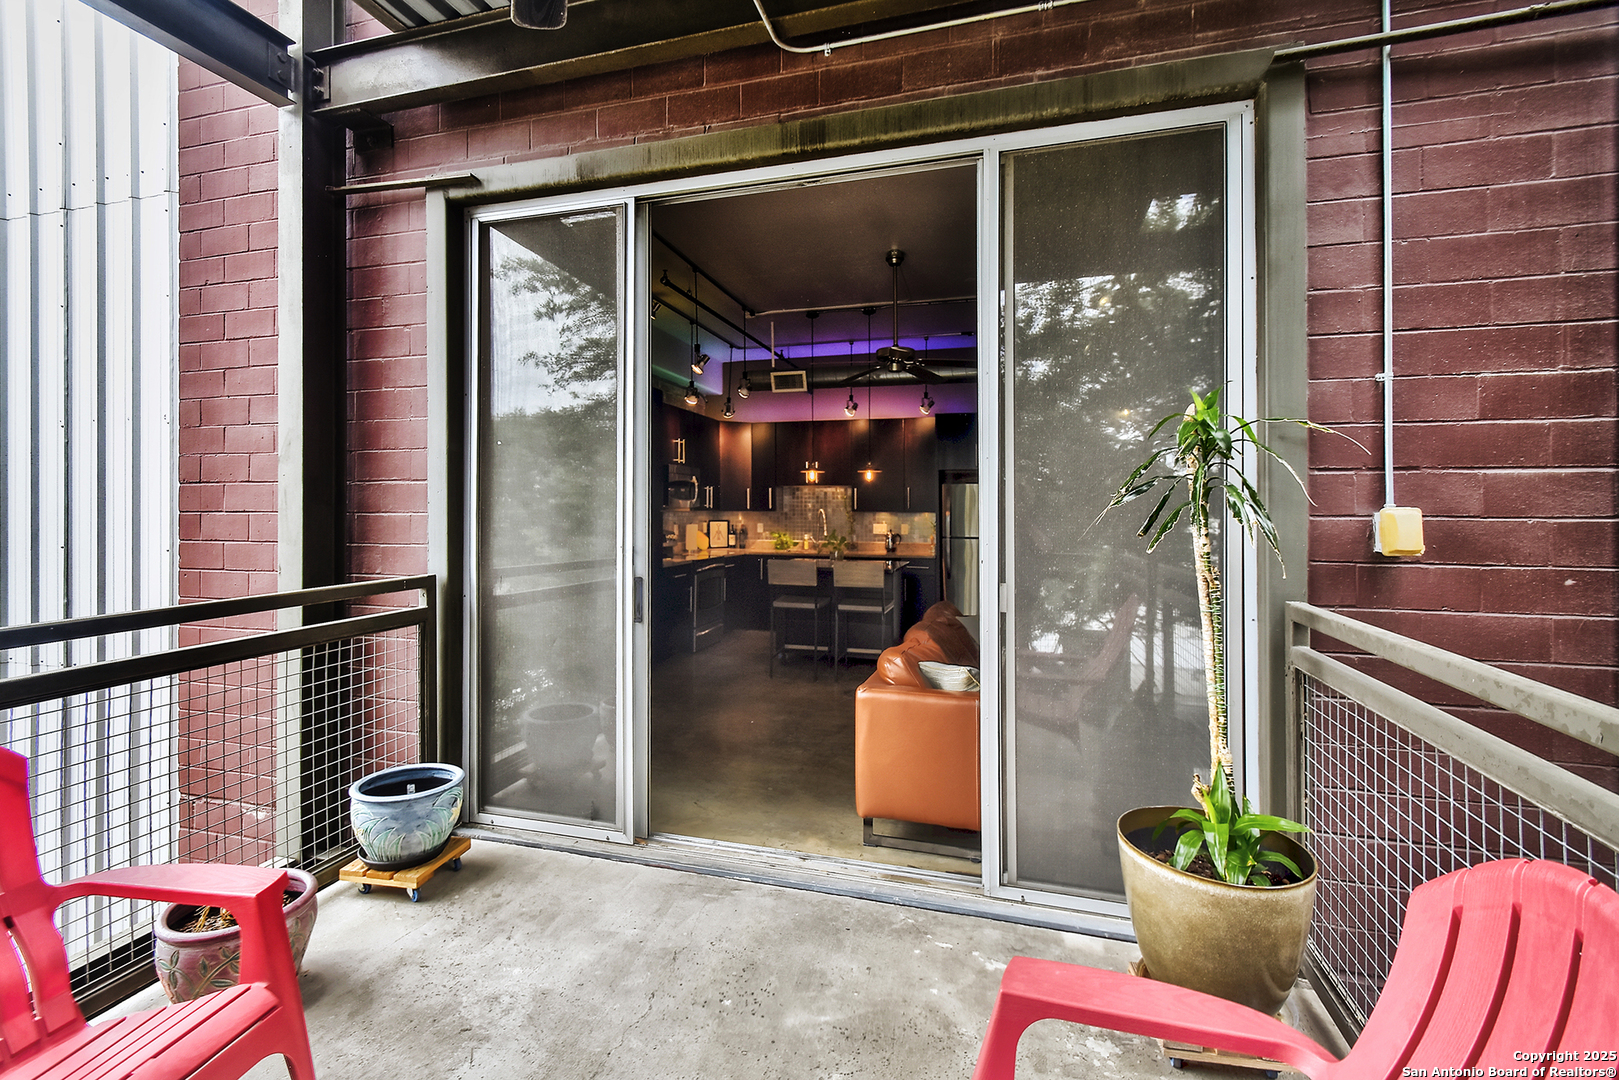
Active
$335,000
1
bds
|
1
ba
|
766
sqft
|
built
2008
831 S Flores St, San Antonio, TX 78204
$-1,512
Cash flow
-23.5%
Cash-on-Cash Return
0.9%
Cap rate
0.5%
Rent to Value Ratio
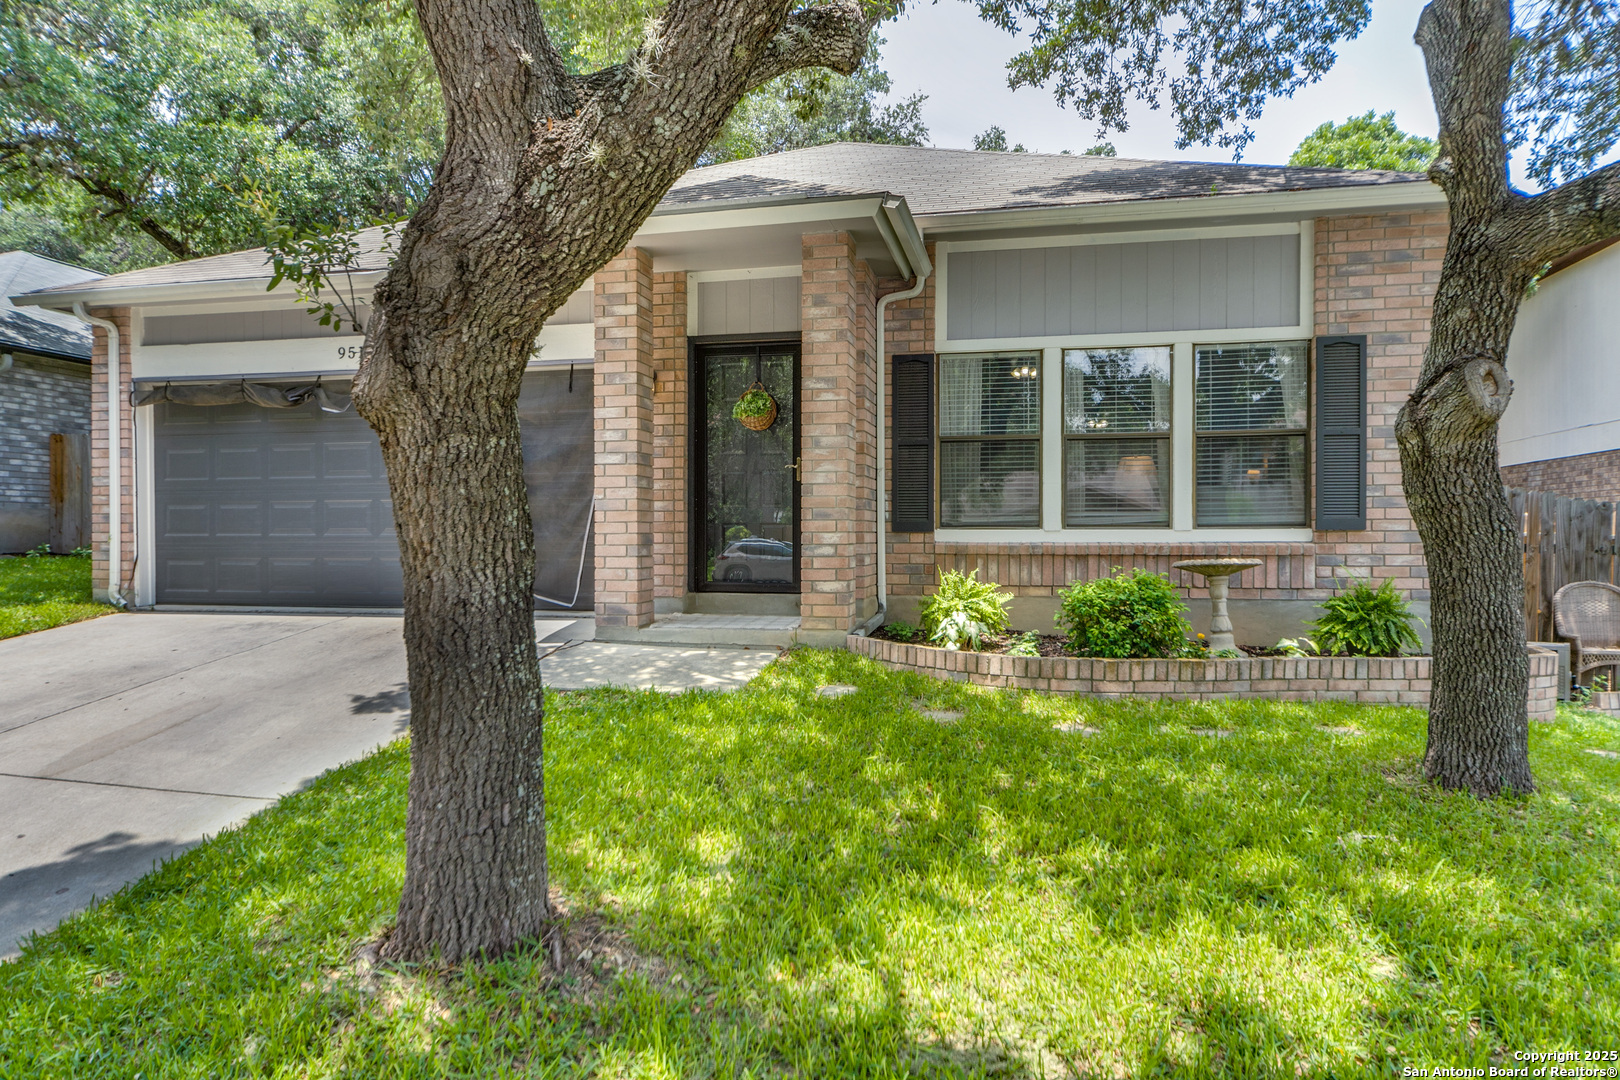
Active
$305,000
3
bds
|
2
ba
|
1,988
sqft
|
built
1989
9515 Wicklow Dr, San Antonio, TX 78250
$-791
Cash flow
-13.5%
Cash-on-Cash Return
3.2%
Cap rate
0.7%
Rent to Value Ratio
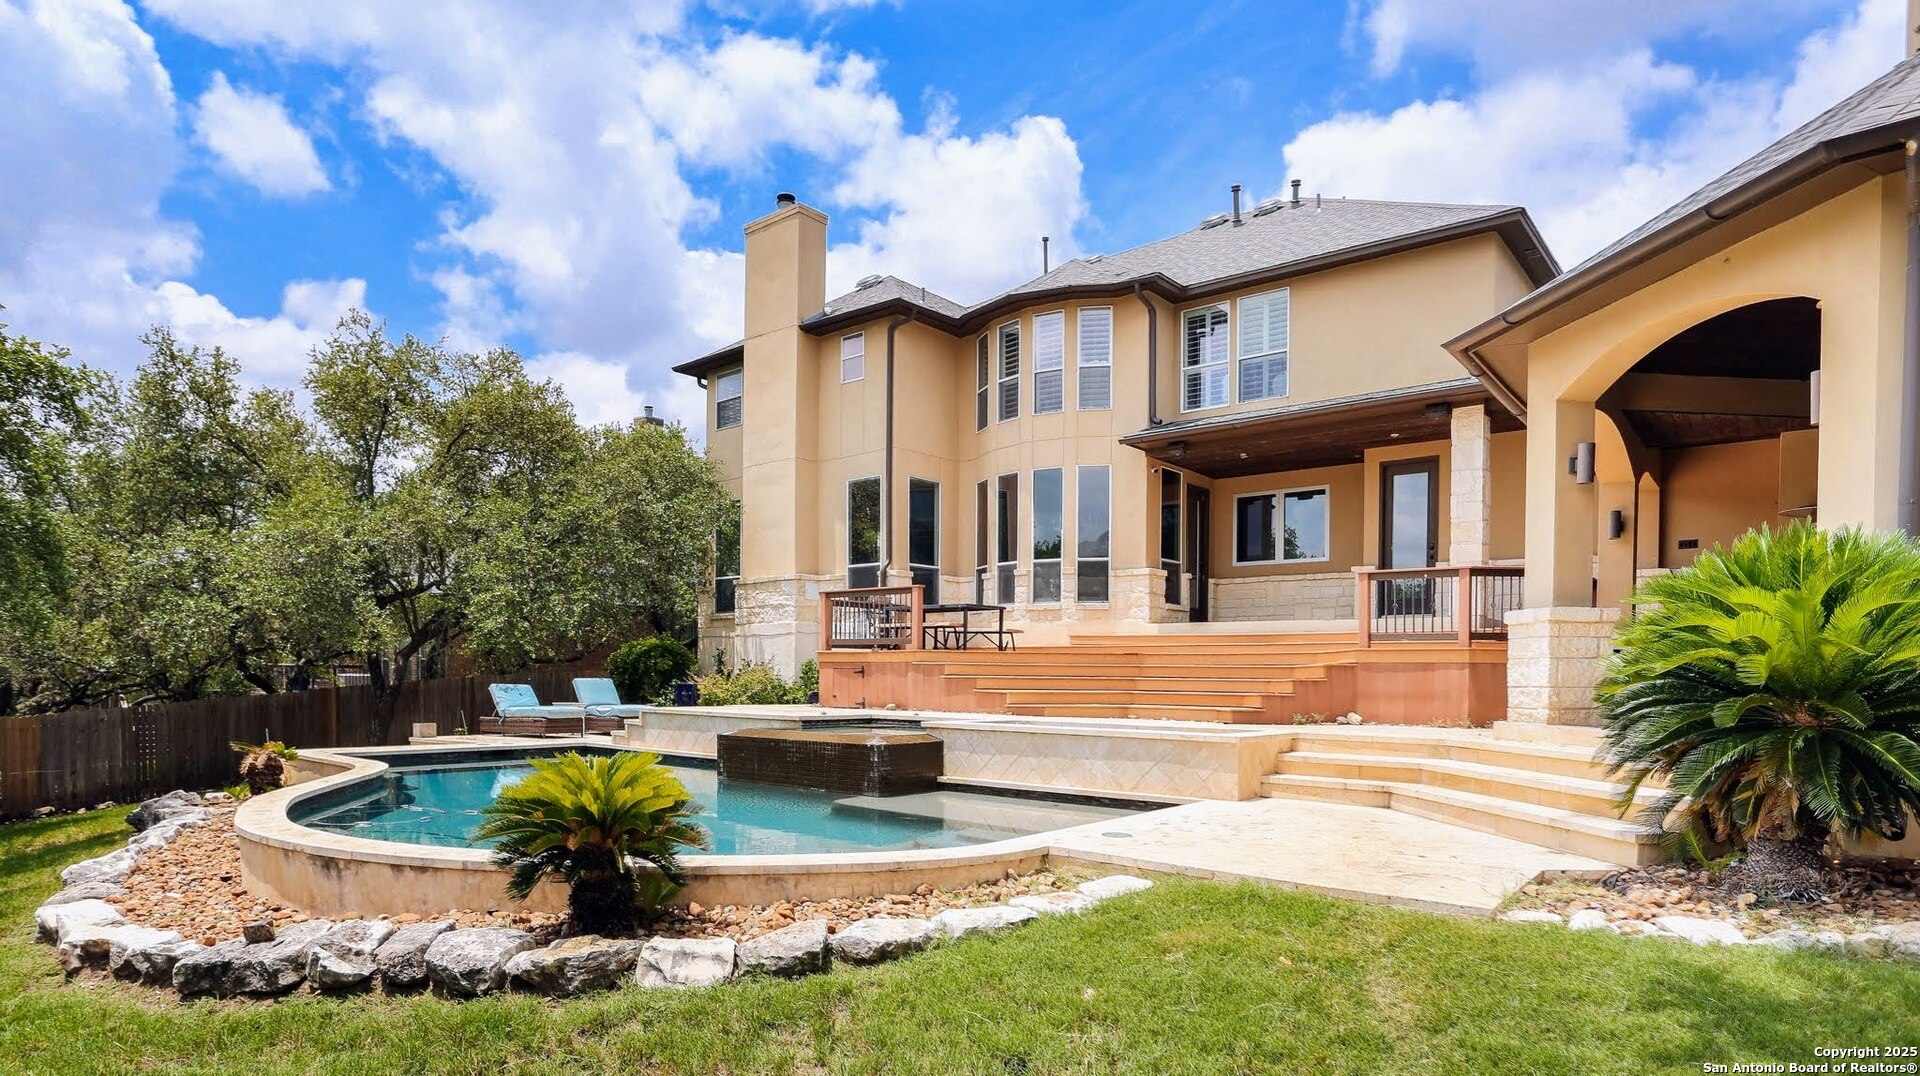
Active
$900,000
5
bds
|
5
ba
|
4,098
sqft
|
built
2002
1818 Palmer Vw, San Antonio, TX 78260
$-2,259
Cash flow
-13.1%
Cash-on-Cash Return
3.3%
Cap rate
0.6%
Rent to Value Ratio
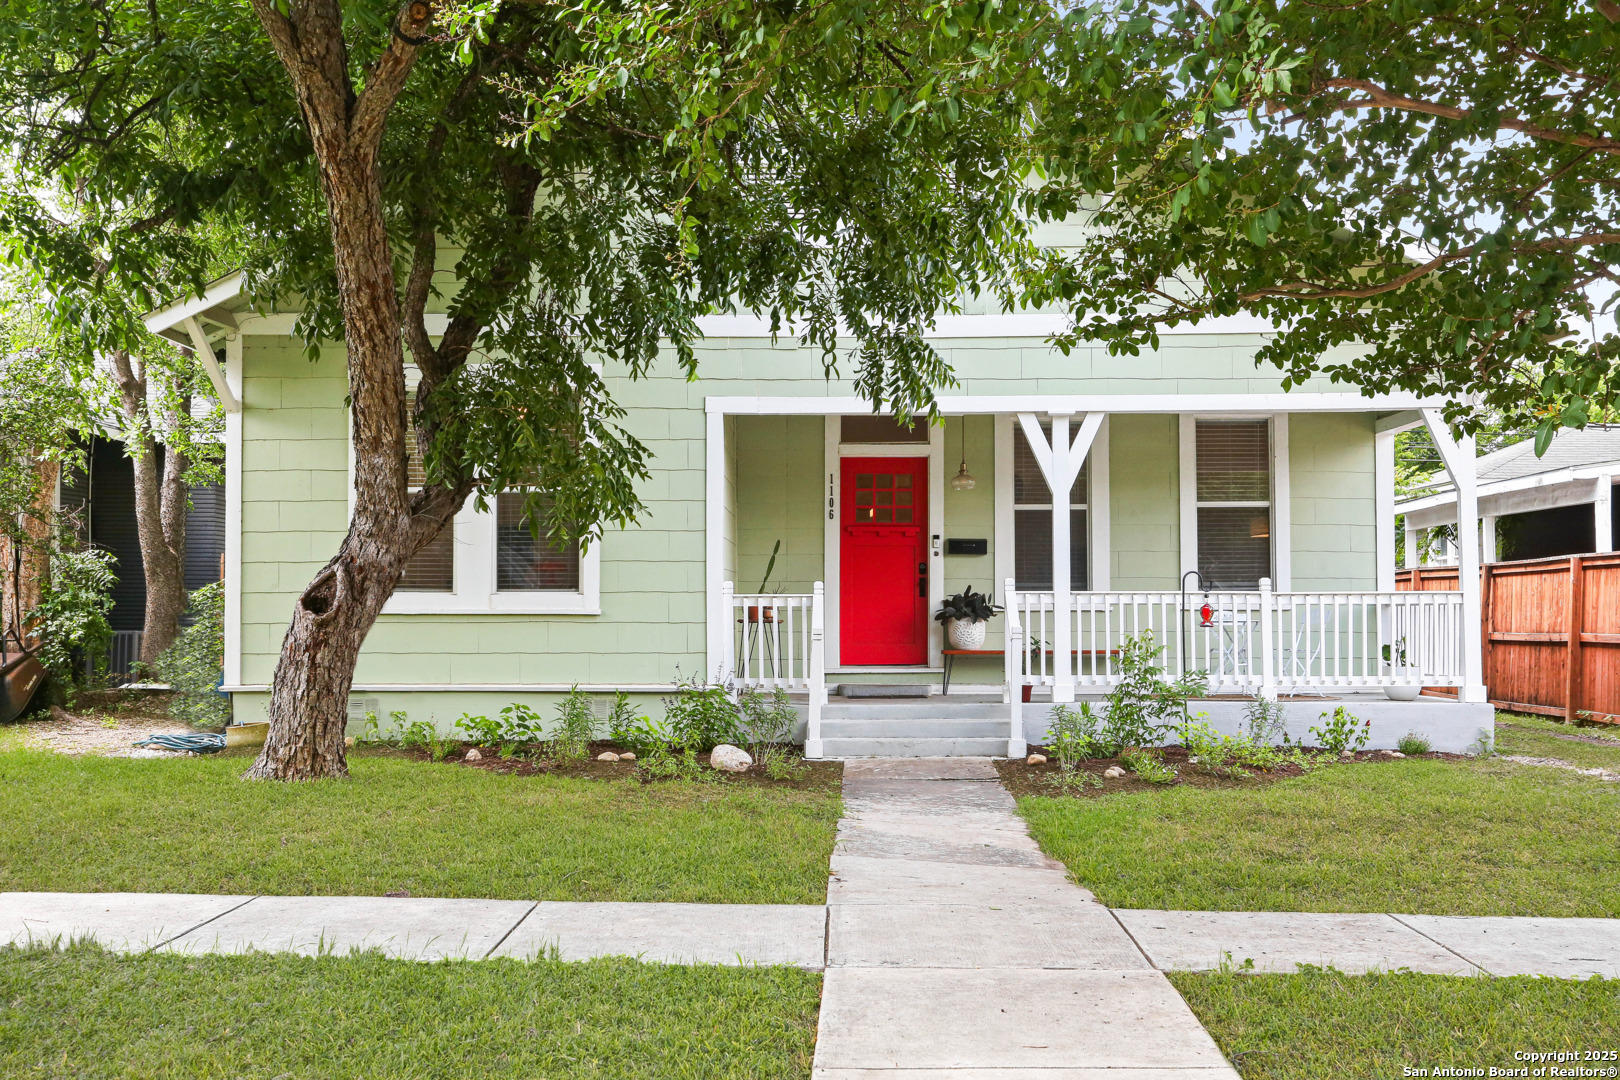
Active
$379,000
3
bds
|
2
ba
|
1,473
sqft
|
built
1925
1106 W Summit Ave, San Antonio, TX 78201
$-1,192
Cash flow
-16.4%
Cash-on-Cash Return
2.5%
Cap rate
0.5%
Rent to Value Ratio
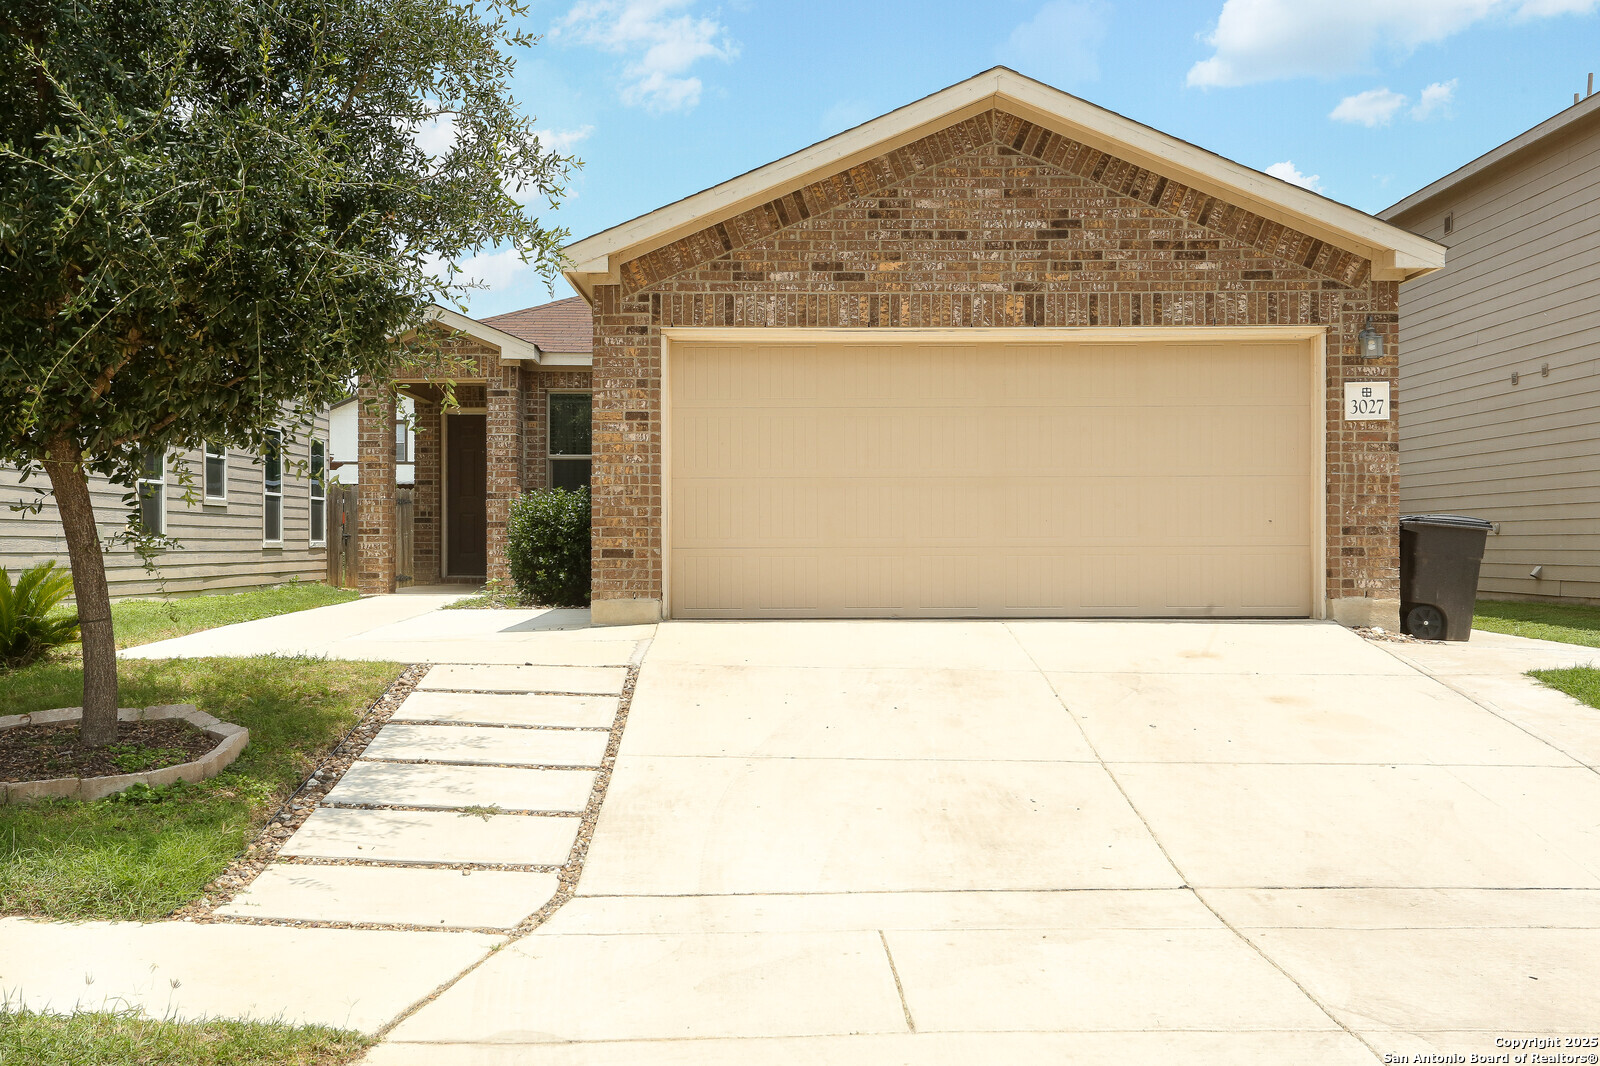
Active
$220,000
3
bds
|
2
ba
|
1,357
sqft
|
built
2018
3027 Mission Gate, San Antonio, TX 78224
$-528
Cash flow
-12.5%
Cash-on-Cash Return
3.4%
Cap rate
0.7%
Rent to Value Ratio
Active
$845,000
5
bds
|
4
ba
|
3,604
sqft
|
built
2014
2715 Sonata Park, San Antonio, TX 78230
$-3,101
Cash flow
-19.1%
Cash-on-Cash Return
1.9%
Cap rate
0.5%
Rent to Value Ratio
Active
$719,000
4
bds
|
3
ba
|
2,598
sqft
|
built
1947
131 Larchmont Dr, San Antonio, TX 78209
$-2,715
Cash flow
-19.7%
Cash-on-Cash Return
1.8%
Cap rate
0.4%
Rent to Value Ratio
Active
$454,900
3
bds
|
3
ba
|
2,551
sqft
|
built
1994
15323 Antler Creek Dr, San Antonio, TX 78248
$-2,226
Cash flow
-25.5%
Cash-on-Cash Return
0.4%
Cap rate
0.3%
Rent to Value Ratio
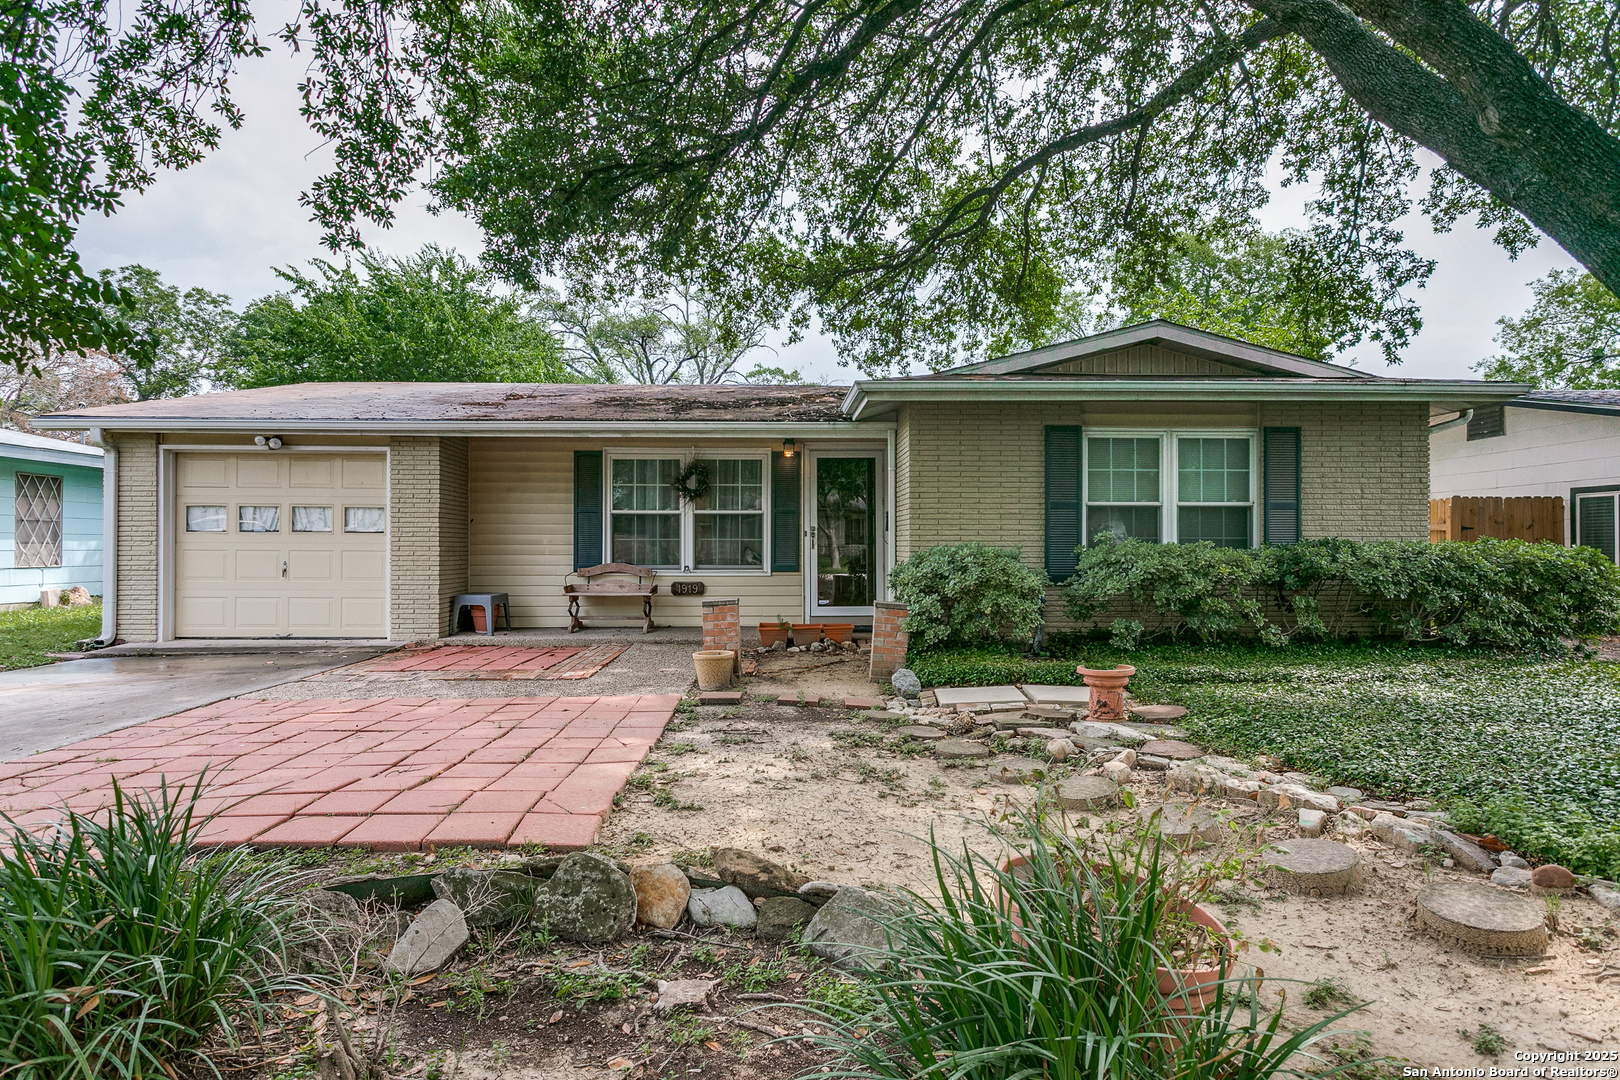
Active
$240,000
3
bds
|
2
ba
|
1,394
sqft
|
built
1959
1919 Arroya Vista Dr, San Antonio, TX 78213
$-443
Cash flow
-9.6%
Cash-on-Cash Return
4.1%
Cap rate
0.8%
Rent to Value Ratio
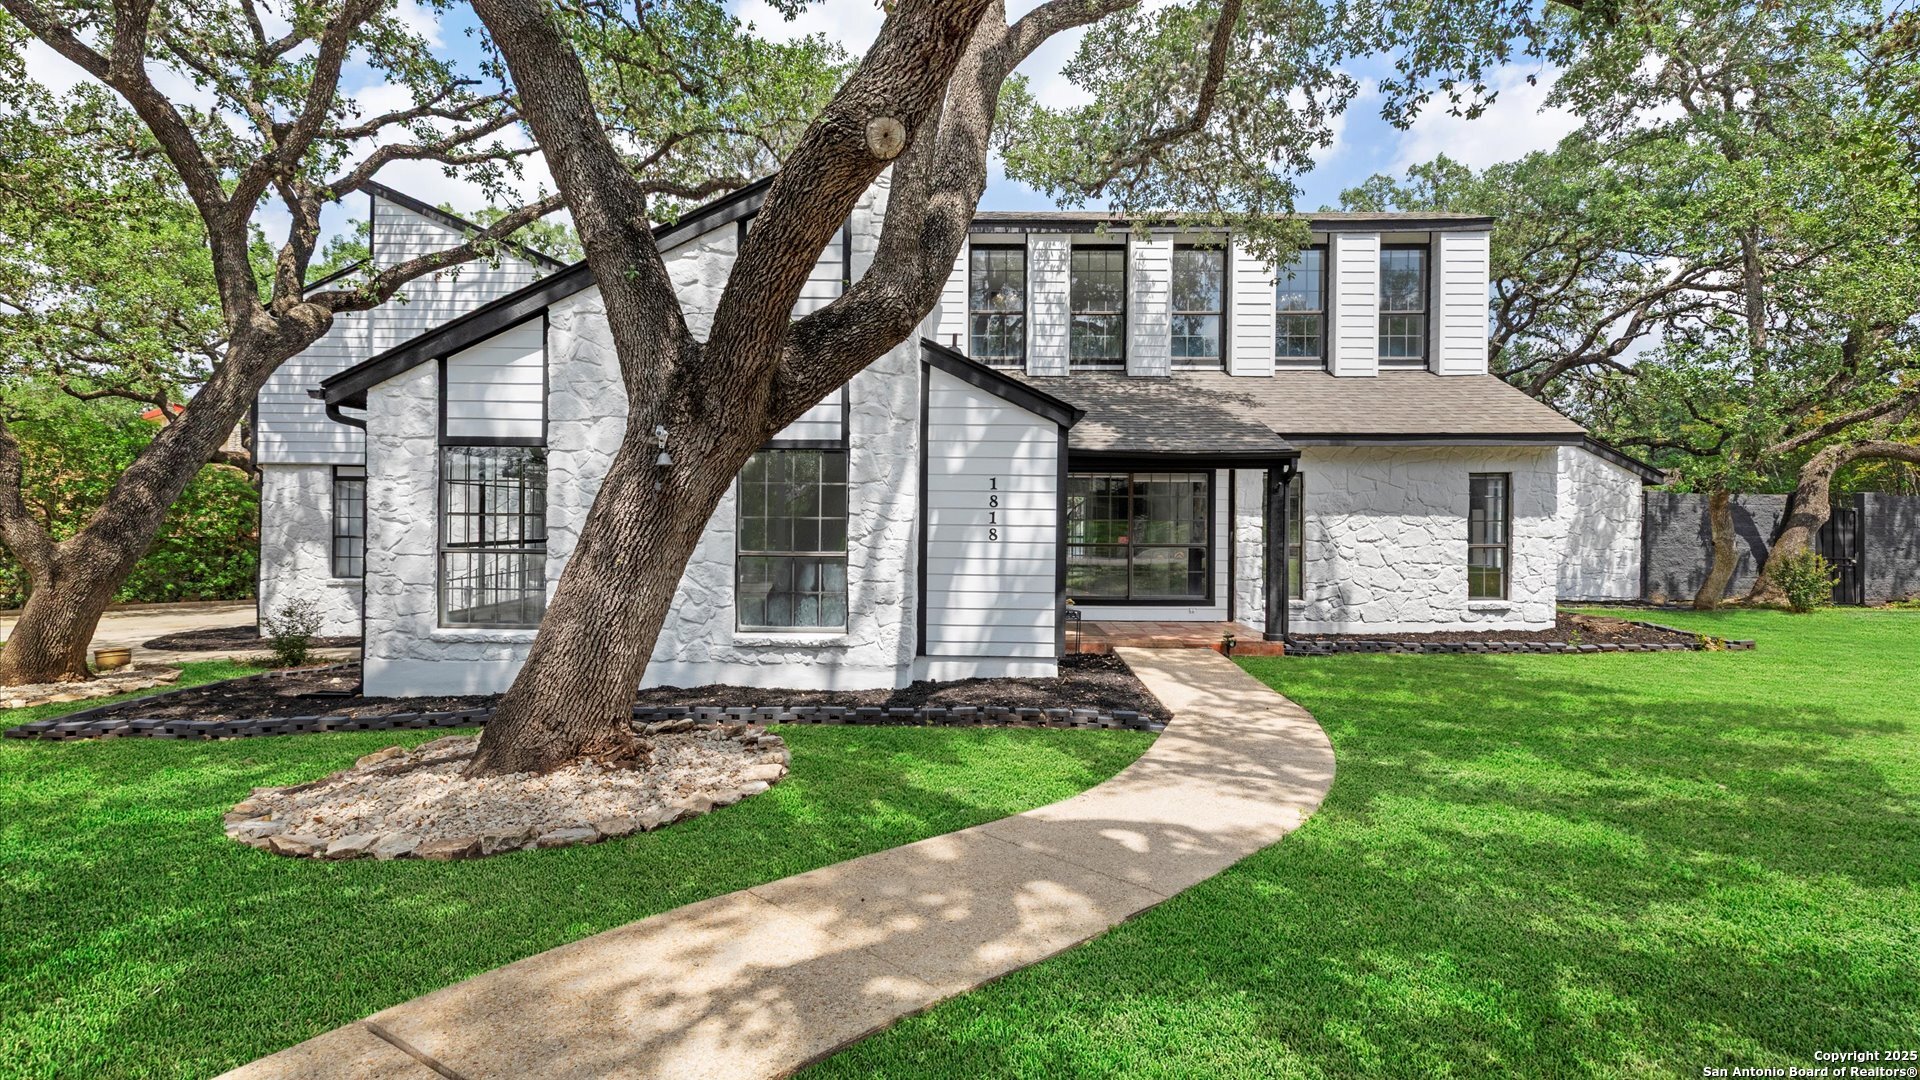
Active under contract
$675,000
4
bds
|
4
ba
|
3,718
sqft
|
built
1979
1818 Moreshead St, San Antonio, TX 78231
$-2,636
Cash flow
-20.4%
Cash-on-Cash Return
1.6%
Cap rate
0.4%
Rent to Value Ratio
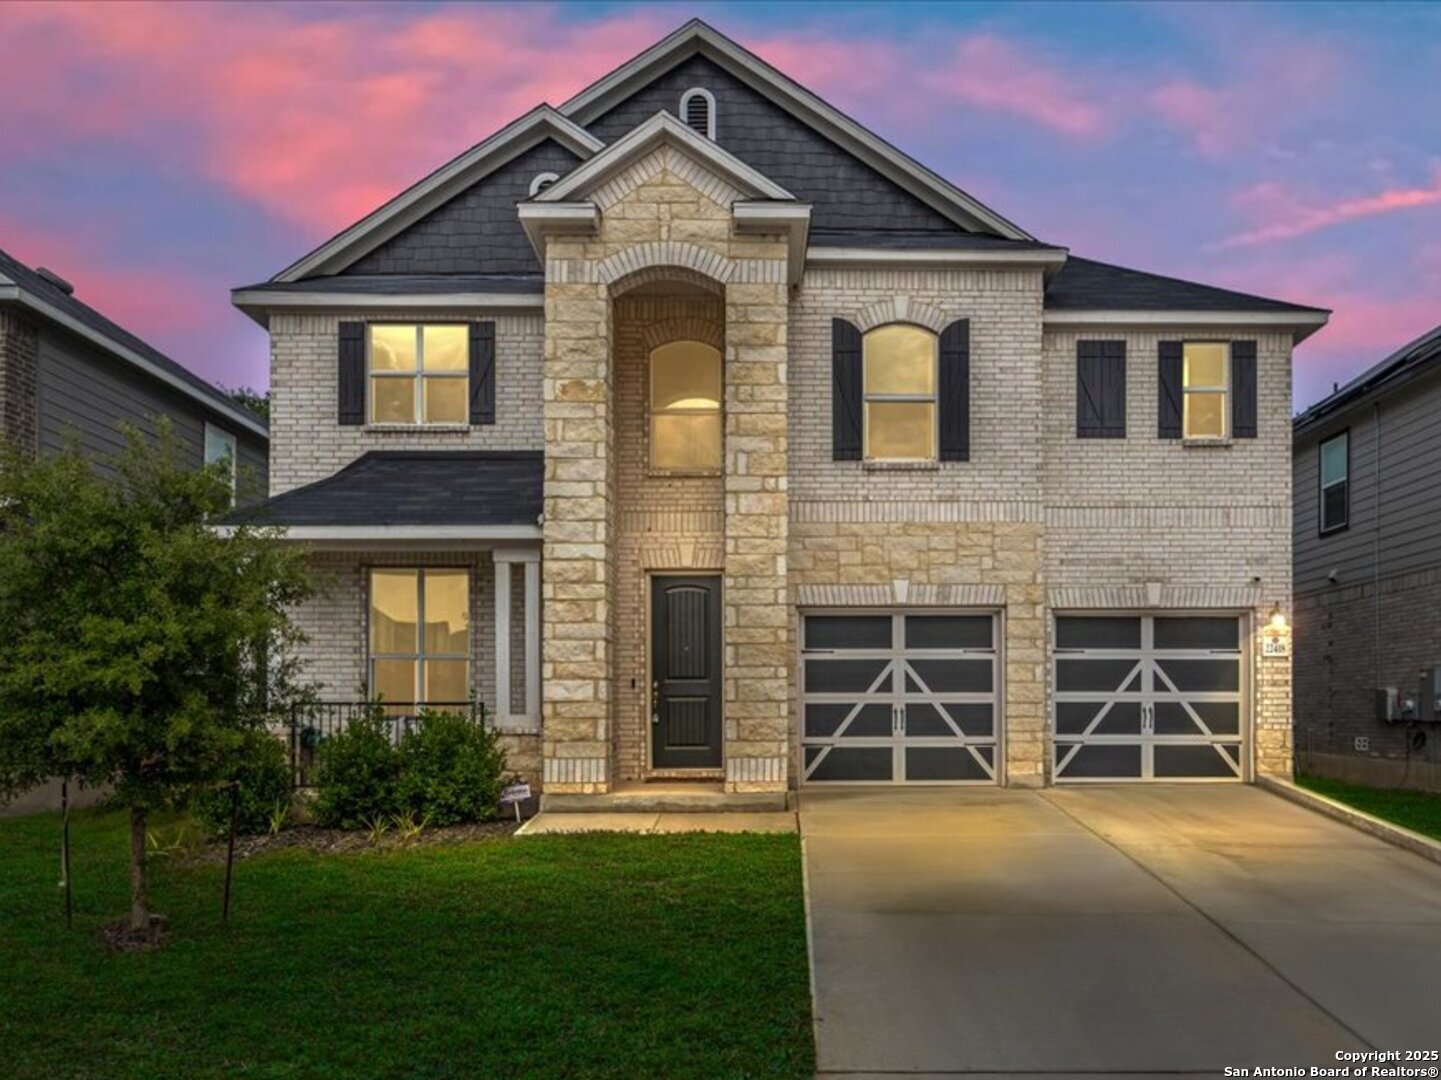
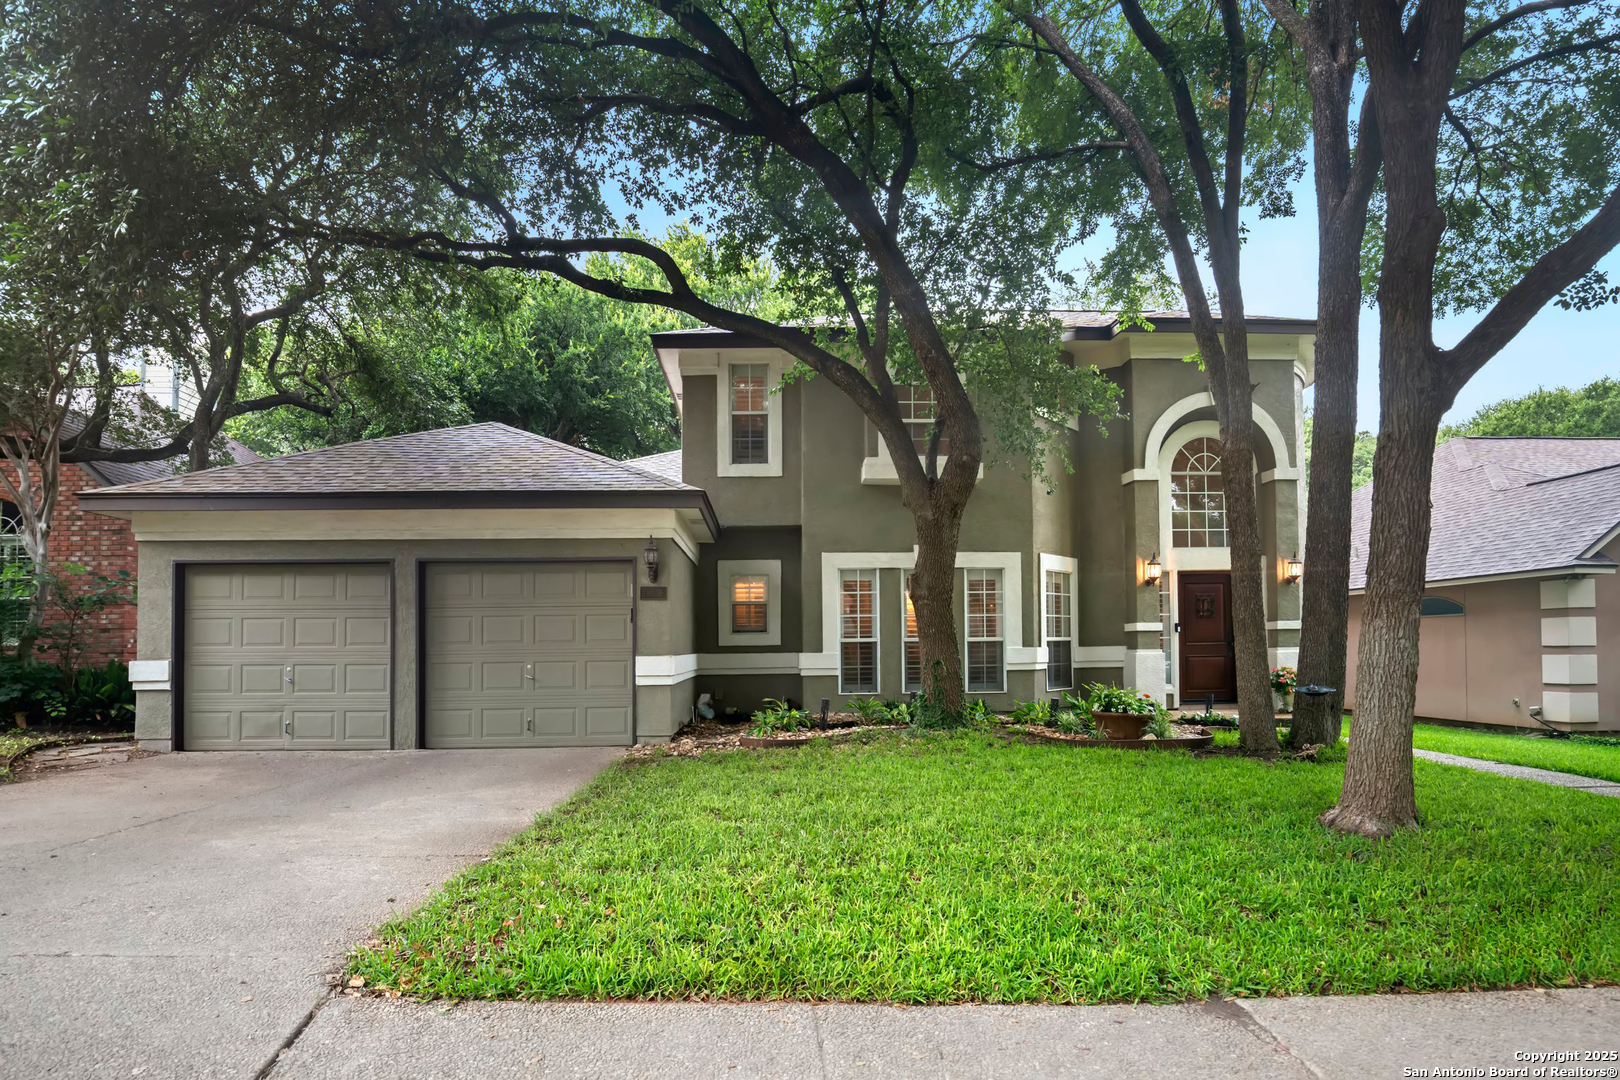
Active
$425,000
3
bds
|
3
ba
|
2,859
sqft
|
built
2021
22418 Peonia Park, San Antonio, TX 78261
$-1,176
Cash flow
-14.4%
Cash-on-Cash Return
3.0%
Cap rate
0.6%
Rent to Value Ratio
Active
$276,000
3
bds
|
2
ba
|
1,510
sqft
|
built
2022
526 Wild Olive Way, San Antonio, TX 78219
$-749
Cash flow
-14.2%
Cash-on-Cash Return
3.0%
Cap rate
0.7%
Rent to Value Ratio
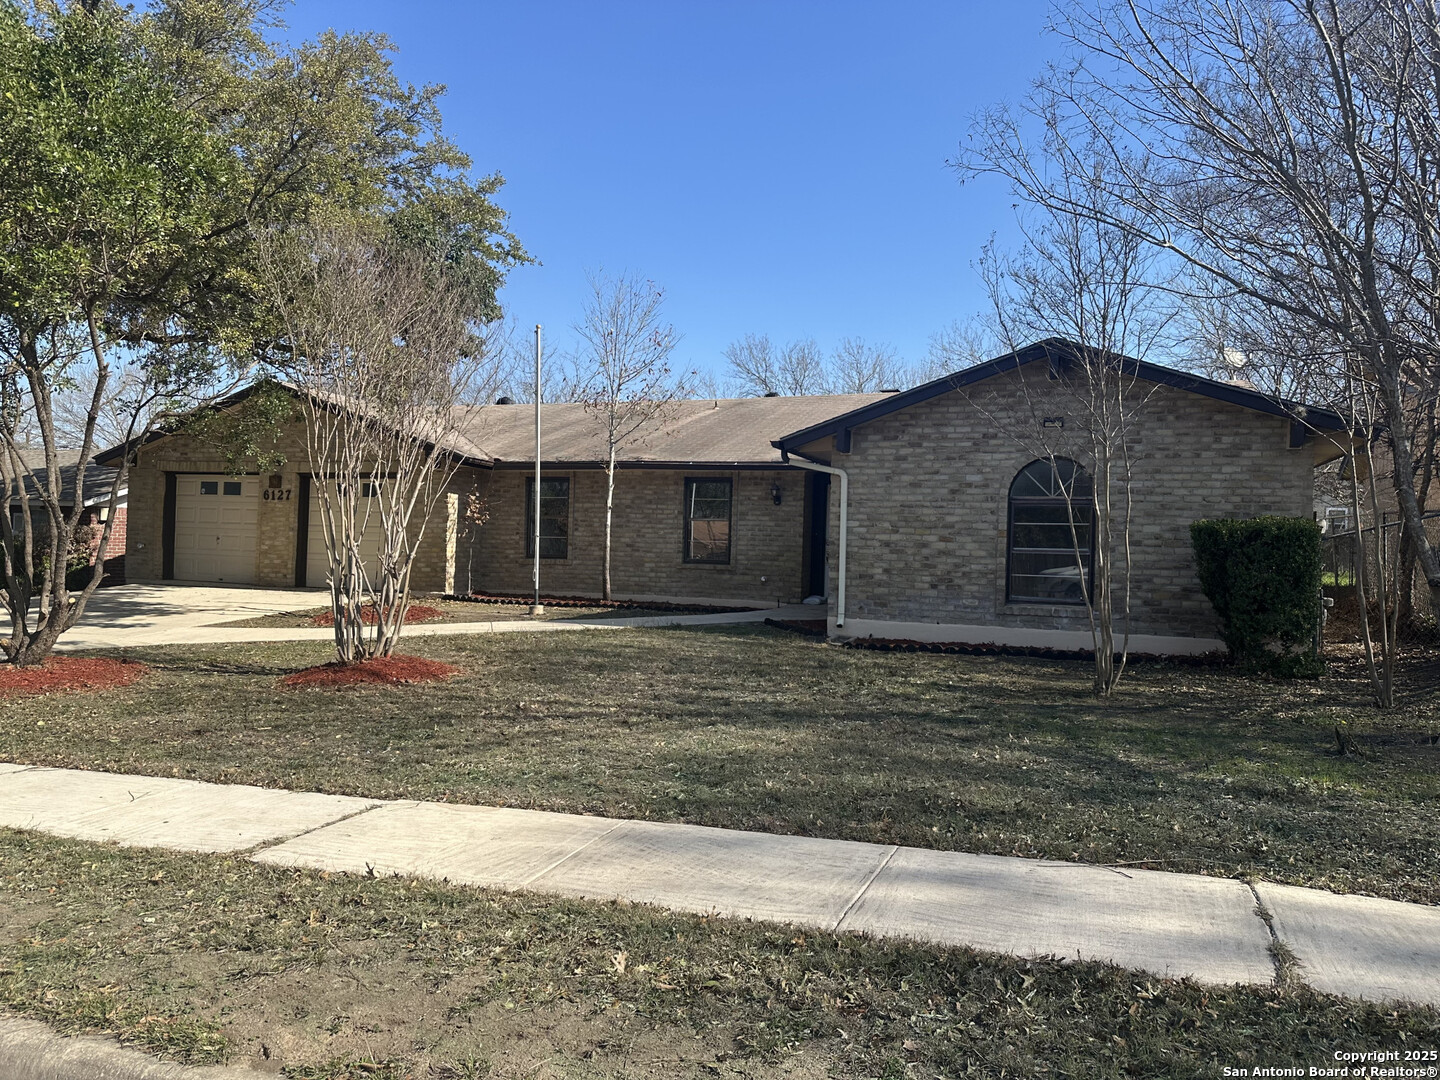
Active
$359,900
3
bds
|
3
ba
|
2,042
sqft
|
built
1977
6127 Walking Gait Dr, San Antonio, TX 78240
$-1,093
Cash flow
-15.8%
Cash-on-Cash Return
2.6%
Cap rate
0.6%
Rent to Value Ratio
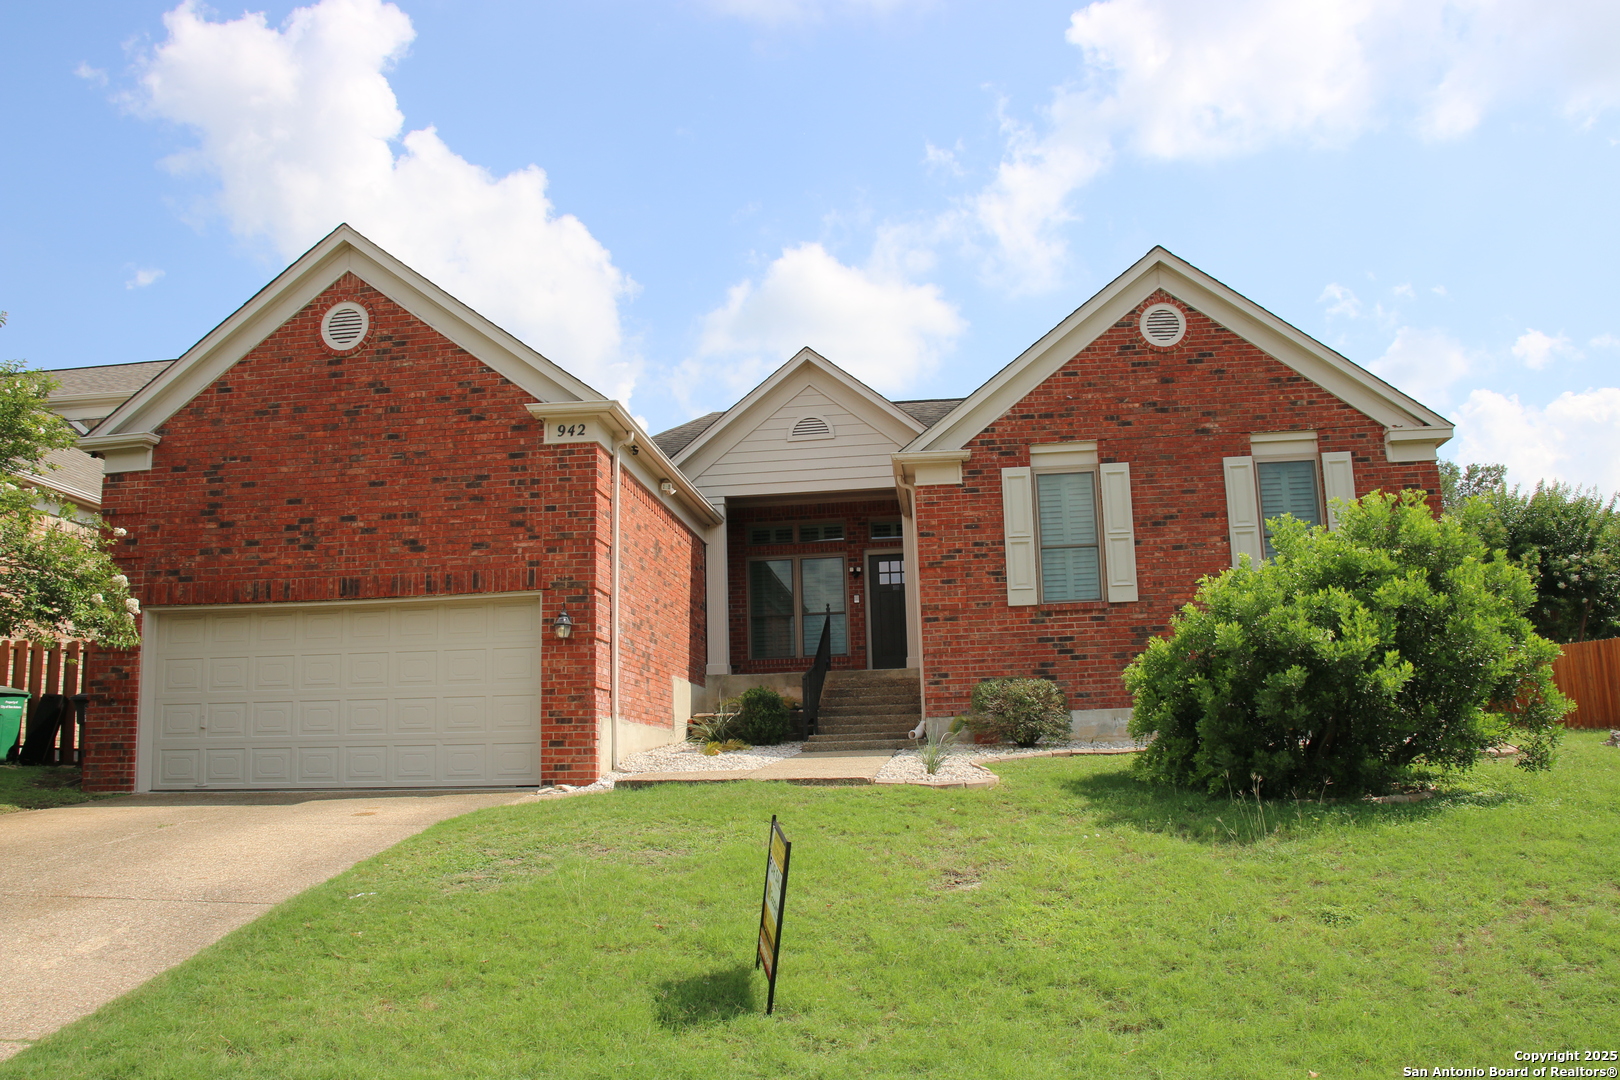
Active
$449,000
4
bds
|
3
ba
|
2,463
sqft
|
built
1989
942 Lightstone Dr, San Antonio, TX 78258
$-1,543
Cash flow
-17.9%
Cash-on-Cash Return
2.2%
Cap rate
0.6%
Rent to Value Ratio
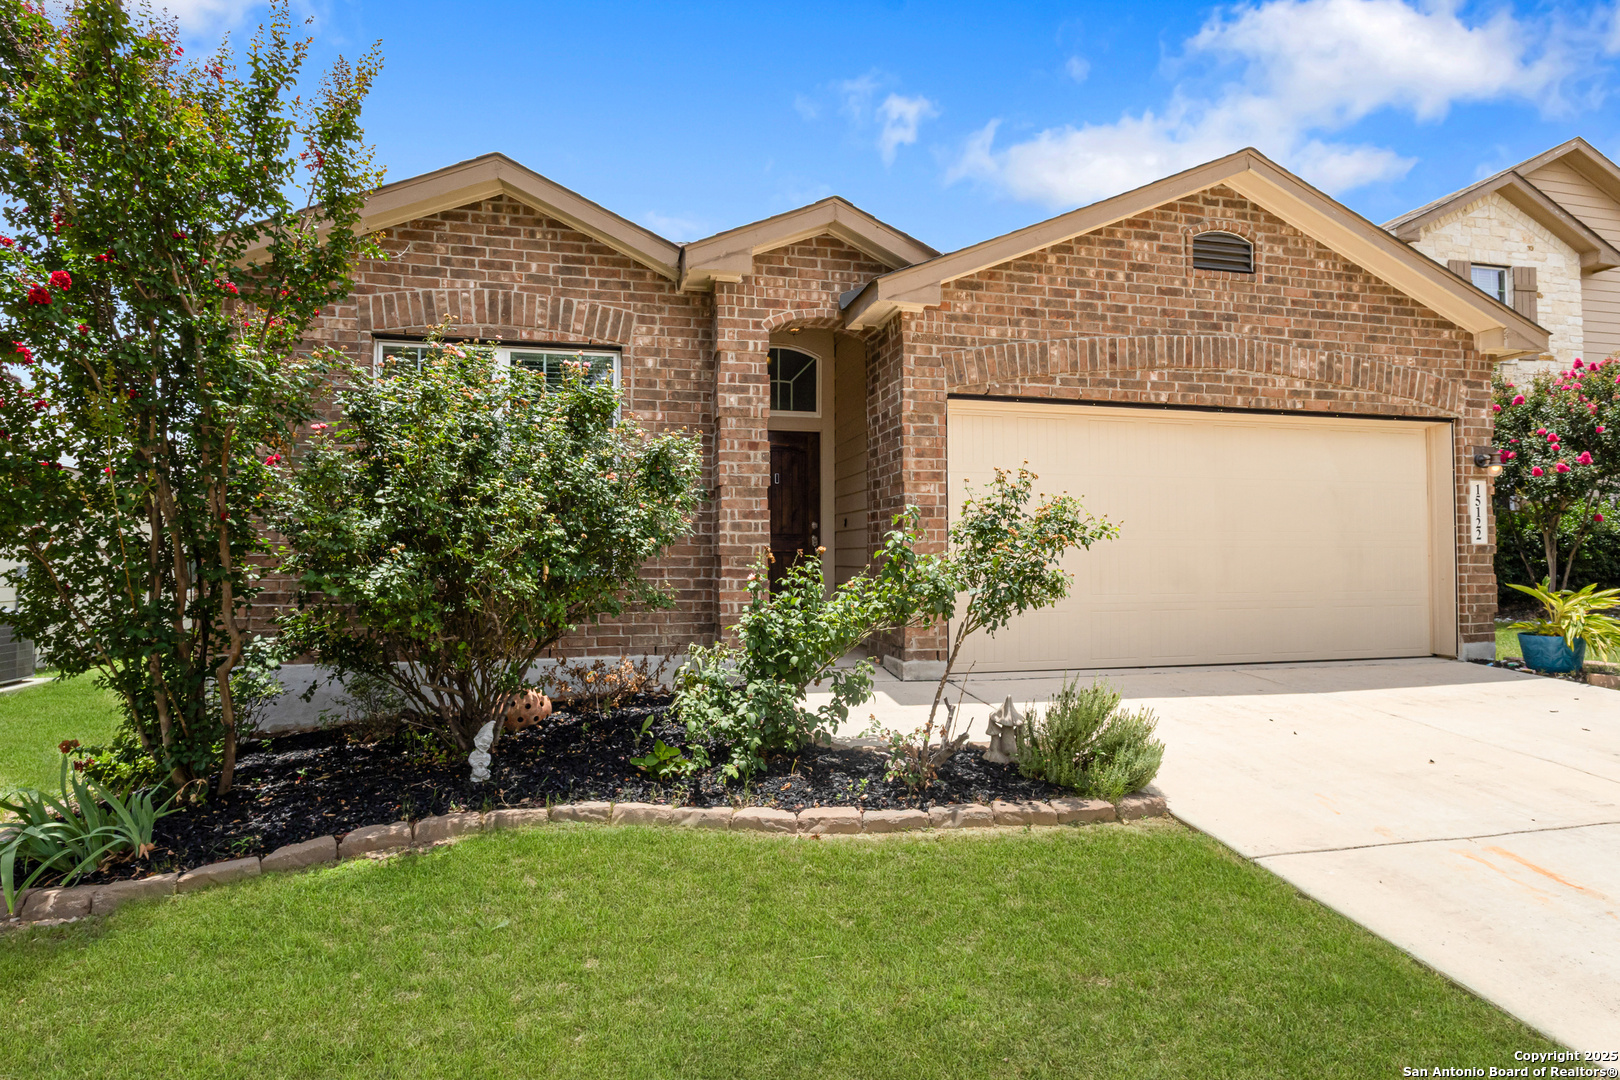
Active
$295,000
3
bds
|
2
ba
|
1,610
sqft
|
built
2016
15122 Cinnamon Teal, San Antonio, TX 78253
$-774
Cash flow
-13.7%
Cash-on-Cash Return
3.1%
Cap rate
0.6%
Rent to Value Ratio
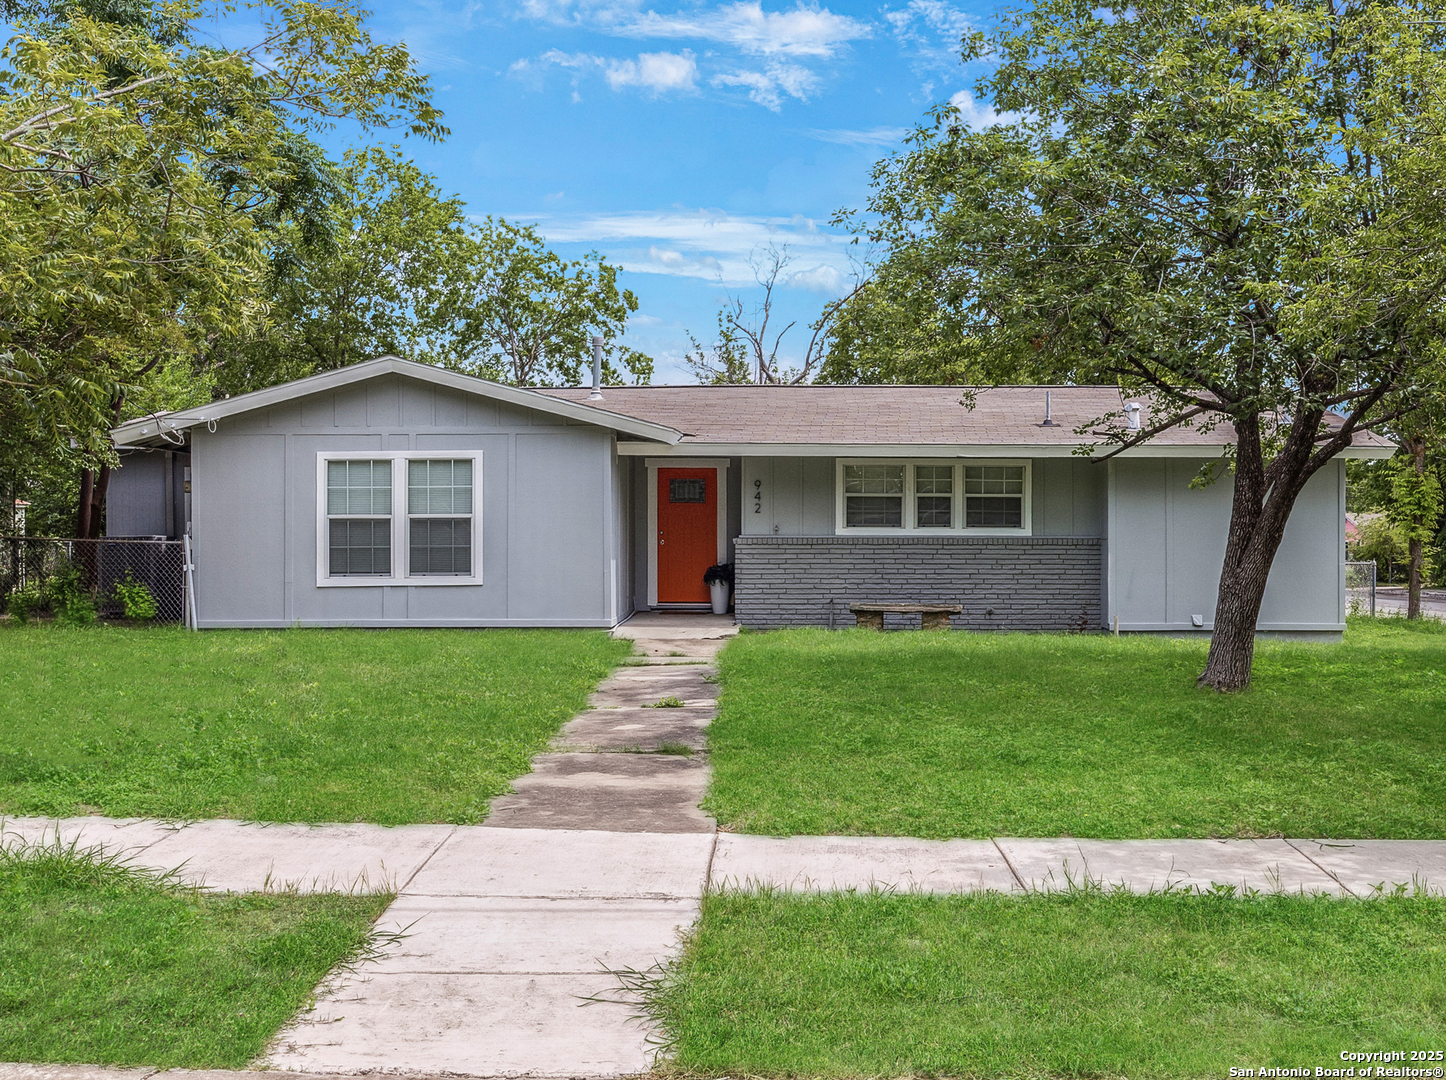
Active
$250,000
3
bds
|
2
ba
|
1,550
sqft
|
built
1952
942 San Angelo, San Antonio, TX 78201
$-615
Cash flow
-12.8%
Cash-on-Cash Return
3.3%
Cap rate
0.7%
Rent to Value Ratio
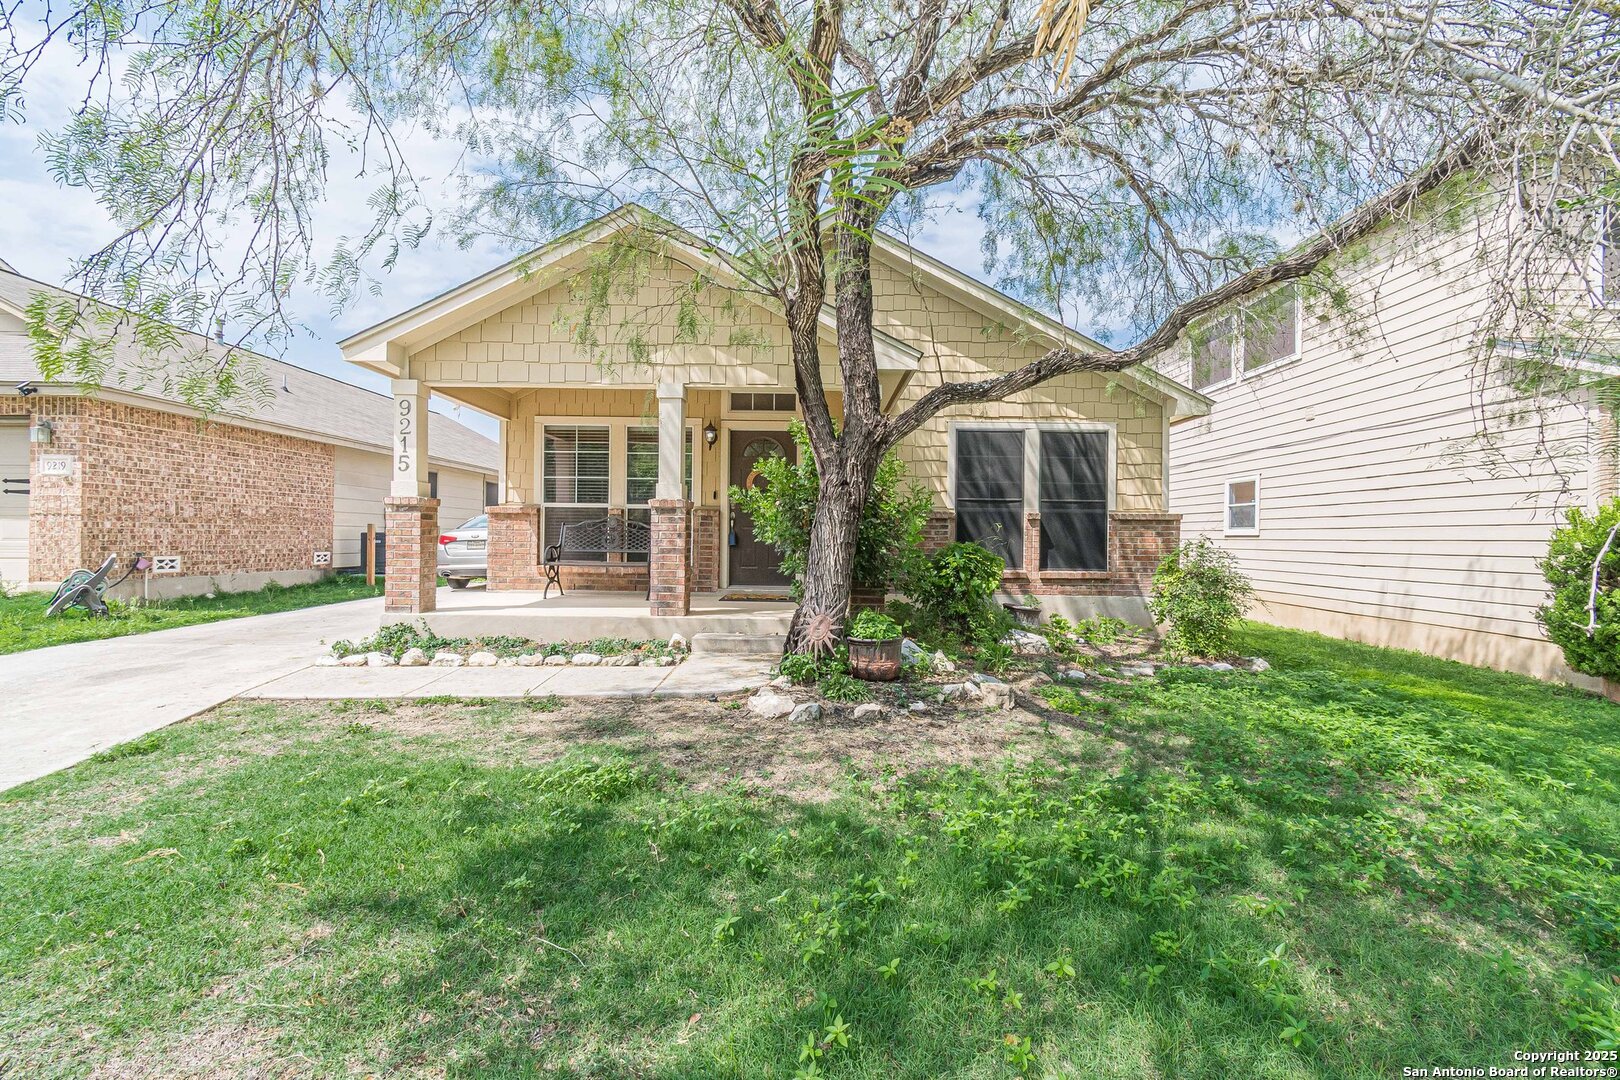
Active
$250,000
3
bds
|
2
ba
|
1,248
sqft
|
built
2005
9215 Hilltop Crossing Dr, San Antonio, TX 78251
$-666
Cash flow
-13.9%
Cash-on-Cash Return
3.1%
Cap rate
0.6%
Rent to Value Ratio

Active
$1,675,000
5
bds
|
6
ba
|
6,205
sqft
|
built
2014
21302 Ronda De Cadiz, San Antonio, TX 78257
$-7,733
Cash flow
-24.1%
Cash-on-Cash Return
0.7%
Cap rate
0.3%
Rent to Value Ratio
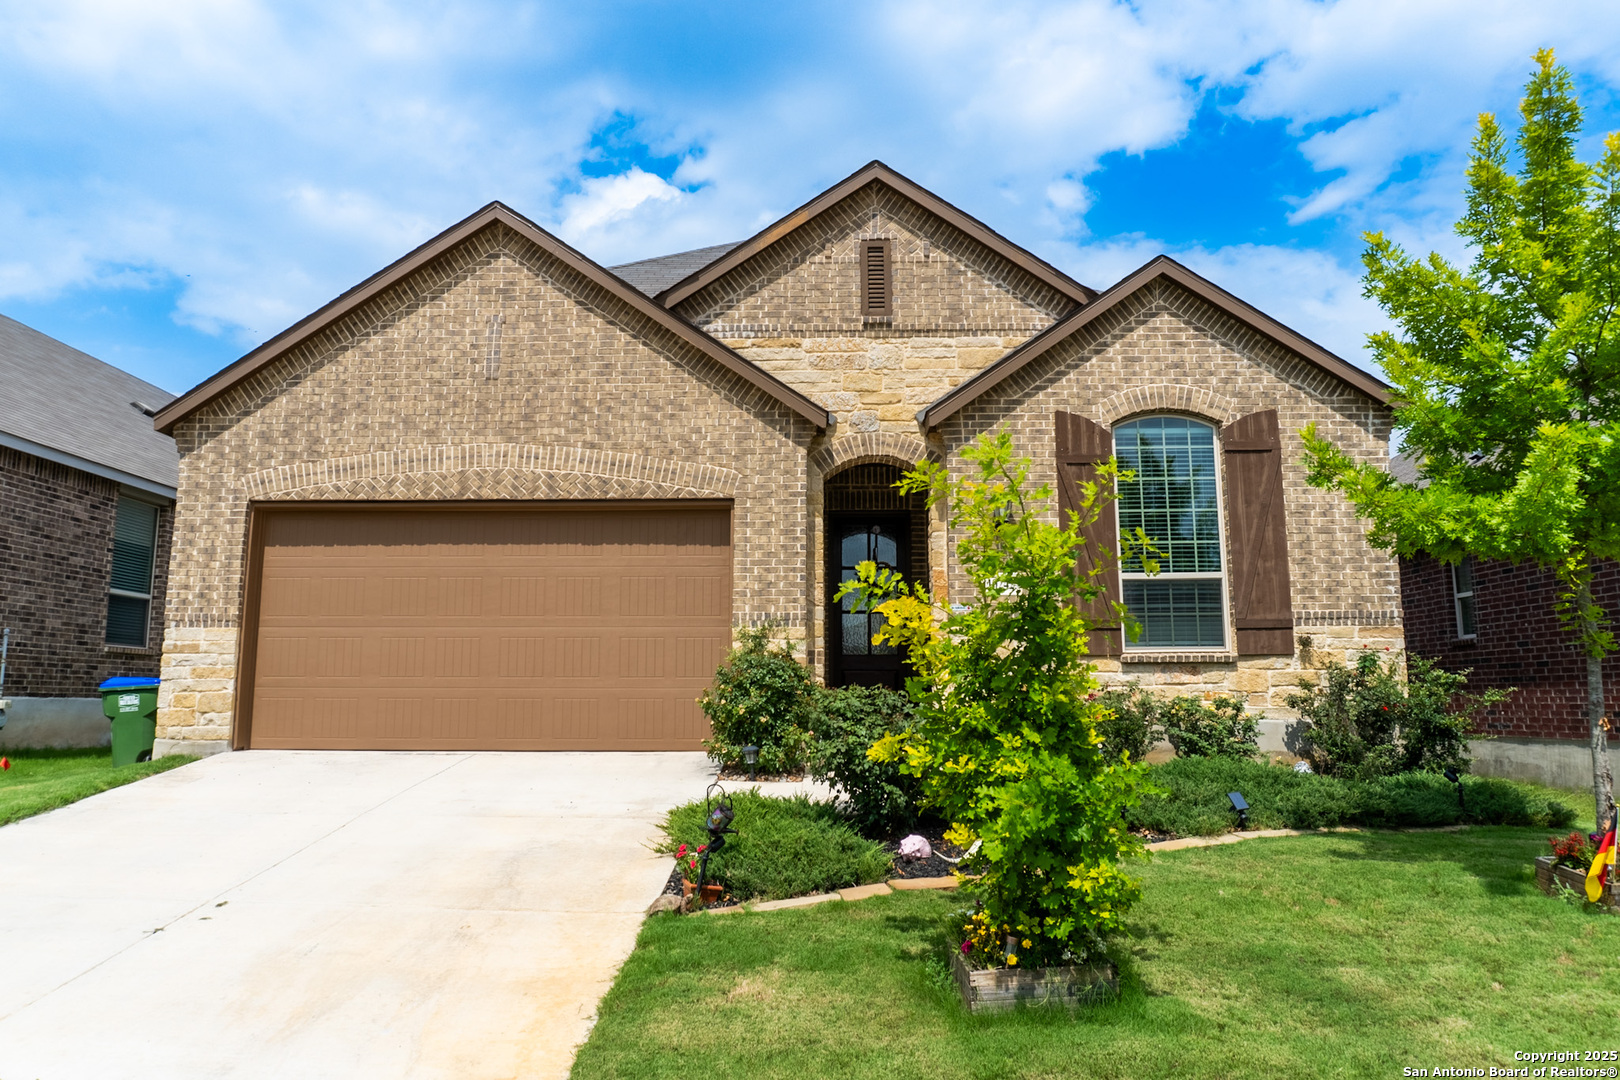
Active
$395,000
4
bds
|
3
ba
|
2,133
sqft
|
built
2019
10242 Nate Range, San Antonio, TX 78254
$-1,018
Cash flow
-13.4%
Cash-on-Cash Return
3.2%
Cap rate
0.6%
Rent to Value Ratio
Active
$329,000
4
bds
|
2
ba
|
1,528
sqft
|
built
1976
2714 Floral Way Dr, San Antonio, TX 78247
$-1,130
Cash flow
-17.9%
Cash-on-Cash Return
2.2%
Cap rate
0.5%
Rent to Value Ratio
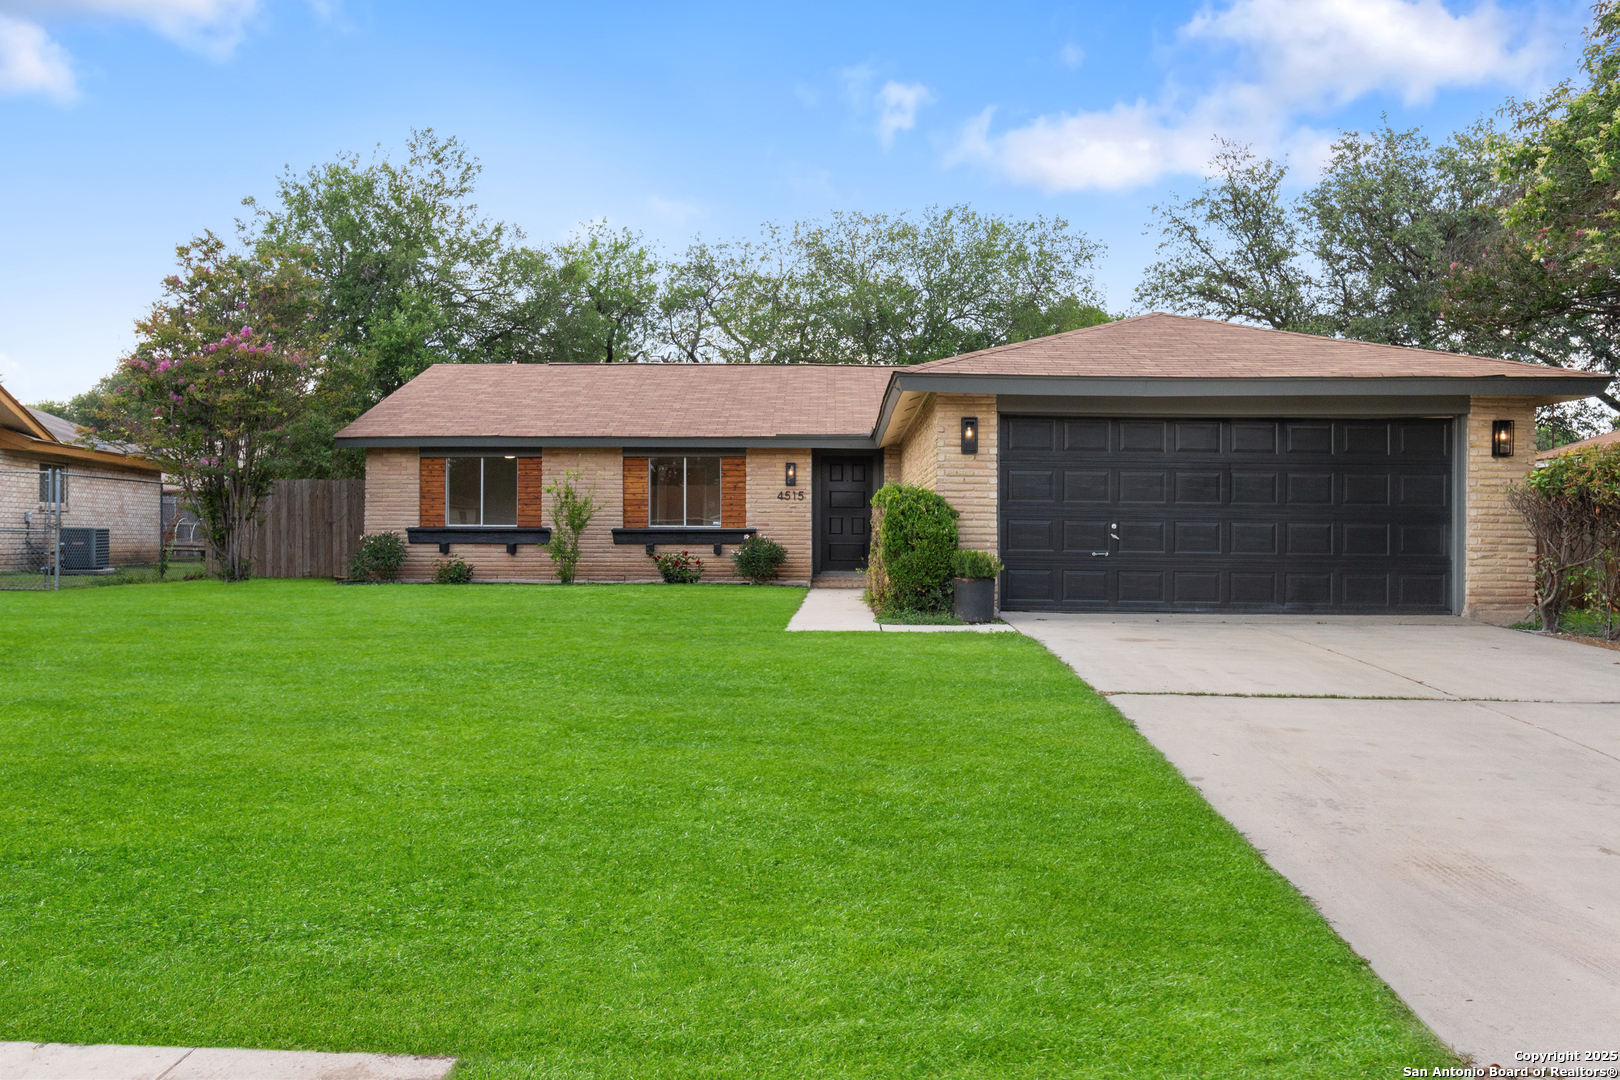
Active
$274,800
3
bds
|
2
ba
|
1,492
sqft
|
built
1974
4515 Timberhill, San Antonio, TX 78238
$-782
Cash flow
-14.8%
Cash-on-Cash Return
2.9%
Cap rate
0.6%
Rent to Value Ratio
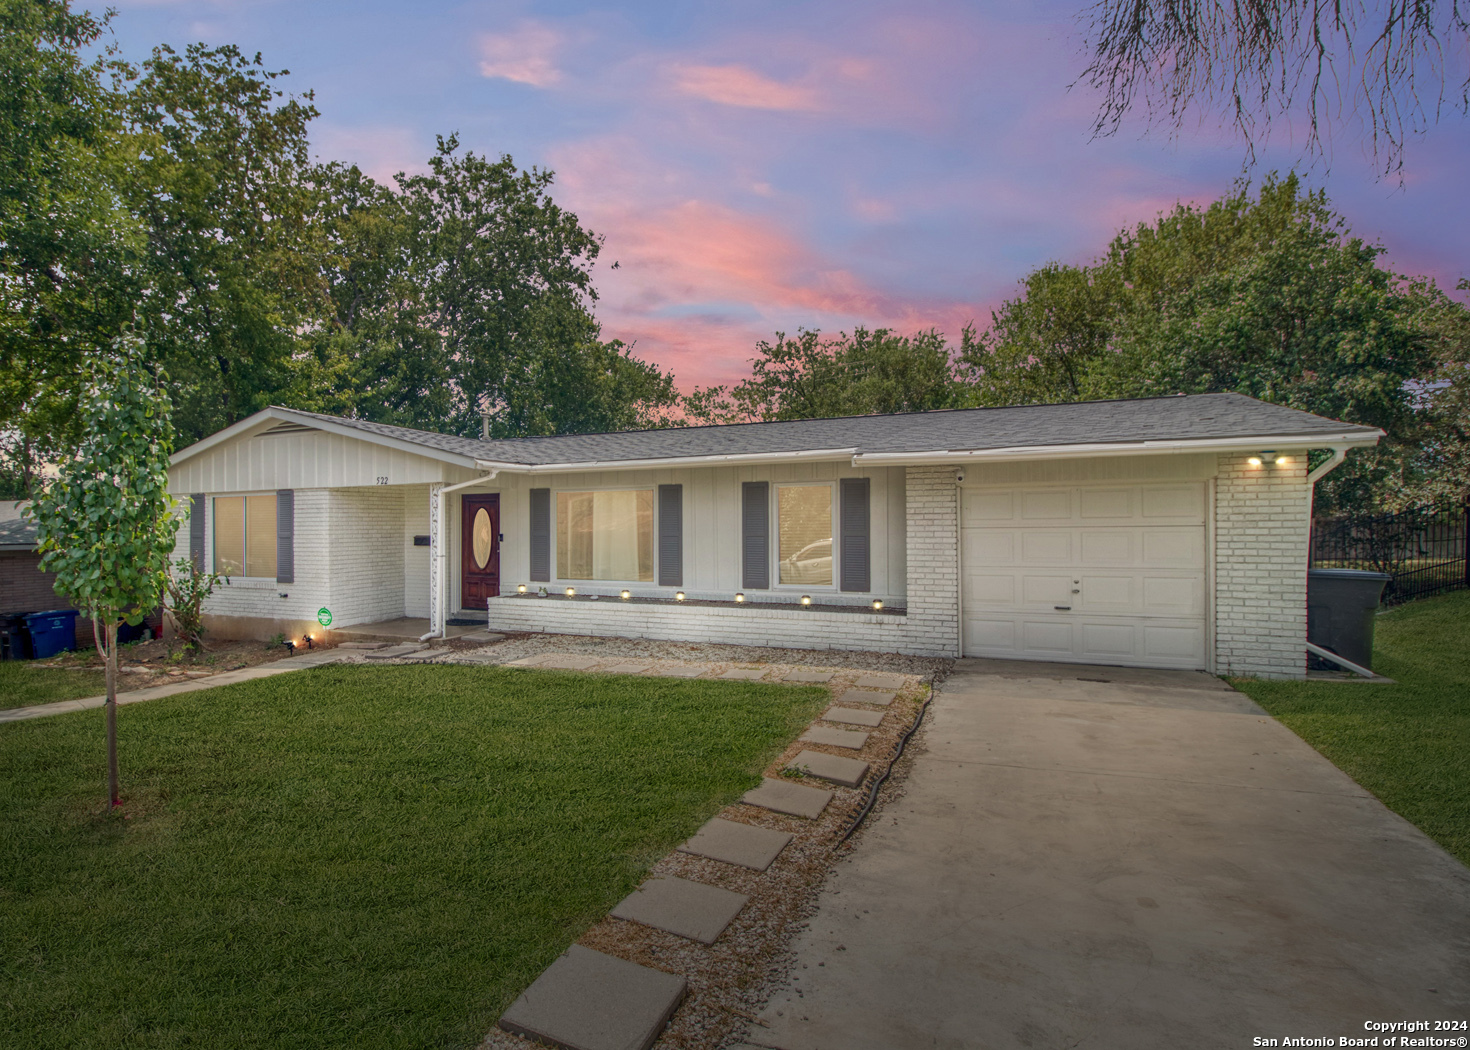
Active
$249,000
3
bds
|
2
ba
|
1,306
sqft
|
built
1959
522 E Rector St, San Antonio, TX 78216
$-441
Cash flow
-9.2%
Cash-on-Cash Return
4.2%
Cap rate
0.8%
Rent to Value Ratio
Active
$156,000
3
bds
|
1
ba
|
1,200
sqft
|
built
1930
213 W Hart Ave, San Antonio, TX 78214
$-32
Cash flow
-1.1%
Cash-on-Cash Return
6.0%
Cap rate
1.0%
Rent to Value Ratio
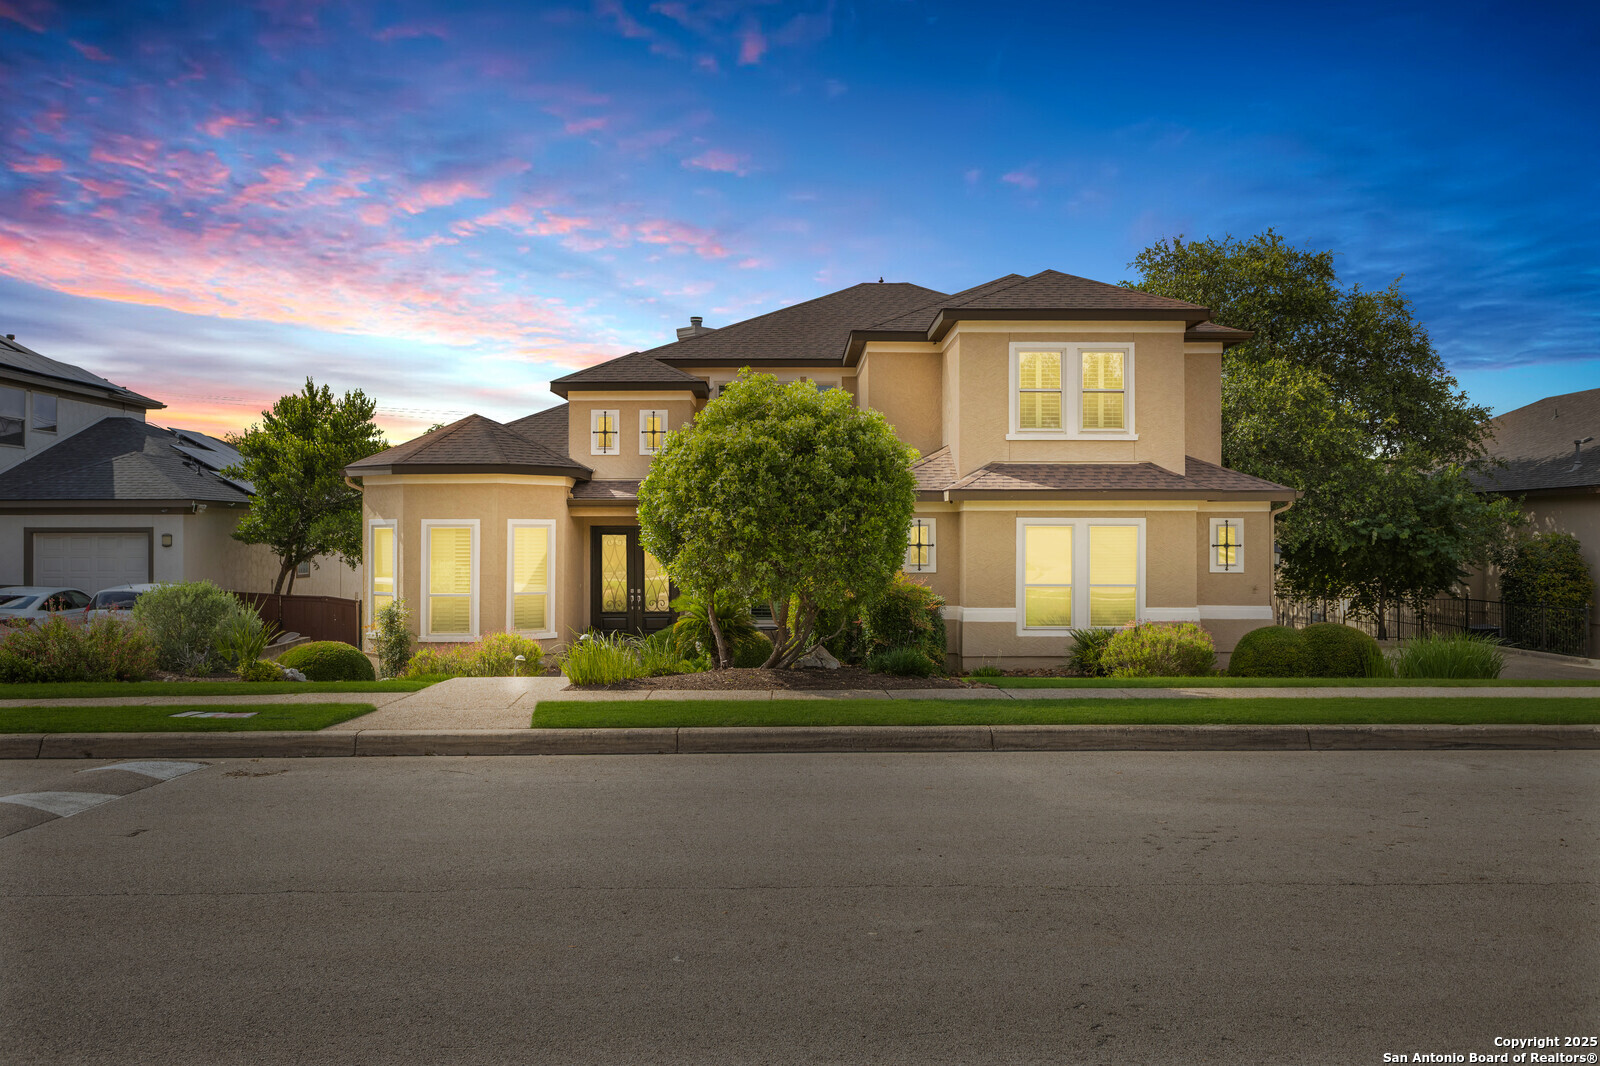
Active
$799,000
5
bds
|
4
ba
|
3,782
sqft
|
built
2010
511 Rio Spgs, San Antonio, TX 78258
$-2,891
Cash flow
-18.9%
Cash-on-Cash Return
1.9%
Cap rate
0.5%
Rent to Value Ratio
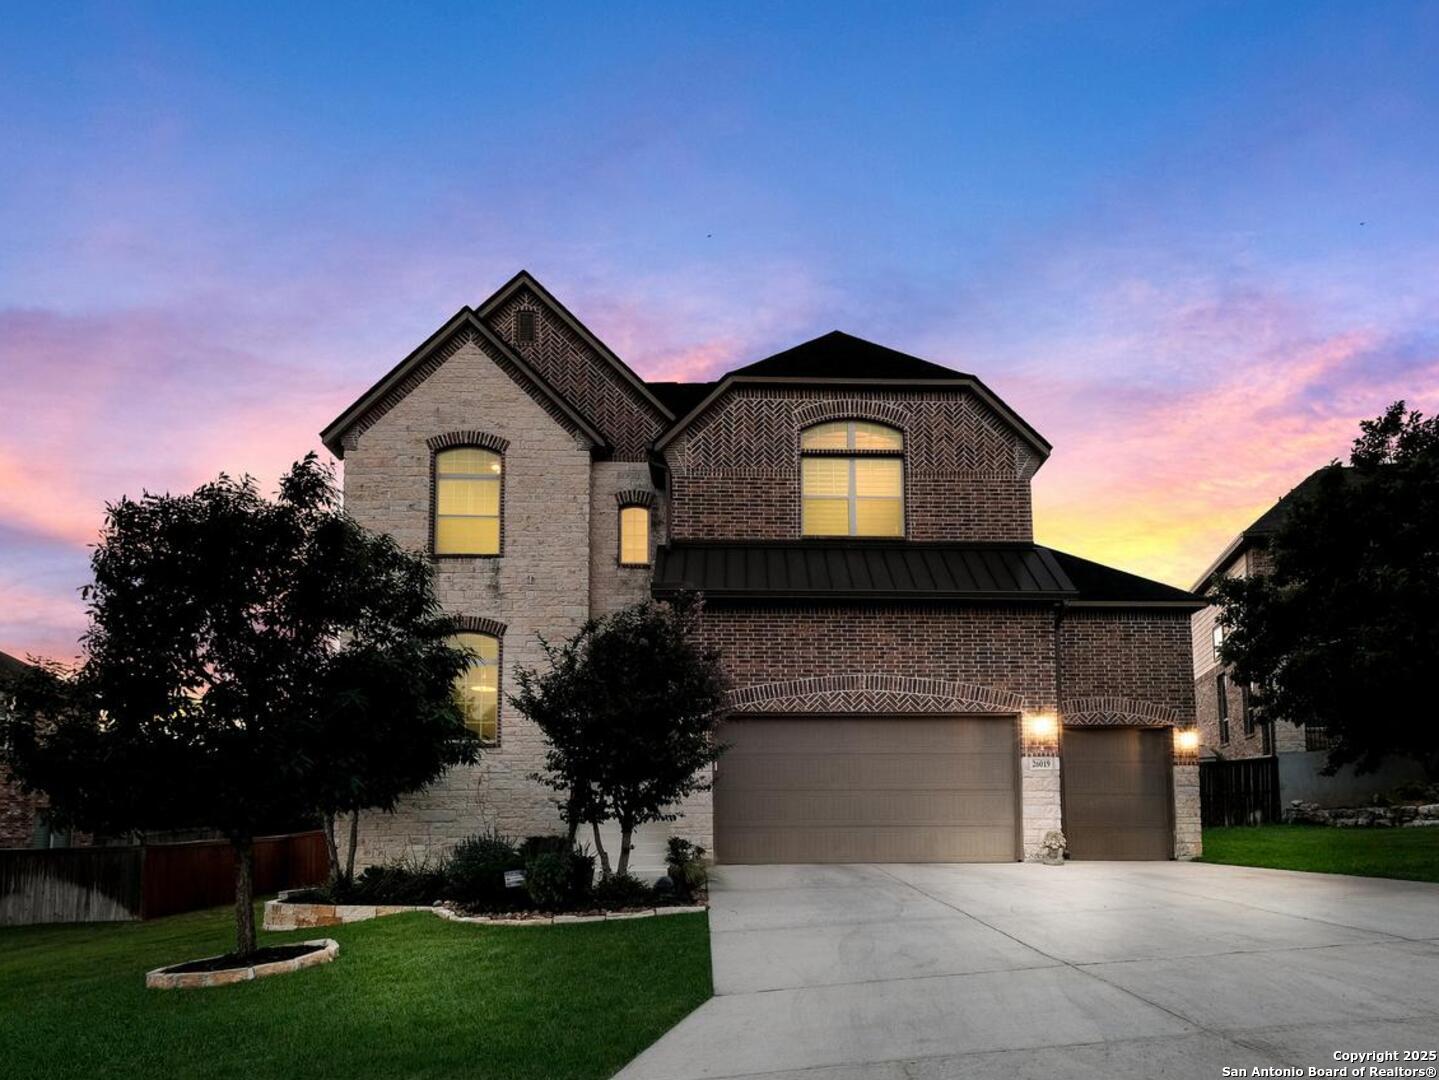
Active under contract
$750,000
4
bds
|
4
ba
|
3,709
sqft
|
built
2014
26019 Red Heron, San Antonio, TX 78261
$-2,816
Cash flow
-19.6%
Cash-on-Cash Return
1.8%
Cap rate
0.4%
Rent to Value Ratio
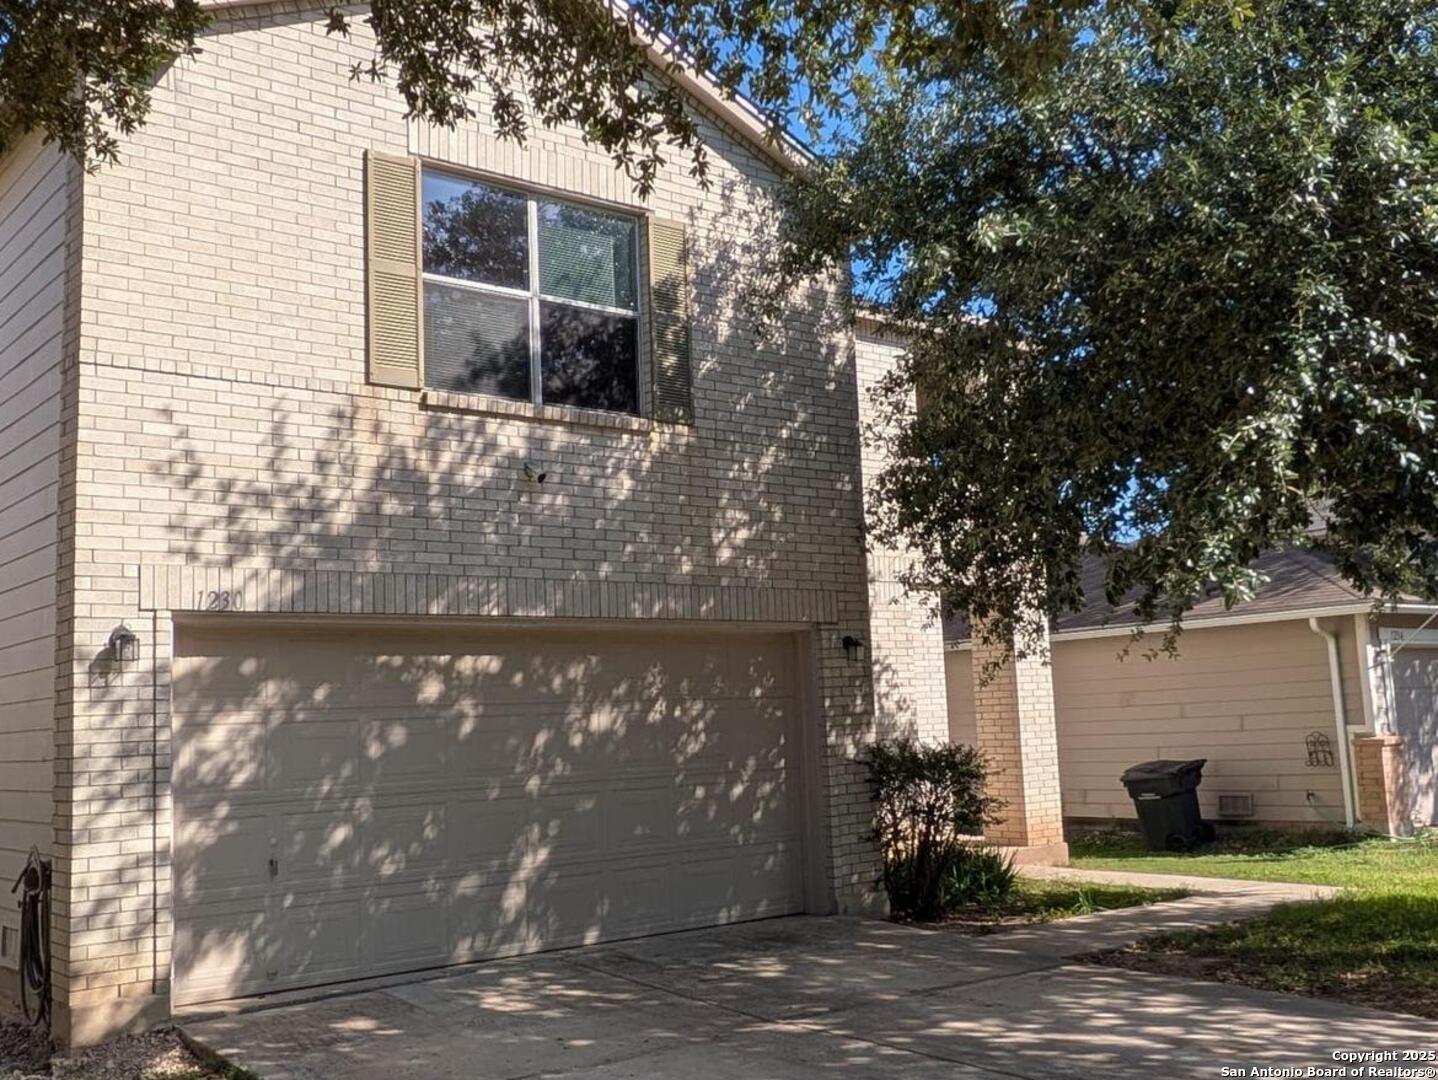
Active
$255,000
3
bds
|
3
ba
|
2,244
sqft
|
built
2004
1230 Range Fld, San Antonio, TX 78245
$-618
Cash flow
-12.6%
Cash-on-Cash Return
3.4%
Cap rate
0.7%
Rent to Value Ratio
Active under contract
$789,500
3
bds
|
4
ba
|
3,154
sqft
|
built
2017
18426 Wild Onion, San Antonio, TX 78258
$-3,010
Cash flow
-19.9%
Cash-on-Cash Return
1.7%
Cap rate
0.5%
Rent to Value Ratio
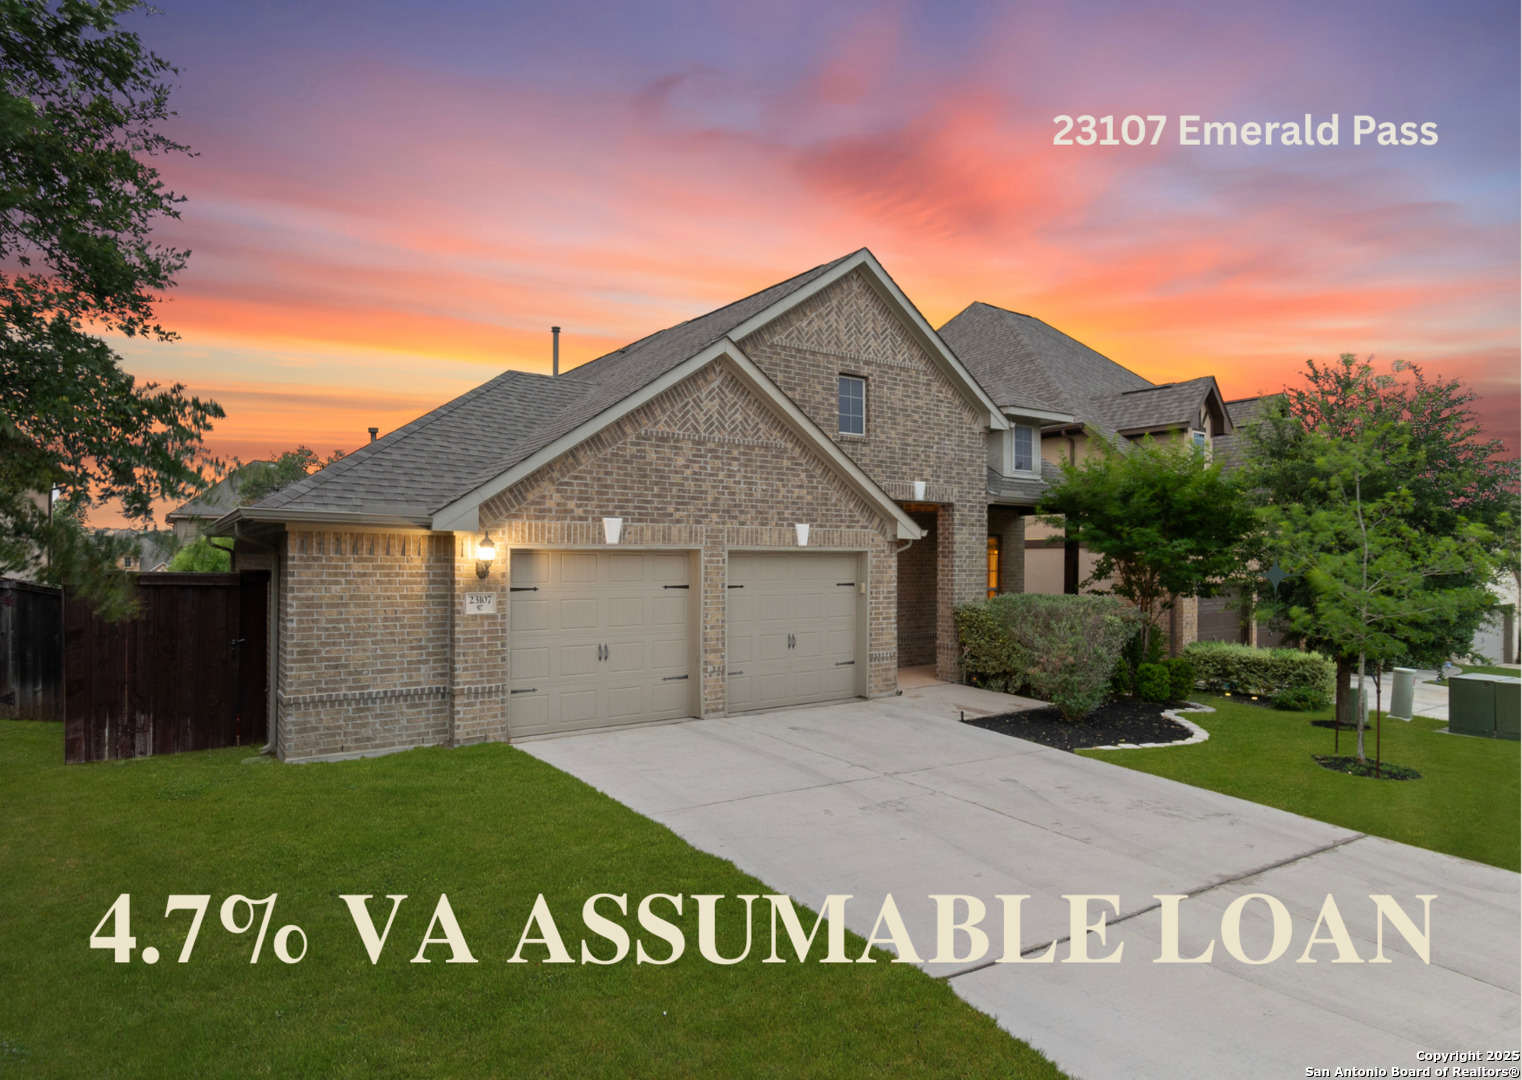
Active
$550,000
4
bds
|
2
ba
|
2,138
sqft
|
built
2018
23107 Emerald Pass, San Antonio, TX 78258
$-1,706
Cash flow
-16.2%
Cash-on-Cash Return
2.6%
Cap rate
0.5%
Rent to Value Ratio