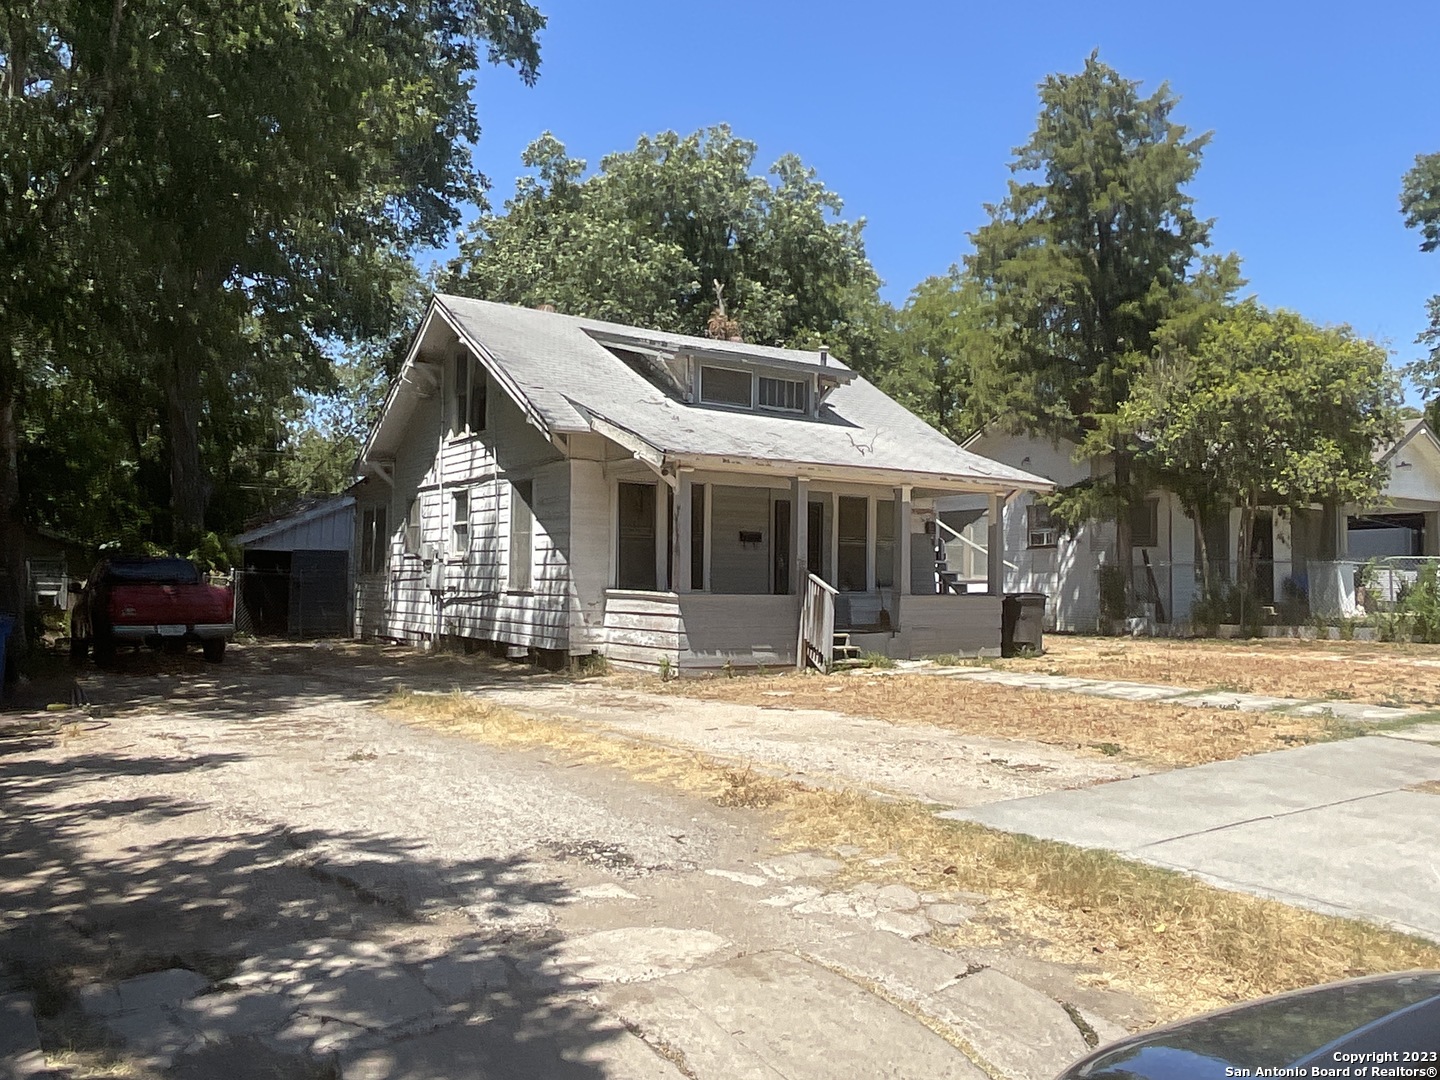
San Antonio, TX Investment Properties for Sale
Browse homes for sale and investment properties in San Antonio, TX. Refine your search by price, property type, or more.
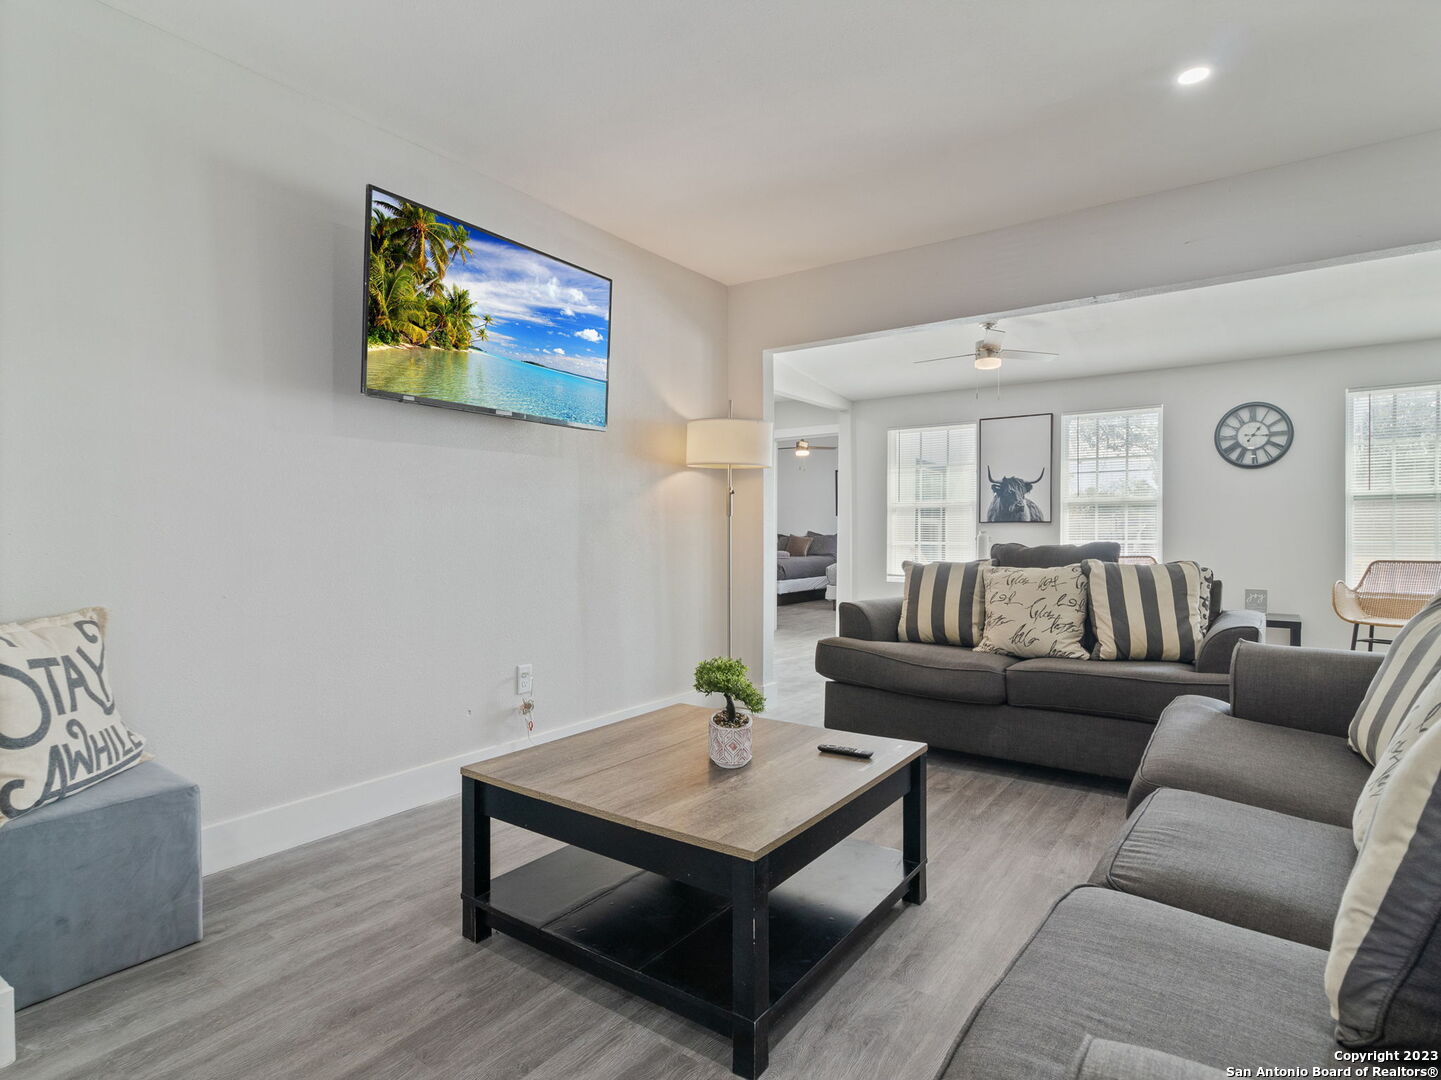
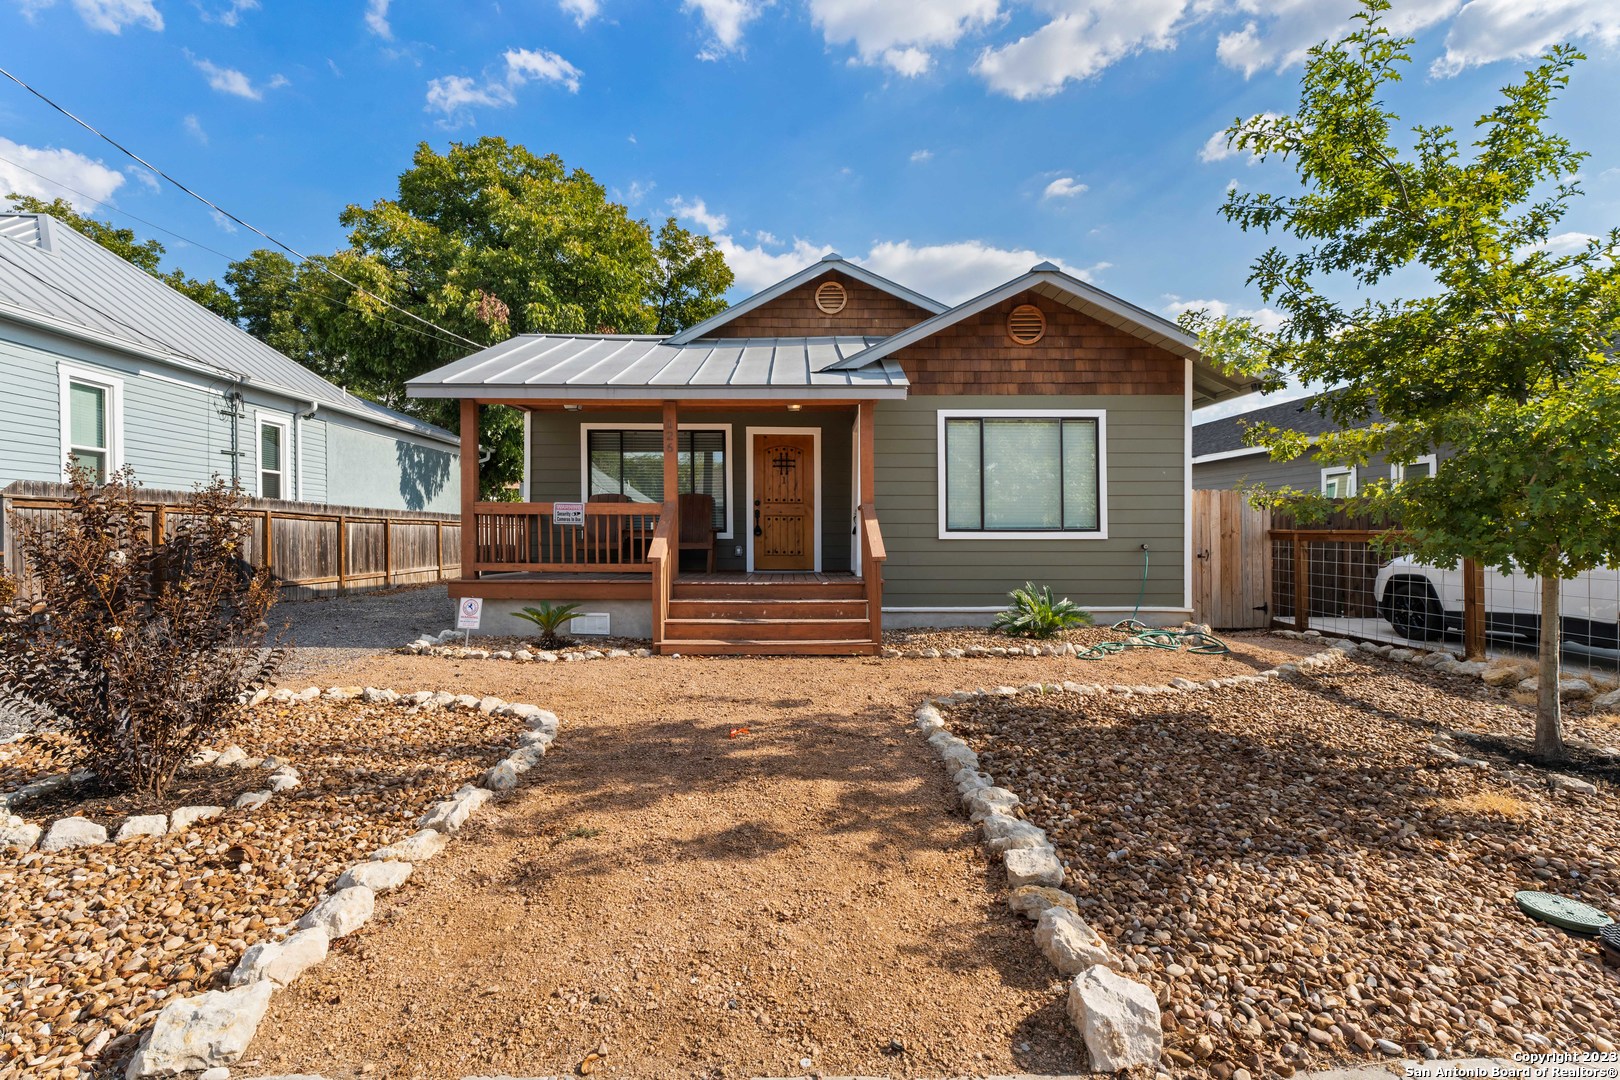
Best cash flowing properties in San Antonio, TX
Active
$72,450
1
bds
|
1
ba
|
598
sqft
|
built
1930
113 Brown Aly, San Antonio, TX 78202
$340
Cash flow
5.5%
Cash-on-Cash Return
5.6%
Cap rate
1.0%
Rent to Value Ratio
Active
$115,000
3
bds
|
1
ba
|
864
sqft
|
built
1950
1330 W Vestal Pl, San Antonio, TX 78221
$-117
Cash flow
-5.3%
Cash-on-Cash Return
5.1%
Cap rate
1.0%
Rent to Value Ratio
5,878 out of 6,167 properties for sale in San Antonio, TX
Limited Results Shown
Create a free account, or log in to reveal all property listings and enjoy the complete experience.

Active
$675,000
3
bds
|
4
ba
|
2,880
sqft
|
built
2016
12014 Sunburst St, San Antonio, TX 78230
$-2,037
Cash flow
-15.7%
Cash-on-Cash Return
2.7%
Cap rate
0.6%
Rent to Value Ratio
Active
$398,000
3
bds
|
2
ba
|
1,743
sqft
|
built
1940
126 Lucas St, San Antonio, TX 78209
$-1,057
Cash flow
-13.9%
Cash-on-Cash Return
3.1%
Cap rate
0.7%
Rent to Value Ratio

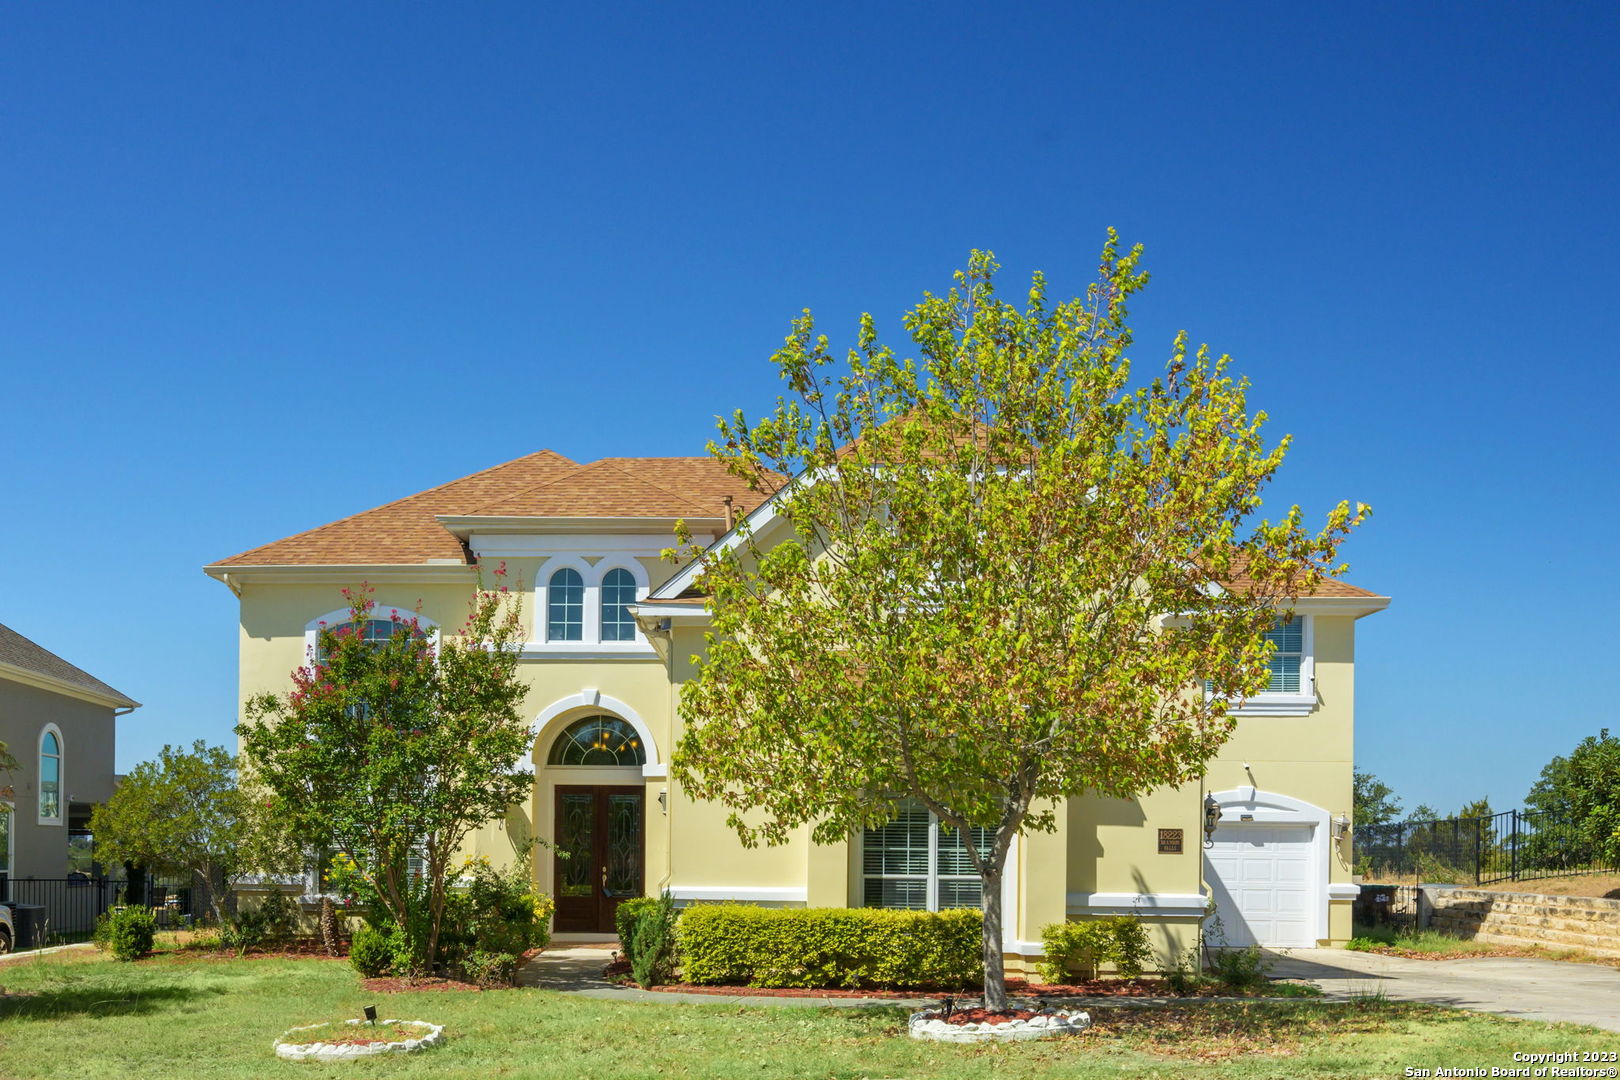
Active
$2,200,000
4
bds
|
7
ba
|
5,931
sqft
|
built
2019
24 Glandore, San Antonio, TX 78260
$-9,092
Cash flow
-21.6%
Cash-on-Cash Return
1.3%
Cap rate
0.4%
Rent to Value Ratio

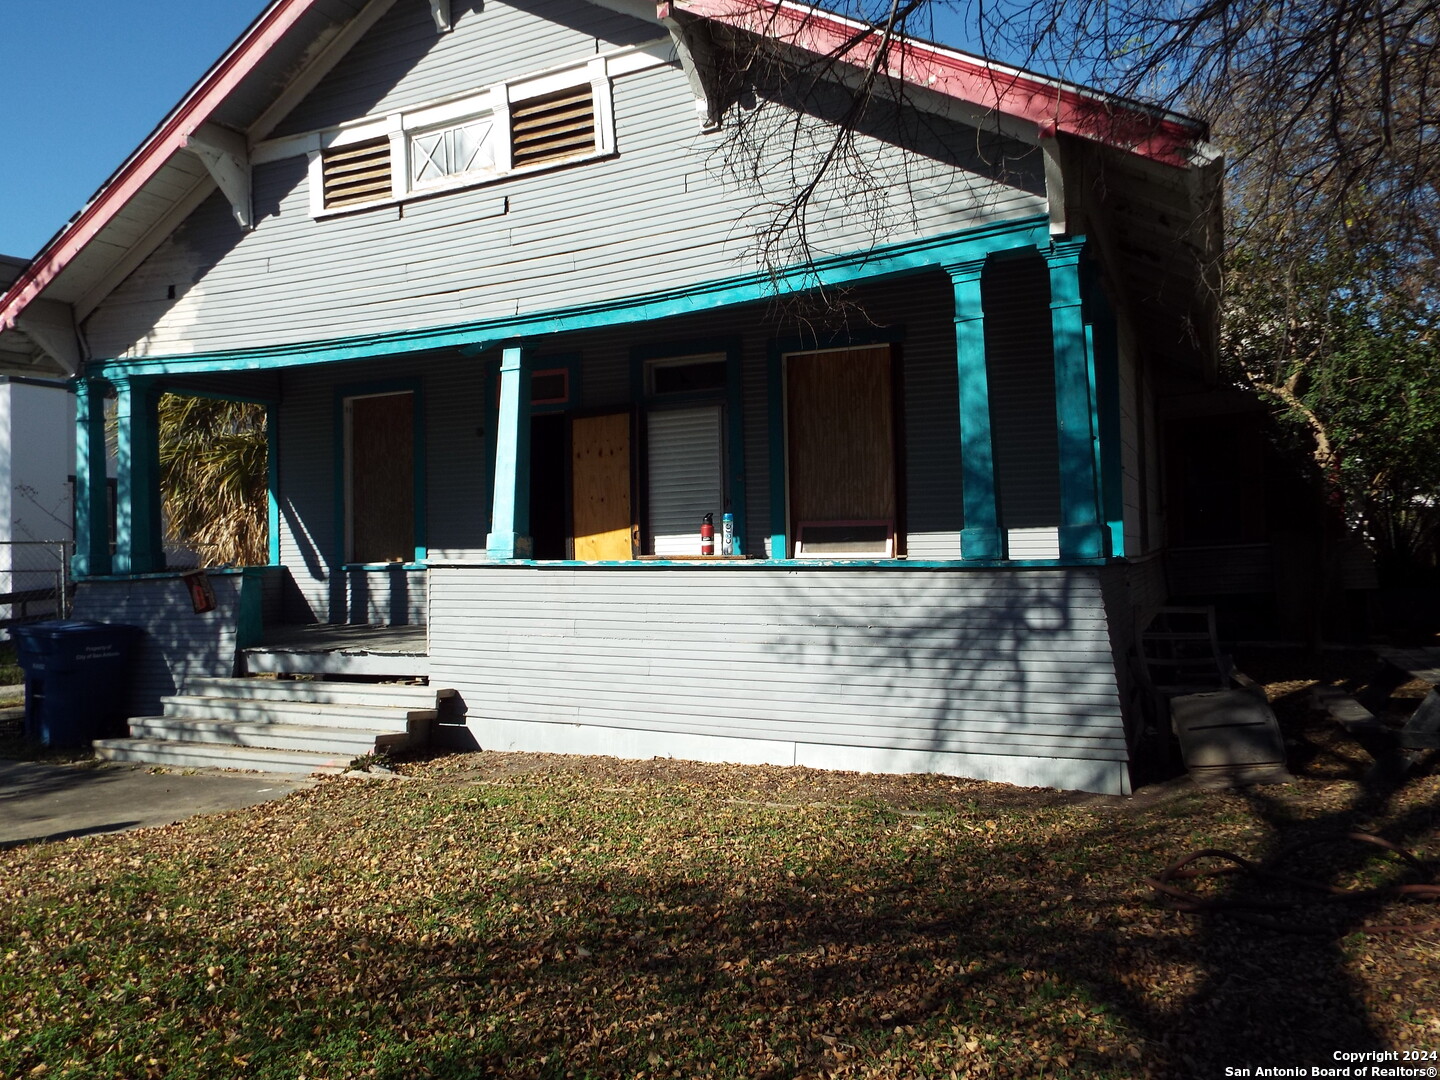
Active
$319,500
3
bds
|
2
ba
|
1,492
sqft
|
built
1928
1119 Mc Kinley Ave, San Antonio, TX 78210
$-913
Cash flow
-14.9%
Cash-on-Cash Return
2.9%
Cap rate
0.5%
Rent to Value Ratio

Active
$382,900
3
bds
|
2
ba
|
1,945
sqft
|
built
2006
12527 Cascade Hls, San Antonio, TX 78253
$-1,216
Cash flow
-16.6%
Cash-on-Cash Return
2.5%
Cap rate
0.6%
Rent to Value Ratio
Active
$479,000
5
bds
|
4
ba
|
3,337
sqft
|
built
2019
11135 Silver Thistle, San Antonio, TX 78245
$-1,370
Cash flow
-14.9%
Cash-on-Cash Return
2.9%
Cap rate
0.6%
Rent to Value Ratio
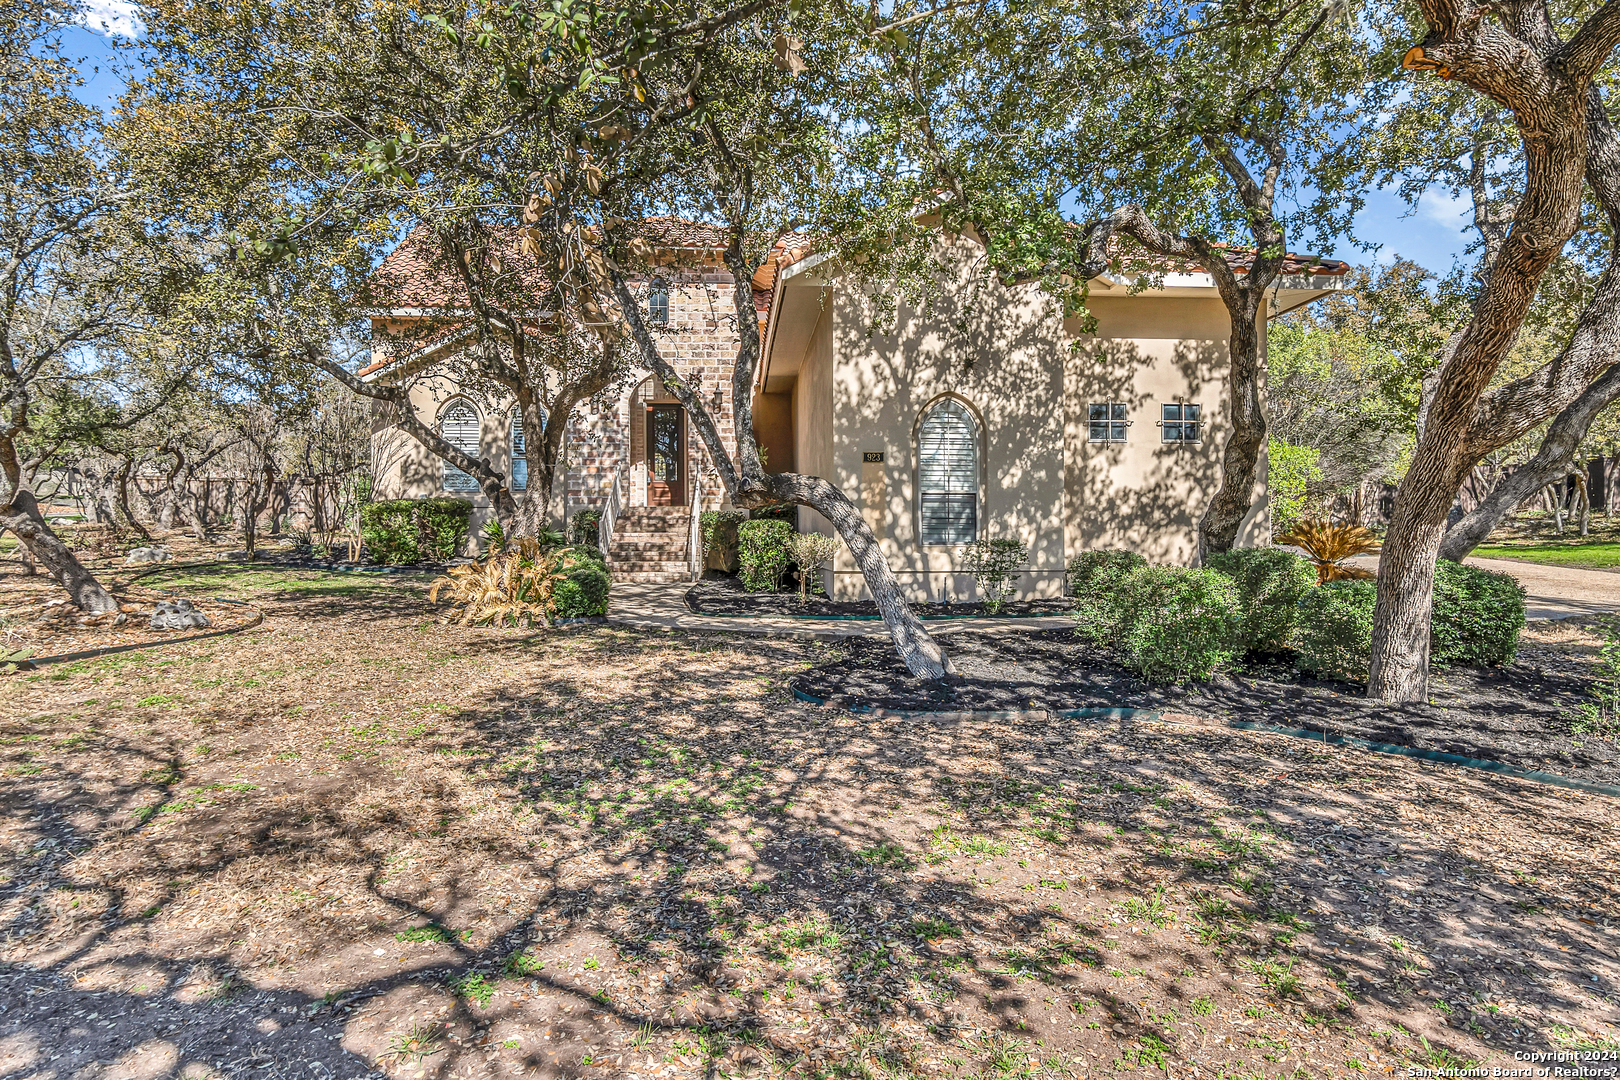
Active
$899,000
4
bds
|
3
ba
|
2,991
sqft
|
built
2000
923 Foxton Dr, San Antonio, TX 78260
$-3,176
Cash flow
-18.4%
Cash-on-Cash Return
2.0%
Cap rate
0.5%
Rent to Value Ratio
Active
$194,000
3
bds
|
2
ba
|
1,920
sqft
|
built
1925
115 E Highland Blvd, San Antonio, TX 78210
$-900
Cash flow
-24.2%
Cash-on-Cash Return
0.7%
Cap rate
0.7%
Rent to Value Ratio
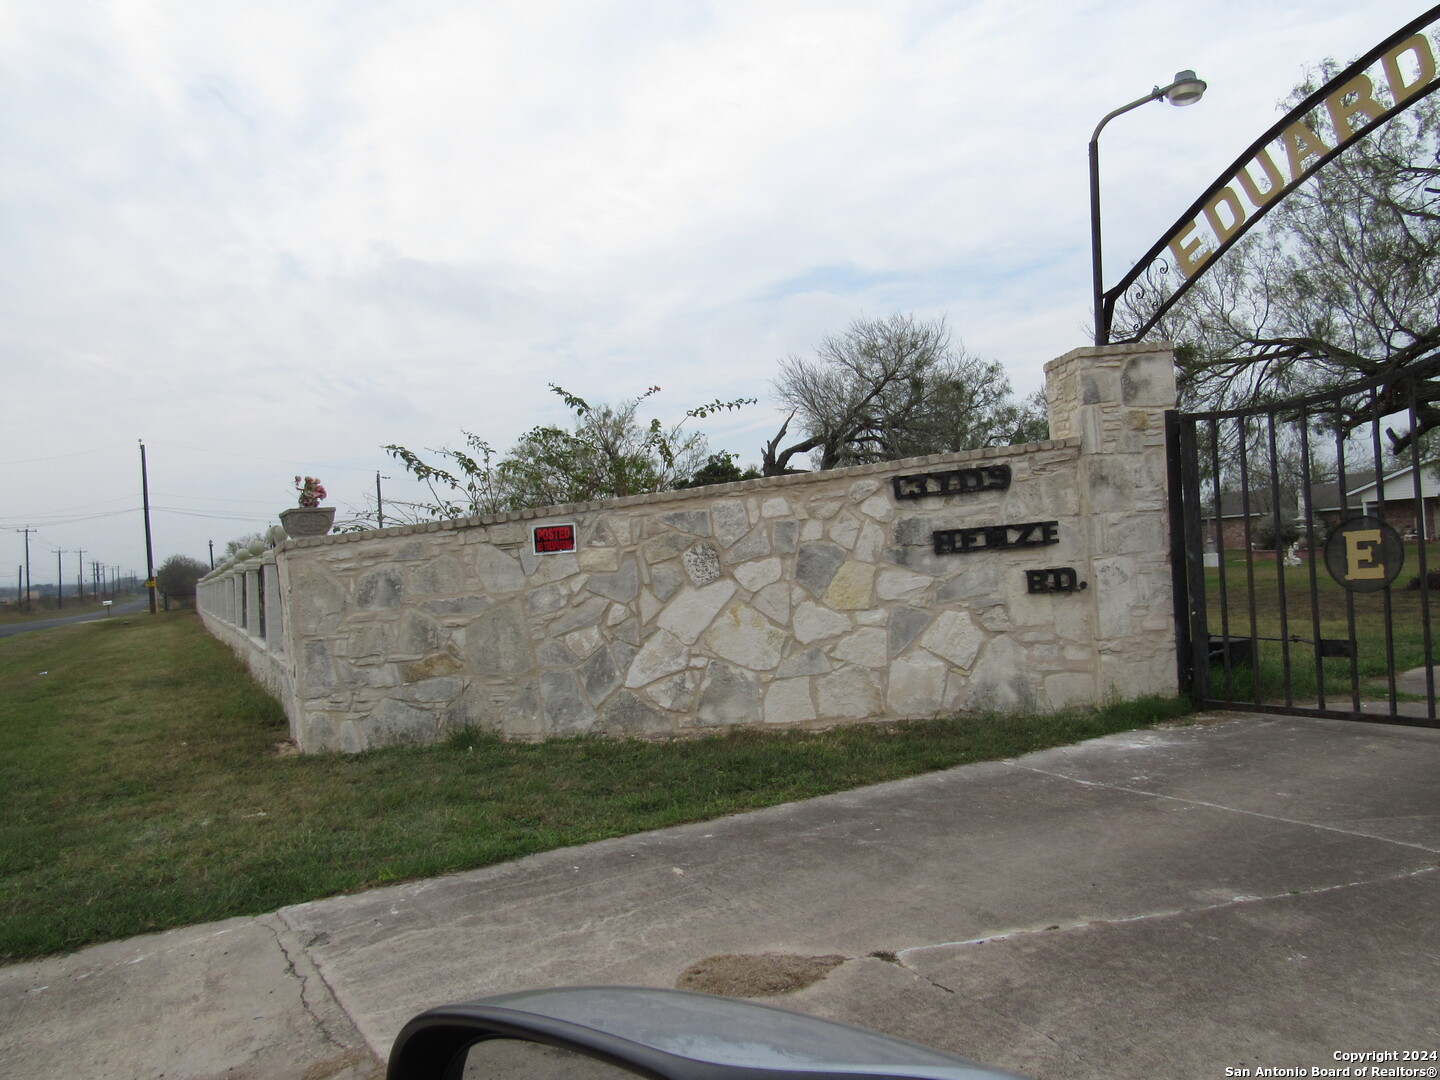
Active
$550,000
4
bds
|
4
ba
|
3,433
sqft
|
built
1981
13709 Henze Rd, San Antonio, TX 78223
$-2,195
Cash flow
-20.8%
Cash-on-Cash Return
1.5%
Cap rate
0.5%
Rent to Value Ratio
Active
$244,500
3
bds
|
2
ba
|
1,341
sqft
|
built
2006
9926 Hawksbill Peak, San Antonio, TX 78245
$-526
Cash flow
-11.2%
Cash-on-Cash Return
3.7%
Cap rate
0.7%
Rent to Value Ratio
Active
$239,500
3
bds
|
1
ba
|
1,474
sqft
|
built
1981
9643 South Bnd, San Antonio, TX 78250
$-349
Cash flow
-7.6%
Cash-on-Cash Return
4.5%
Cap rate
0.8%
Rent to Value Ratio
Active
$319,500
3
bds
|
2
ba
|
1,862
sqft
|
built
1977
8703 Timberwilde St, San Antonio, TX 78250
$-895
Cash flow
-14.6%
Cash-on-Cash Return
2.9%
Cap rate
0.6%
Rent to Value Ratio
Active
$399,000
2
bds
|
1
ba
|
1,258
sqft
|
built
1908
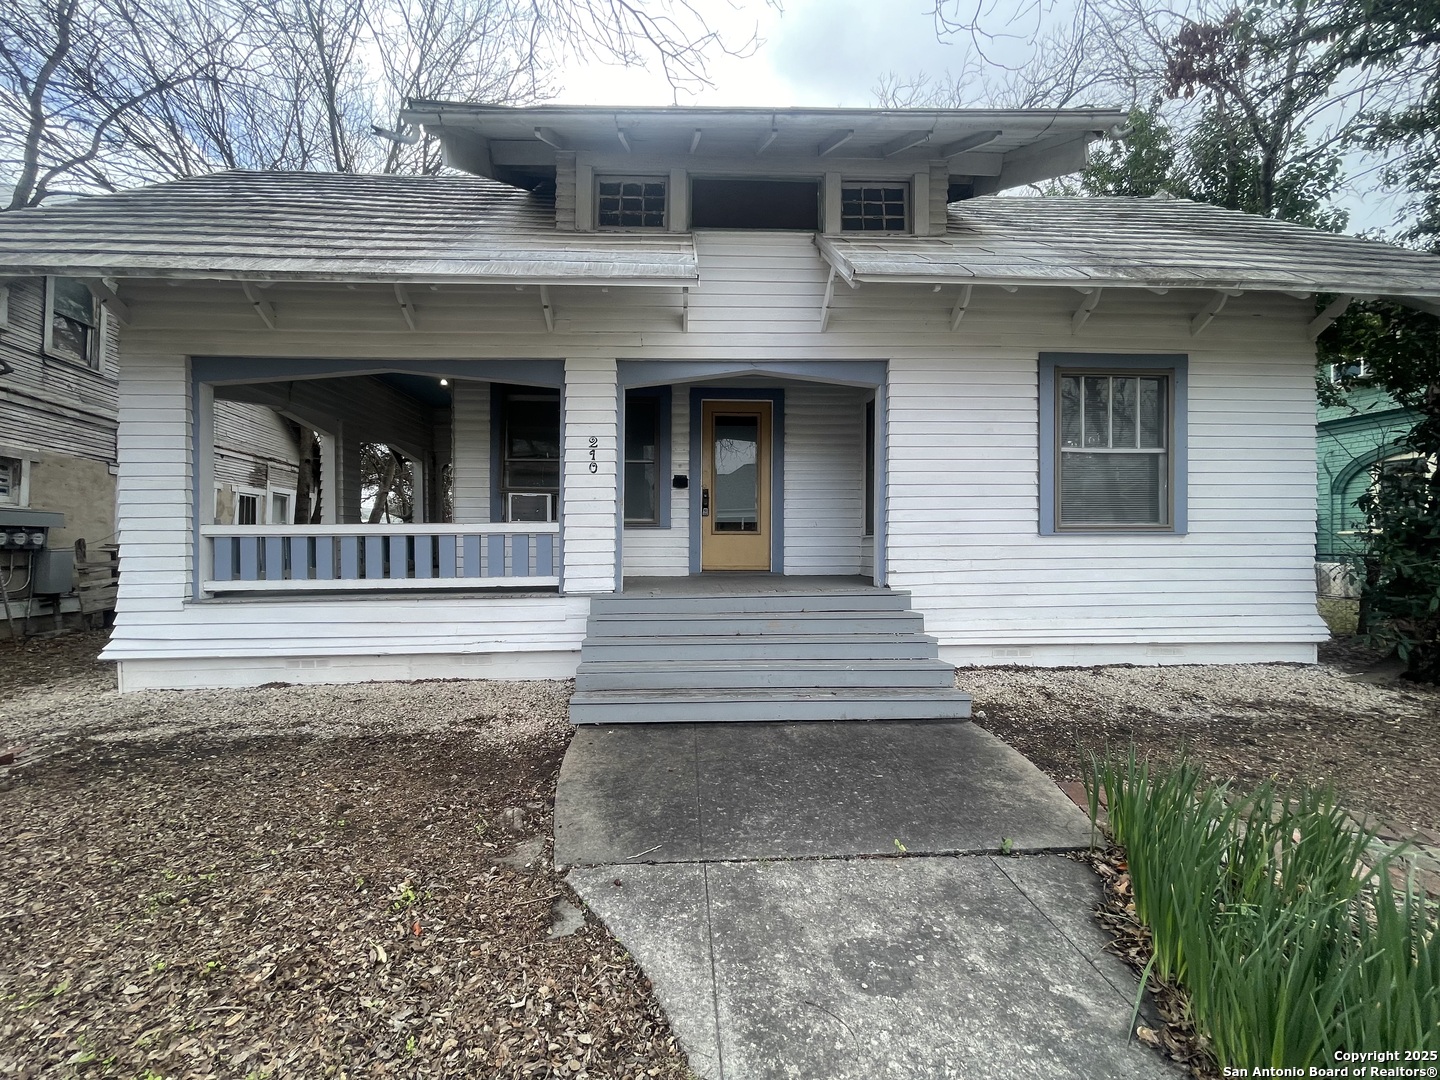
210 Florida St, San Antonio, TX 78210
$-1,846
Cash flow
-24.1%
Cash-on-Cash Return
0.7%
Cap rate
0.4%
Rent to Value Ratio
Active
$340,000
3
bds
|
2
ba
|
1,799
sqft
|
built
1961
315 Granada Dr, San Antonio, TX 78216
$-951
Cash flow
-14.6%
Cash-on-Cash Return
2.9%
Cap rate
0.6%
Rent to Value Ratio
Active
$219,999
3
bds
|
1
ba
|
1,296
sqft
|
built
1970
8627 Cape Valley St, San Antonio, TX 78227
$-383
Cash flow
-9.1%
Cash-on-Cash Return
4.2%
Cap rate
0.7%
Rent to Value Ratio

Active
$427,000
3
bds
|
2
ba
|
1,768
sqft
|
built
1947
527 N Meadowlane Dr, San Antonio, TX 78209
$-1,123
Cash flow
-13.7%
Cash-on-Cash Return
3.1%
Cap rate
0.6%
Rent to Value Ratio
Active
$152,900
3
bds
|
1
ba
|
1,732
sqft
|
built
1951
226 Avalon St, San Antonio, TX 78213
$-324
Cash flow
-11.1%
Cash-on-Cash Return
3.7%
Cap rate
0.9%
Rent to Value Ratio
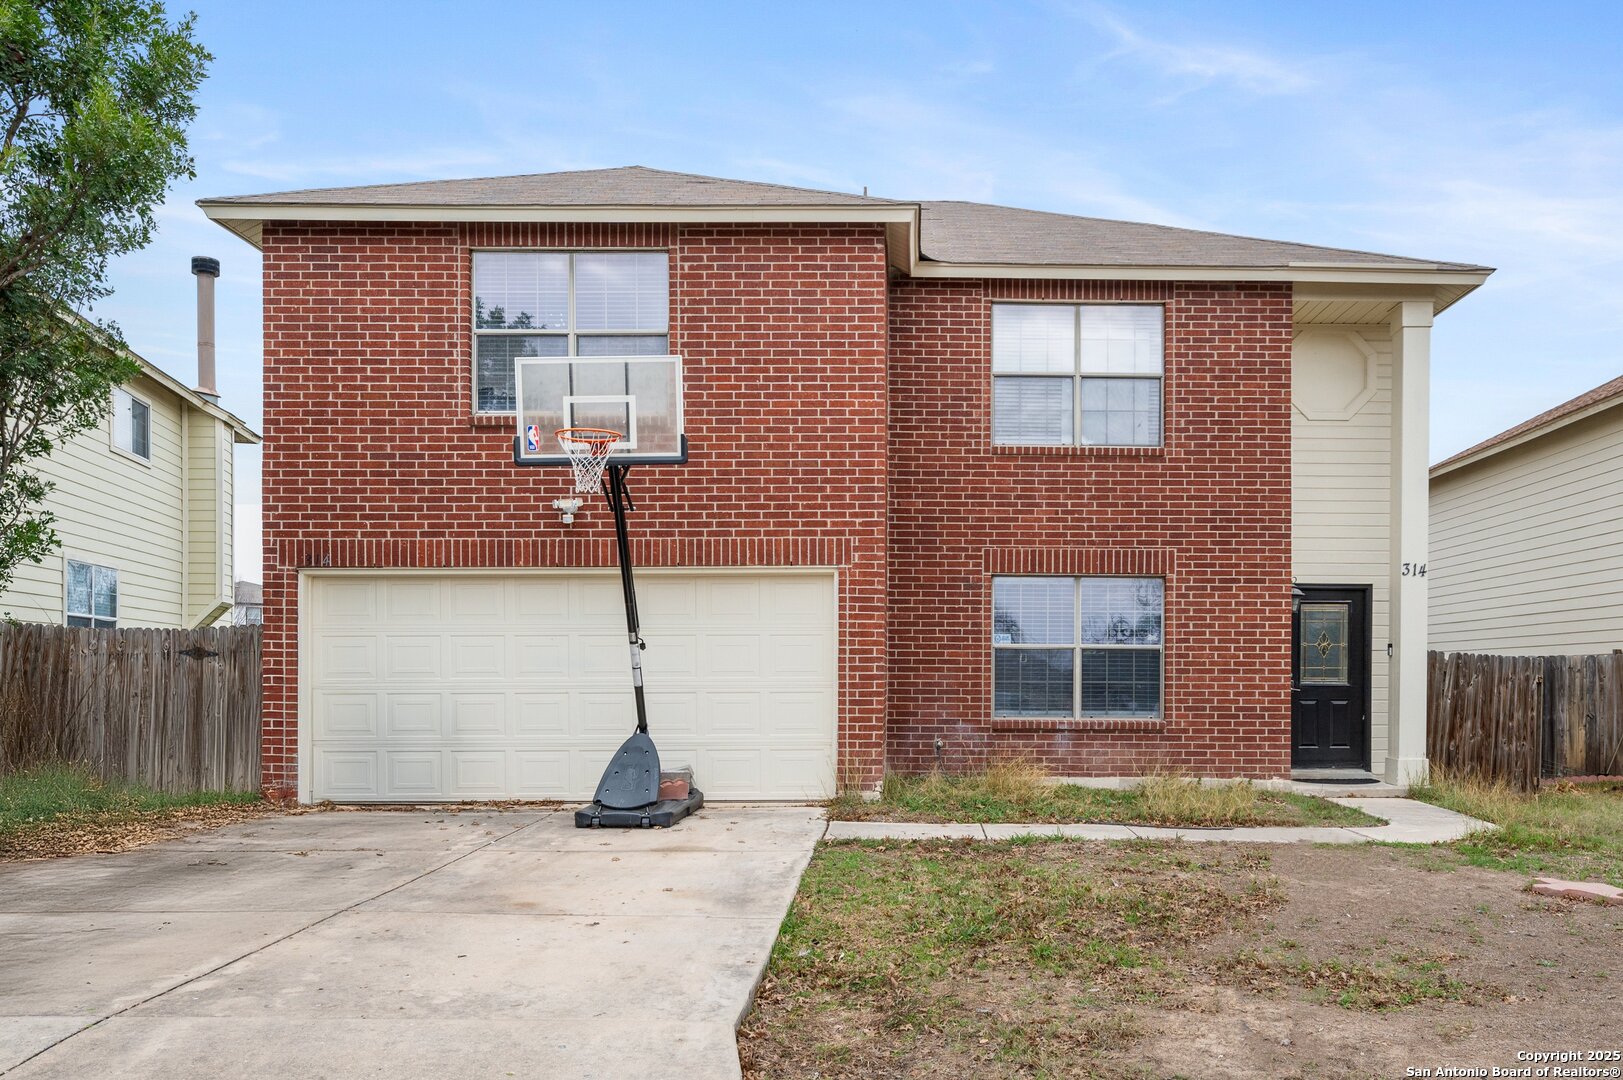
Active
$214,000
3
bds
|
3
ba
|
1,502
sqft
|
built
1930
314 Quitman St, San Antonio, TX 78208
$-657
Cash flow
-16.0%
Cash-on-Cash Return
2.6%
Cap rate
0.6%
Rent to Value Ratio
Active
$239,900
3
bds
|
2
ba
|
1,736
sqft
|
built
1970
9428 Sunny Hl, San Antonio, TX 78263
$-262
Cash flow
-5.7%
Cash-on-Cash Return
5.0%
Cap rate
0.8%
Rent to Value Ratio
Active
$115,000
3
bds
|
1
ba
|
864
sqft
|
built
1950
1330 W Vestal Pl, San Antonio, TX 78221
$-117
Cash flow
-5.3%
Cash-on-Cash Return
5.1%
Cap rate
1.0%
Rent to Value Ratio
Active
$299,999
3
bds
|
2
ba
|
1,104
sqft
|
built
1918
908 Dreiss St, San Antonio, TX 78210
$-622
Cash flow
-10.8%
Cash-on-Cash Return
3.8%
Cap rate
0.7%
Rent to Value Ratio
Active
$72,450
1
bds
|
1
ba
|
598
sqft
|
built
1930
113 Brown Aly, San Antonio, TX 78202
$340
Cash flow
5.5%
Cash-on-Cash Return
5.6%
Cap rate
1.0%
Rent to Value Ratio
Active
$310,000
3
bds
|
3
ba
|
1,954
sqft
|
built
1974
1703 Autumn Woods St, San Antonio, TX 78232
$-903
Cash flow
-15.2%
Cash-on-Cash Return
2.8%
Cap rate
0.6%
Rent to Value Ratio
Active
$884,999
4
bds
|
4
ba
|
3,627
sqft
|
built
2020
12312 White Birch St, San Antonio, TX 78245
$-1,941
Cash flow
-11.4%
Cash-on-Cash Return
3.7%
Cap rate
0.6%
Rent to Value Ratio
Active
$34,900
1
bds
|
1
ba
|
688
sqft
|
built
1988
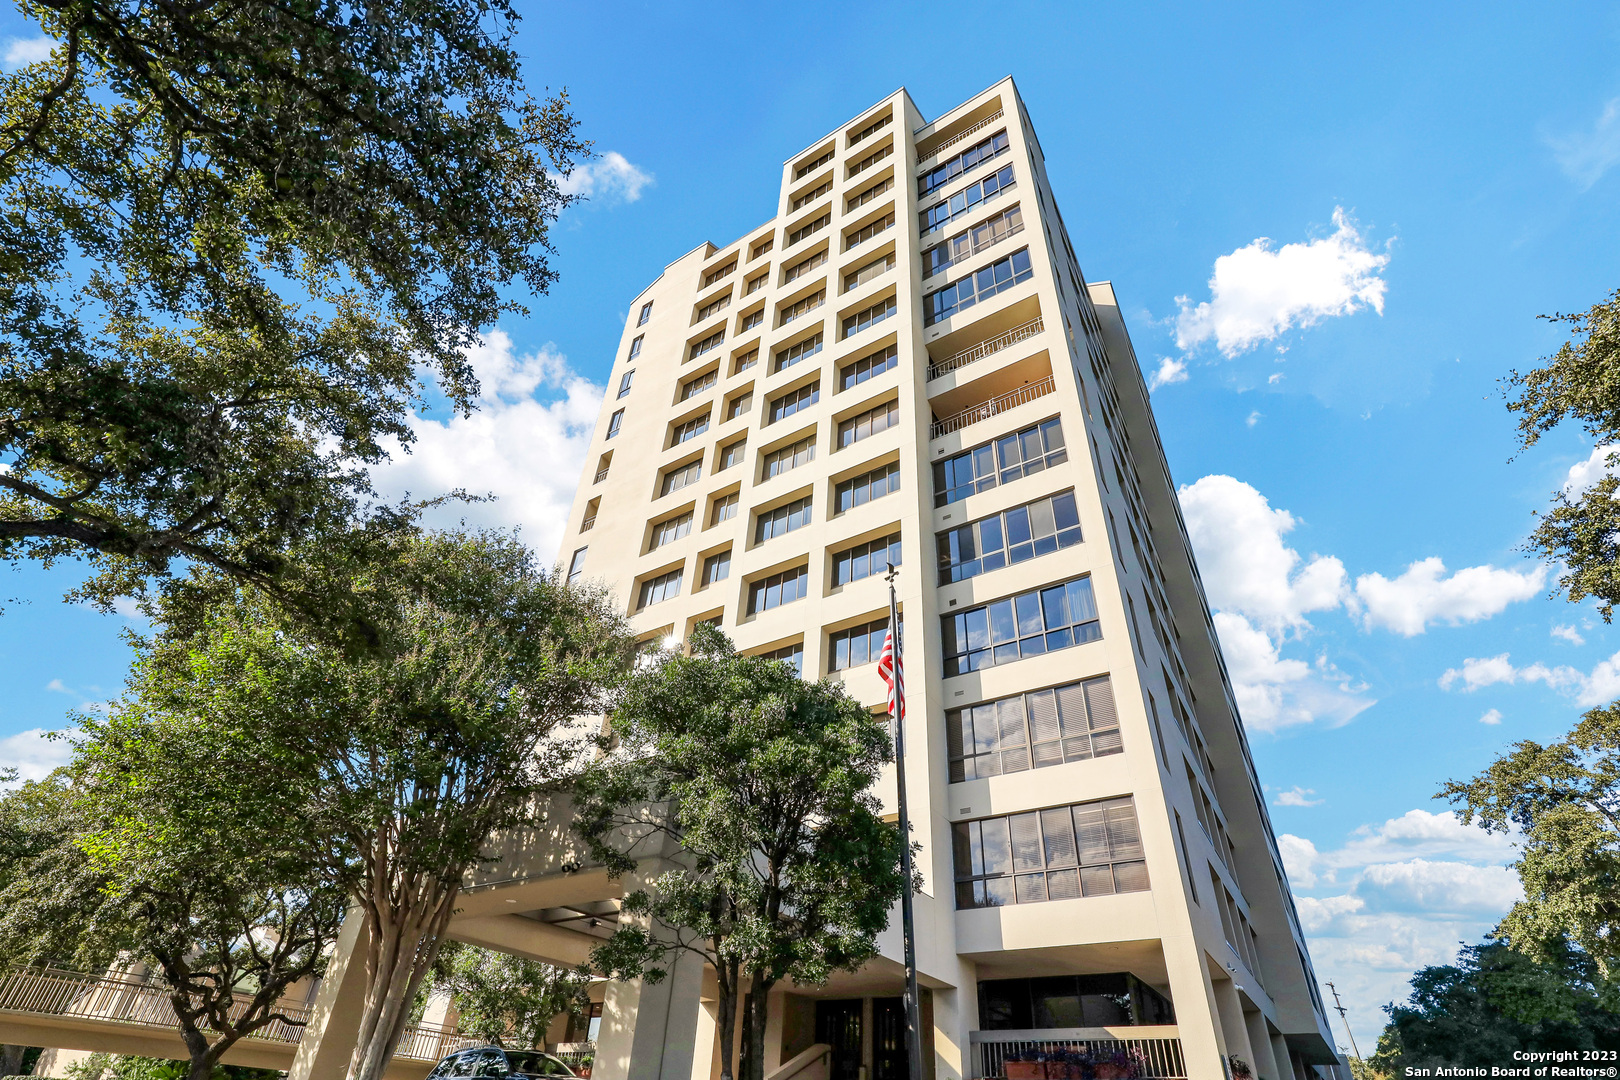
1 Towers Park Ln, San Antonio, TX 78209
$-1,231
Cash flow
-41.1%
Cash-on-Cash Return
-42.3%
Cap rate
4.0%
Rent to Value Ratio
Active
$343,500
4
bds
|
3
ba
|
1,947
sqft
|
built
1948
444 Beverly Dr, San Antonio, TX 78228
$-428
Cash flow
-6.5%
Cash-on-Cash Return
4.8%
Cap rate
0.8%
Rent to Value Ratio
Active
$525,000
2
bds
|
2
ba
|
2,092
sqft
|
built
1976
4001 N New Braunfels Ave, San Antonio, TX 78209
$-3,927
Cash flow
-39.0%
Cash-on-Cash Return
-2.7%
Cap rate
0.7%
Rent to Value Ratio
Active
$35,000
1
bds
|
1
ba
|
688
sqft
|
built
1988
1 Towers Park Ln, San Antonio, TX 78209
$-1,231
Cash flow
-41.0%
Cash-on-Cash Return
-42.2%
Cap rate
4.0%
Rent to Value Ratio
Active
$650,000
4
bds
|
0
ba
|
2,624
sqft
|
built
1930
126 Vitra Pl, San Antonio, TX 78210
$-2,827
Cash flow
-22.7%
Cash-on-Cash Return
1.1%
Cap rate
0.3%
Rent to Value Ratio
Active
$693,250
3
bds
|
4
ba
|
3,138
sqft
|
built
2000
124 Westcourt Ln, San Antonio, TX 78257
$-2,459
Cash flow
-18.5%
Cash-on-Cash Return
2.0%
Cap rate
0.6%
Rent to Value Ratio
Active
$445,000
3
bds
|
1
ba
|
998
sqft
|
built
1950
702 Everest Ave, San Antonio, TX 78209
$-1,698
Cash flow
-19.9%
Cash-on-Cash Return
1.7%
Cap rate
0.4%
Rent to Value Ratio

Active
$226,900
2
bds
|
2
ba
|
1,070
sqft
|
built
2005
16138 Barrell Run, San Antonio, TX 78247
$-681
Cash flow
-15.7%
Cash-on-Cash Return
2.7%
Cap rate
0.6%
Rent to Value Ratio
Active
$248,999
4
bds
|
3
ba
|
2,144
sqft
|
built
2003
314 Tres Caminos, San Antonio, TX 78245
$-141
Cash flow
-3.0%
Cash-on-Cash Return
5.6%
Cap rate
1.0%
Rent to Value Ratio
Active
$1,169,000
6
bds
|
6
ba
|
5,093
sqft
|
built
2003
2011 My Anns Hl, San Antonio, TX 78258
$-2,491
Cash flow
-11.1%
Cash-on-Cash Return
3.7%
Cap rate
0.7%
Rent to Value Ratio
Active
$950,000
5
bds
|
6
ba
|
4,675
sqft
|
built
2009
18223 Branson Fls, San Antonio, TX 78255
$-3,207
Cash flow
-17.6%
Cash-on-Cash Return
2.2%
Cap rate
0.5%
Rent to Value Ratio
Active
$335,000
3
bds
|
2
ba
|
1,753
sqft
|
built
2004
15727 Cotton Tail Ln, San Antonio, TX 78255
$-930
Cash flow
-14.5%
Cash-on-Cash Return
3.0%
Cap rate
0.6%
Rent to Value Ratio
Active
$148,000
2
bds
|
2
ba
|
1,008
sqft
|
built
1930
309 Mount Vernon Ct, San Antonio, TX 78223
$-259
Cash flow
-9.1%
Cash-on-Cash Return
4.2%
Cap rate
0.7%
Rent to Value Ratio
Active
$229,000
4
bds
|
2
ba
|
1,616
sqft
|
built
2018
5918 Tina Park, San Antonio, TX 78242
$-478
Cash flow
-10.9%
Cash-on-Cash Return
3.8%
Cap rate
0.8%
Rent to Value Ratio

Active
$279,000
3
bds
|
2
ba
|
1,638
sqft
|
built
1985
6050 Broadmeadow, San Antonio, TX 78240
$-645
Cash flow
-12.1%
Cash-on-Cash Return
3.5%
Cap rate
0.7%
Rent to Value Ratio
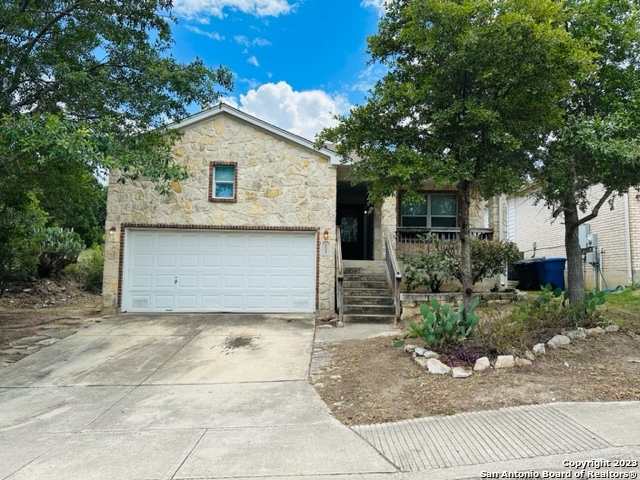
Active
$450,000
3
bds
|
2
ba
|
2,200
sqft
|
built
1988
12060 Pleasanton Rd, San Antonio, TX 78221
$-1,594
Cash flow
-18.5%
Cash-on-Cash Return
2.0%
Cap rate
0.4%
Rent to Value Ratio