San Antonio, TX Investment Properties for Sale
Browse homes for sale and investment properties in San Antonio, TX. Refine your search by price, property type, or more.
Best cash flowing properties in San Antonio, TX
Active
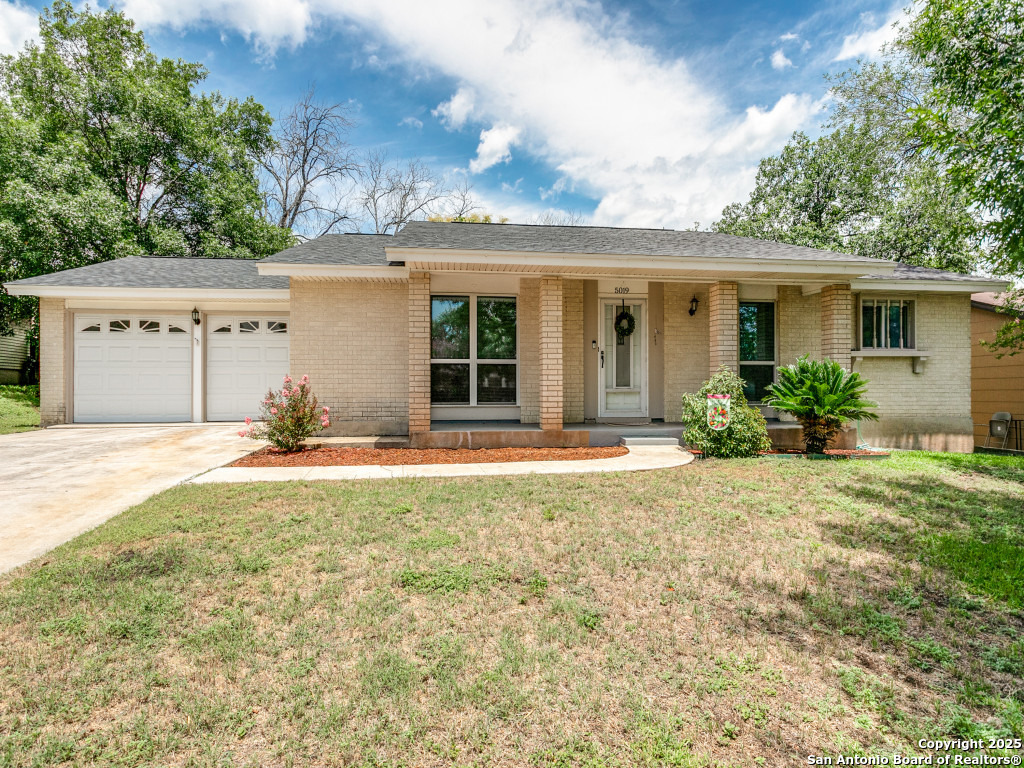
$157,000
3
bds
|
2
ba
|
1,124
sqft
|
built
1975
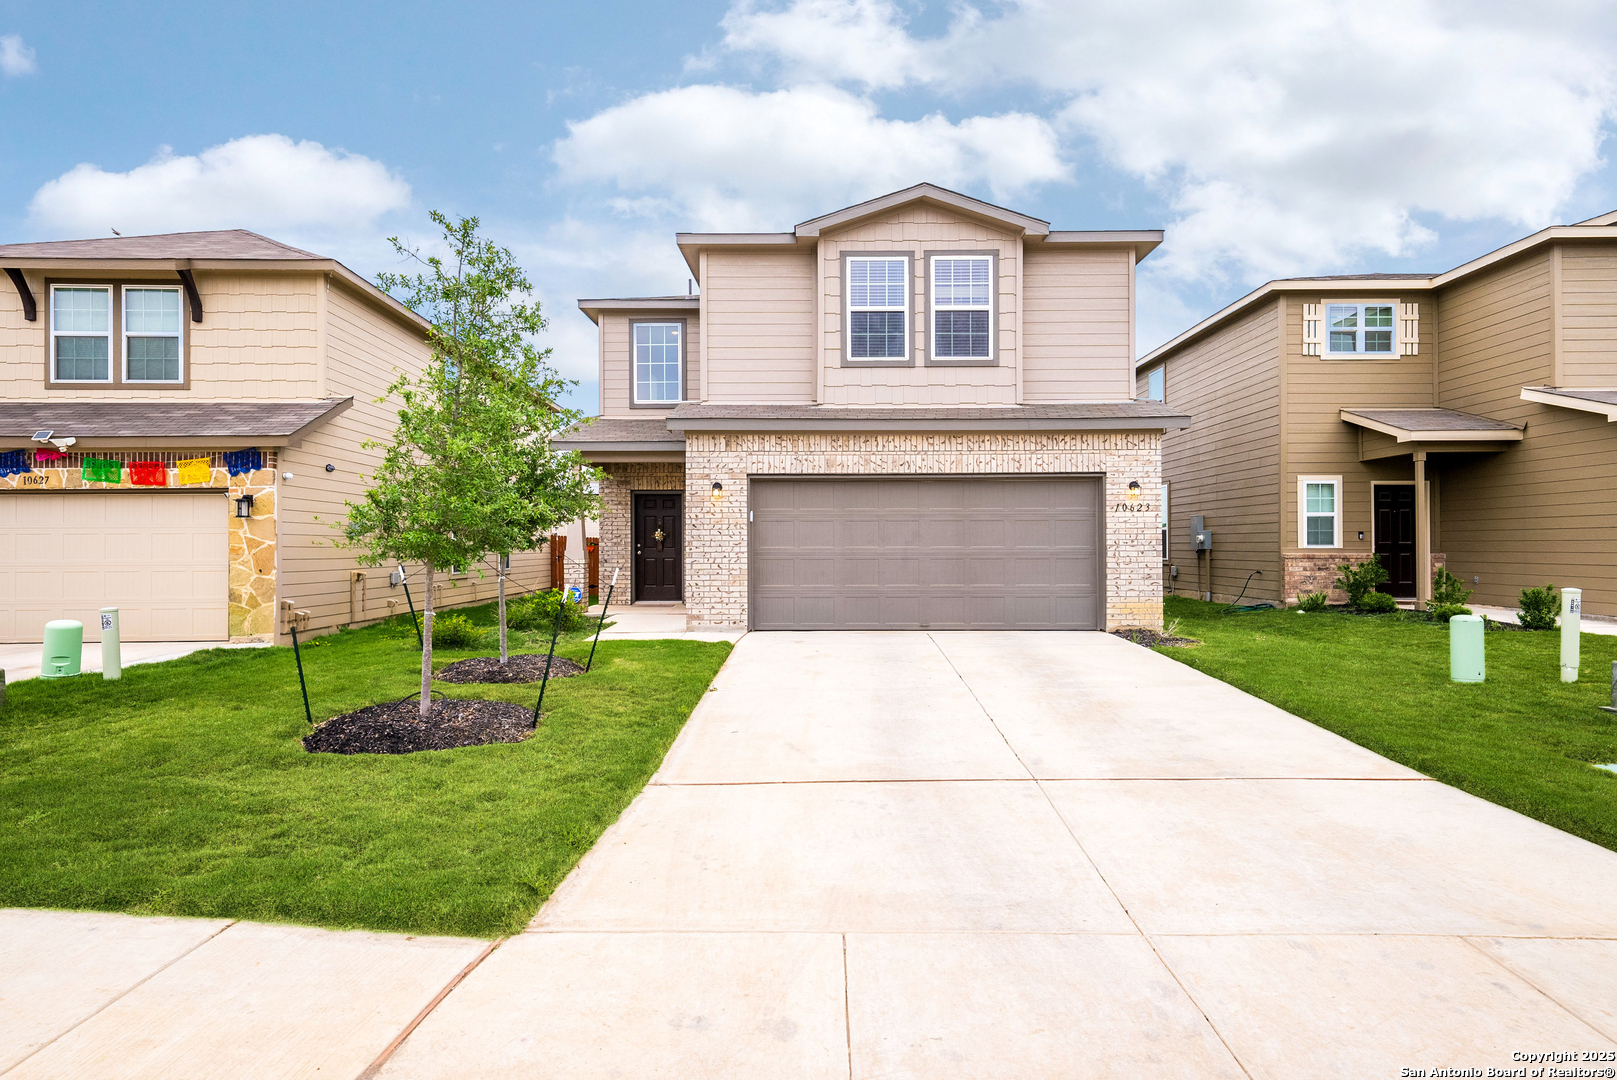
5638 Green Manor St, San Antonio, TX 78223
$-18
Cash flow
-0.6%
Cash-on-Cash Return
6.1%
Cap rate
1.0%
Rent to Value Ratio
Active
$150,000
3
bds
|
1
ba
|
1,475
sqft
|
built
1960
503 E Palfrey St, San Antonio, TX 78223
$-128
Cash flow
-4.5%
Cash-on-Cash Return
5.3%
Cap rate
1.1%
Rent to Value Ratio
5,797 out of 6,080 properties for sale in San Antonio, TX
Limited Results Shown
Create a free account, or log in to reveal all property listings and enjoy the complete experience.
Active
$765,000
4
bds
|
3
ba
|
2,428
sqft
|
built
2016
338 E Olmos Dr, San Antonio, TX 78212
$-3,339
Cash flow
-22.8%
Cash-on-Cash Return
1.0%
Cap rate
0.4%
Rent to Value Ratio
Active
$398,000
4
bds
|
3
ba
|
1,883
sqft
|
built
1999
20318 Settlers Vly, San Antonio, TX 78258
$-1,265
Cash flow
-16.6%
Cash-on-Cash Return
2.5%
Cap rate
0.6%
Rent to Value Ratio
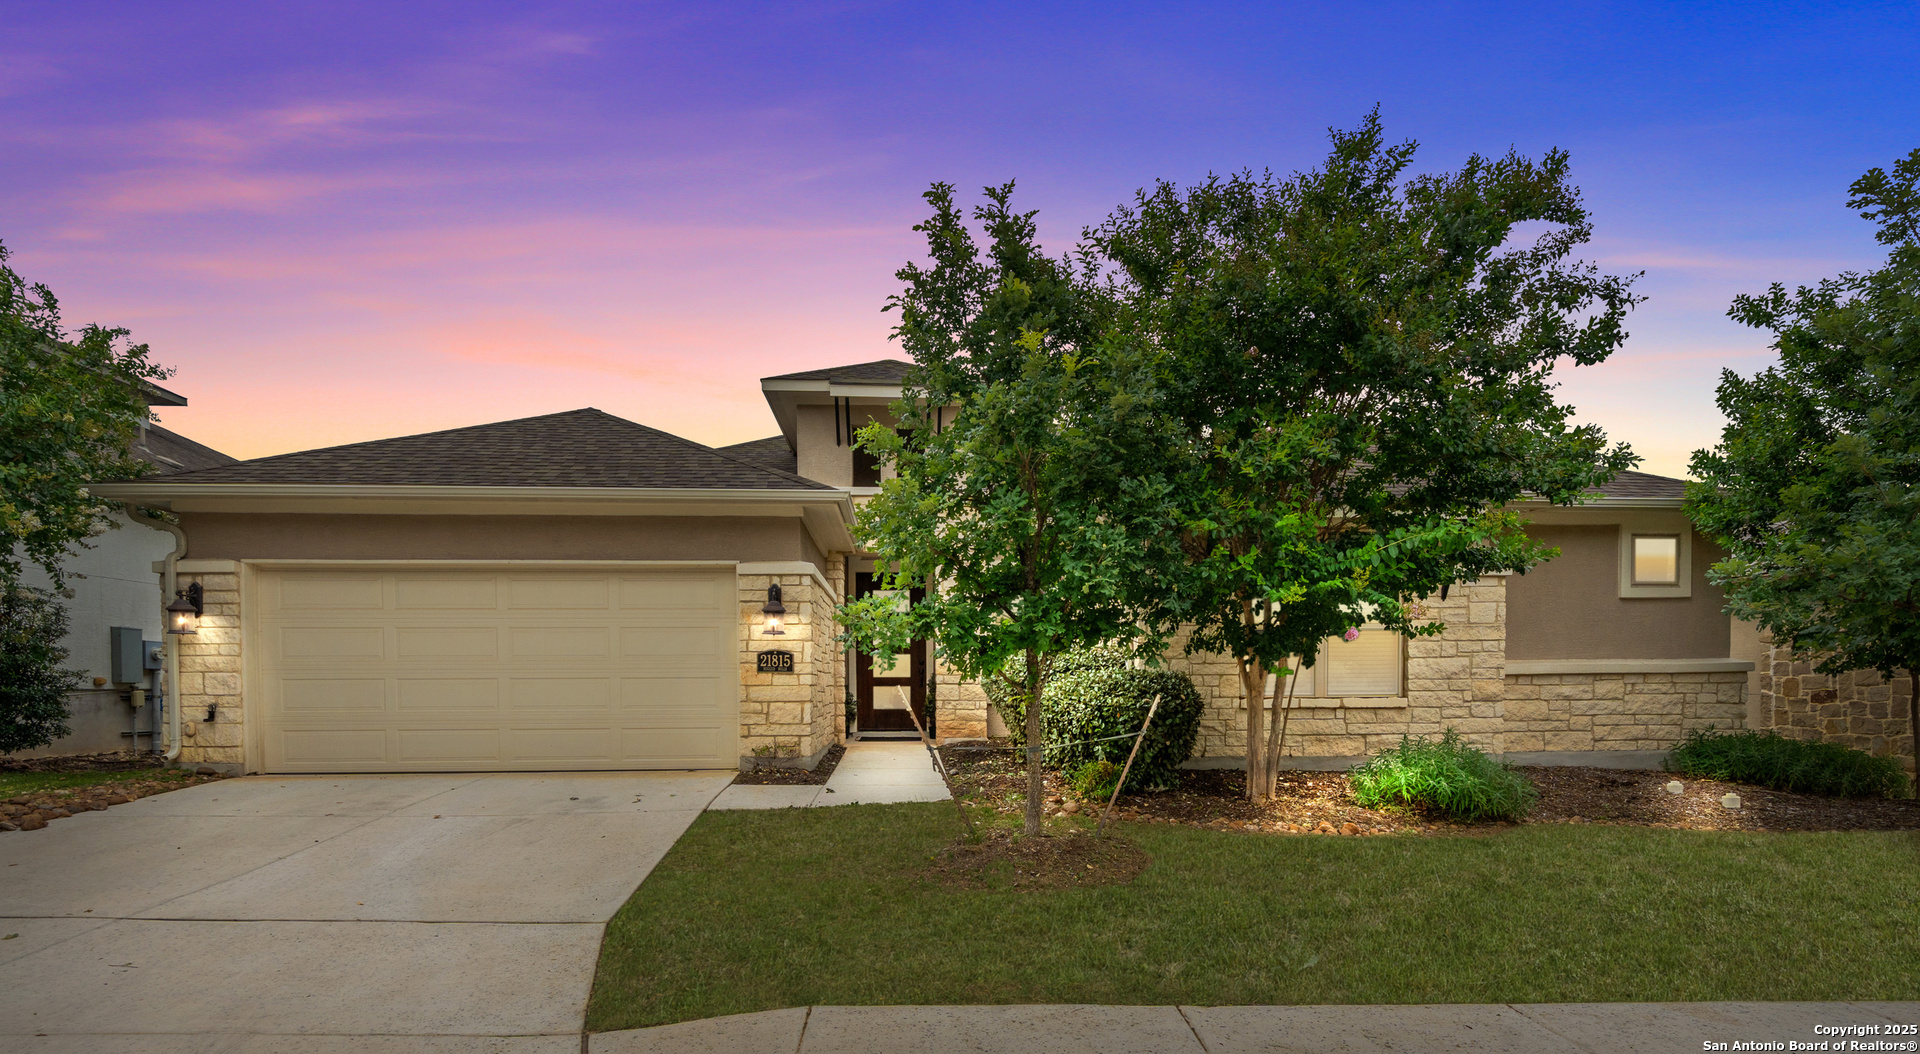
Active
$549,000
3
bds
|
2
ba
|
2,355
sqft
|
built
2018
21815 Rugged Hls, San Antonio, TX 78258
$-942
Cash flow
-9.0%
Cash-on-Cash Return
4.2%
Cap rate
0.8%
Rent to Value Ratio
Active
$239,888
4
bds
|
2
ba
|
1,404
sqft
|
built
1970
4530 El Simpatico St, San Antonio, TX 78233
$-663
Cash flow
-14.4%
Cash-on-Cash Return
3.0%
Cap rate
0.6%
Rent to Value Ratio
Active
$449,000
5
bds
|
3
ba
|
3,256
sqft
|
built
2002
25836 Stone Cyn, San Antonio, TX 78260
$-1,211
Cash flow
-14.1%
Cash-on-Cash Return
3.0%
Cap rate
0.6%
Rent to Value Ratio
Active under contract
$285,000
3
bds
|
2
ba
|
1,723
sqft
|
built
1979
3527 Oakhorne St, San Antonio, TX 78247
$-785
Cash flow
-14.4%
Cash-on-Cash Return
3.0%
Cap rate
0.6%
Rent to Value Ratio
Active
$324,990
5
bds
|
3
ba
|
2,544
sqft
|
built
2016
1731 Emerald Edge, San Antonio, TX 78245
$-622
Cash flow
-10.0%
Cash-on-Cash Return
4.0%
Cap rate
0.7%
Rent to Value Ratio
Active
$265,000
3
bds
|
3
ba
|
1,879
sqft
|
built
1994
9646 Ivy Plain Dr, San Antonio, TX 78245
$-519
Cash flow
-10.2%
Cash-on-Cash Return
3.9%
Cap rate
0.7%
Rent to Value Ratio
Active
$599,000
5
bds
|
4
ba
|
3,660
sqft
|
built
2000
24214 Bear Claw, San Antonio, TX 78258
$-1,665
Cash flow
-14.5%
Cash-on-Cash Return
2.9%
Cap rate
0.6%
Rent to Value Ratio
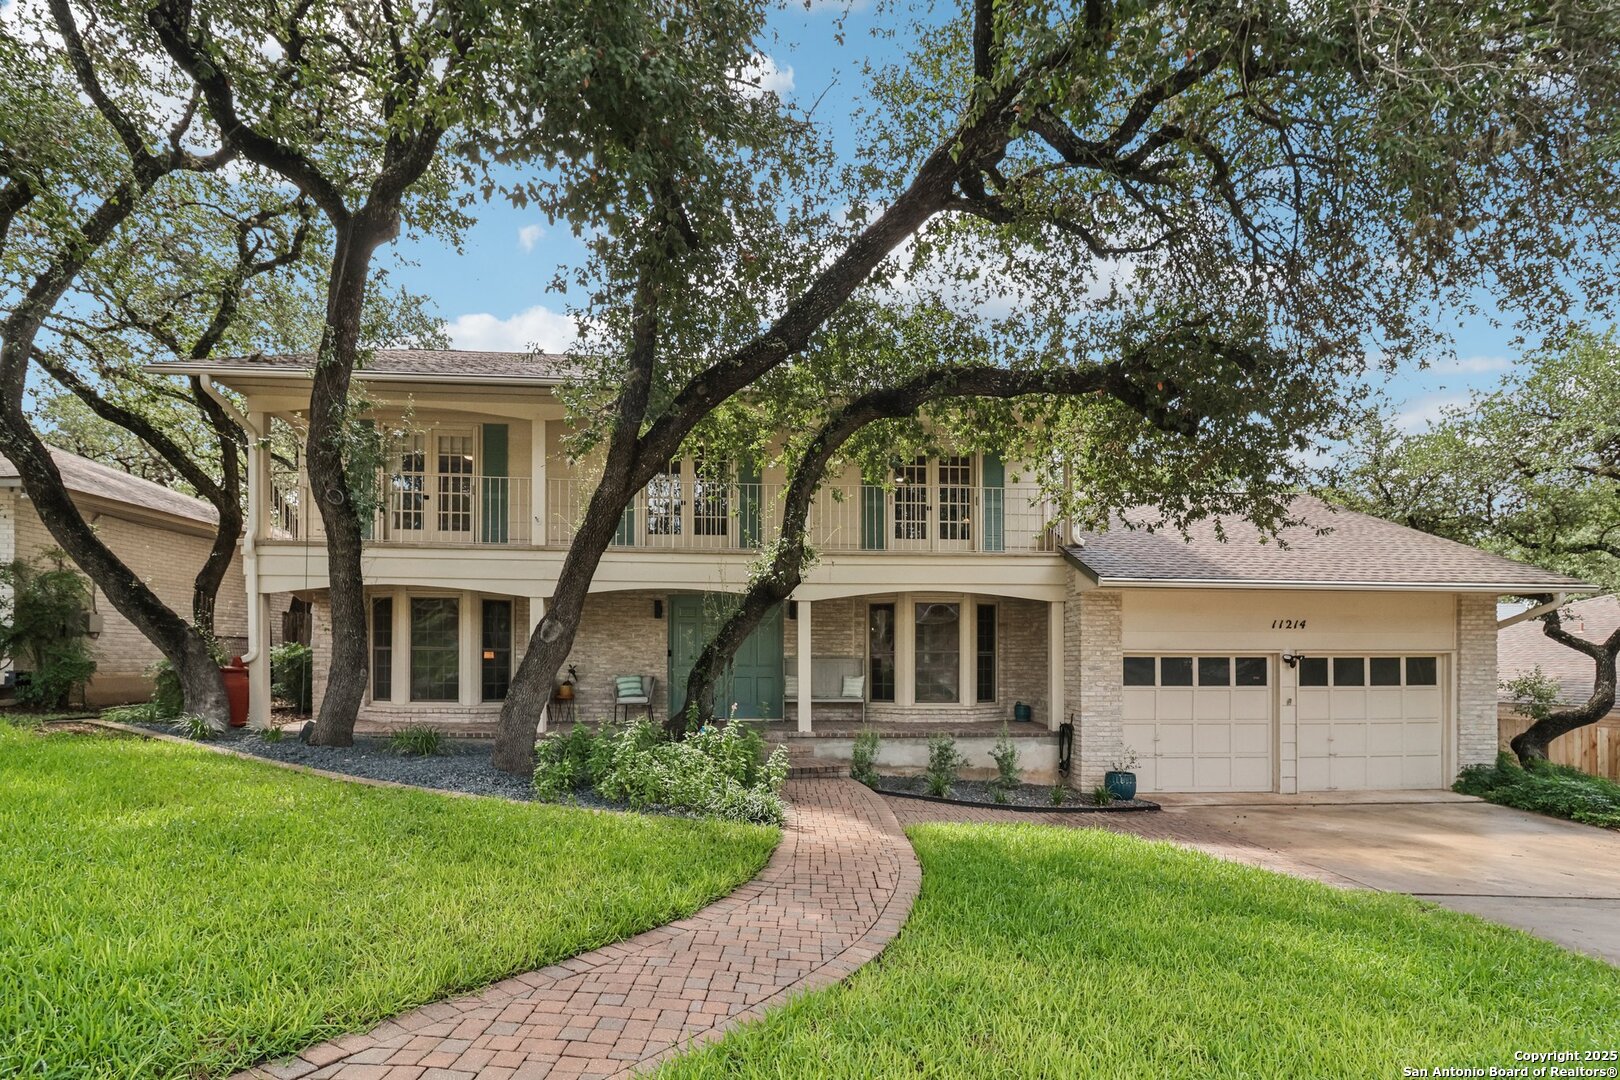
Active
$454,000
4
bds
|
3
ba
|
2,408
sqft
|
built
1977
11214 Whisper Falls St, San Antonio, TX 78230
$-1,427
Cash flow
-16.4%
Cash-on-Cash Return
2.5%
Cap rate
0.6%
Rent to Value Ratio
Active
$289,000
3
bds
|
2
ba
|
1,422
sqft
|
built
1968
5019 Northfield Dr, San Antonio, TX 78228
$-785
Cash flow
-14.2%
Cash-on-Cash Return
3.0%
Cap rate
0.6%
Rent to Value Ratio
Active under contract
$430,000
3
bds
|
5
ba
|
1,964
sqft
|
built
2021
23126 Lexington Park, San Antonio, TX 78259
$-1,452
Cash flow
-17.6%
Cash-on-Cash Return
2.2%
Cap rate
0.5%
Rent to Value Ratio
Active
$549,000
3
bds
|
3
ba
|
2,360
sqft
|
built
1999
2326 Blackoak Bnd, San Antonio, TX 78248
$-1,915
Cash flow
-18.2%
Cash-on-Cash Return
2.1%
Cap rate
0.6%
Rent to Value Ratio
Active
$474,900
4
bds
|
3
ba
|
2,575
sqft
|
built
2022
2604 Sueno Pt, San Antonio, TX 78245
$-1,415
Cash flow
-15.5%
Cash-on-Cash Return
2.7%
Cap rate
0.7%
Rent to Value Ratio
Active under contract
$250,000
3
bds
|
2
ba
|
1,366
sqft
|
built
2002
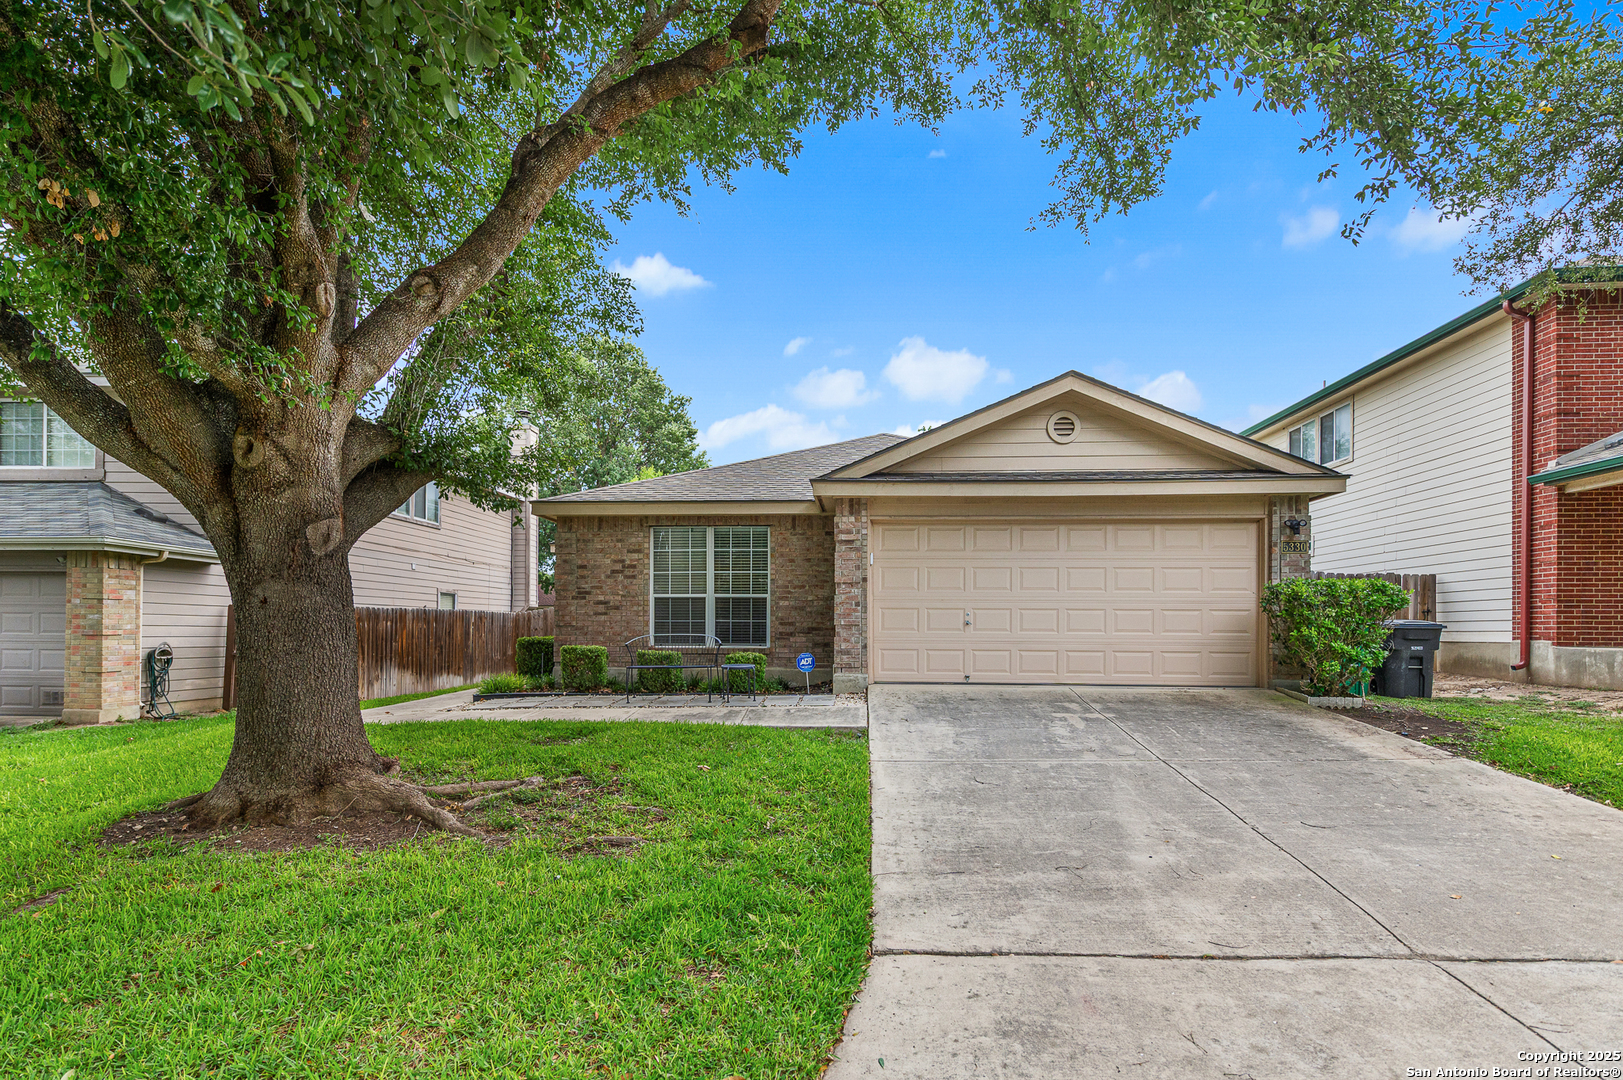
5330 Stormy Hls, San Antonio, TX 78247
$-637
Cash flow
-13.3%
Cash-on-Cash Return
3.2%
Cap rate
0.7%
Rent to Value Ratio
Active
$319,990
3
bds
|
2
ba
|
1,744
sqft
|
built
2019
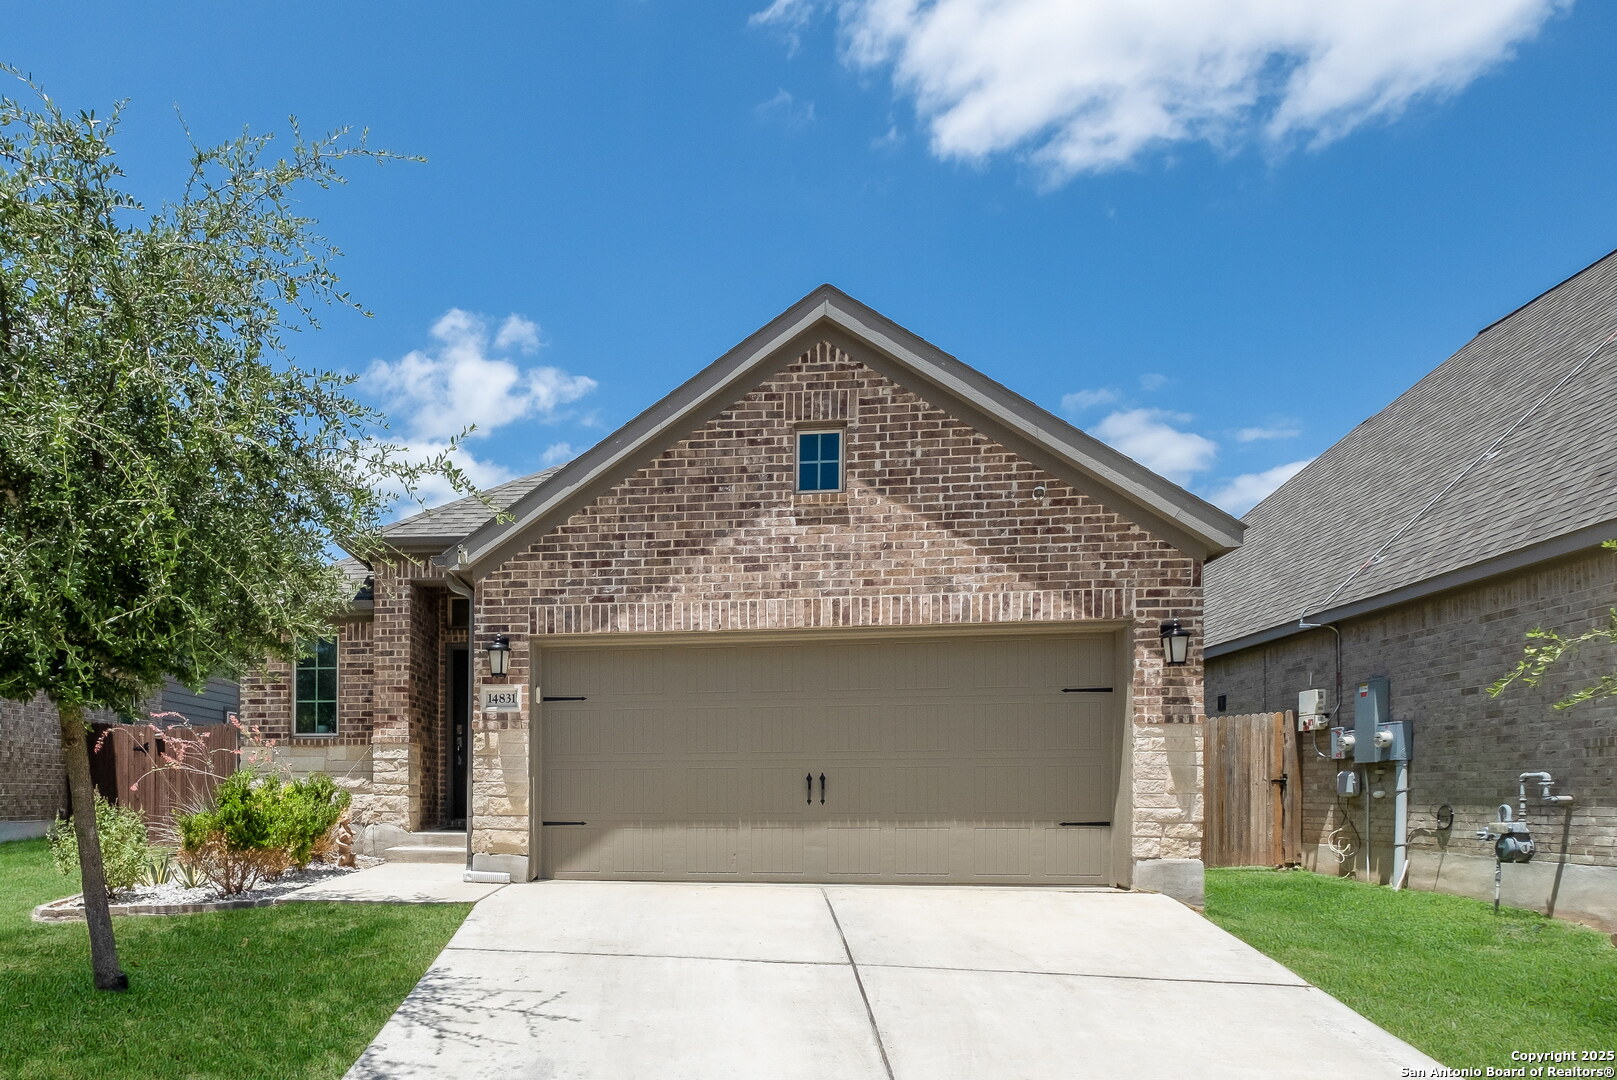
14831 Flint Gln, San Antonio, TX 78254
$-564
Cash flow
-9.2%
Cash-on-Cash Return
4.2%
Cap rate
0.7%
Rent to Value Ratio
Active
$1,695,000
5
bds
|
4
ba
|
4,152
sqft
|
built
2019
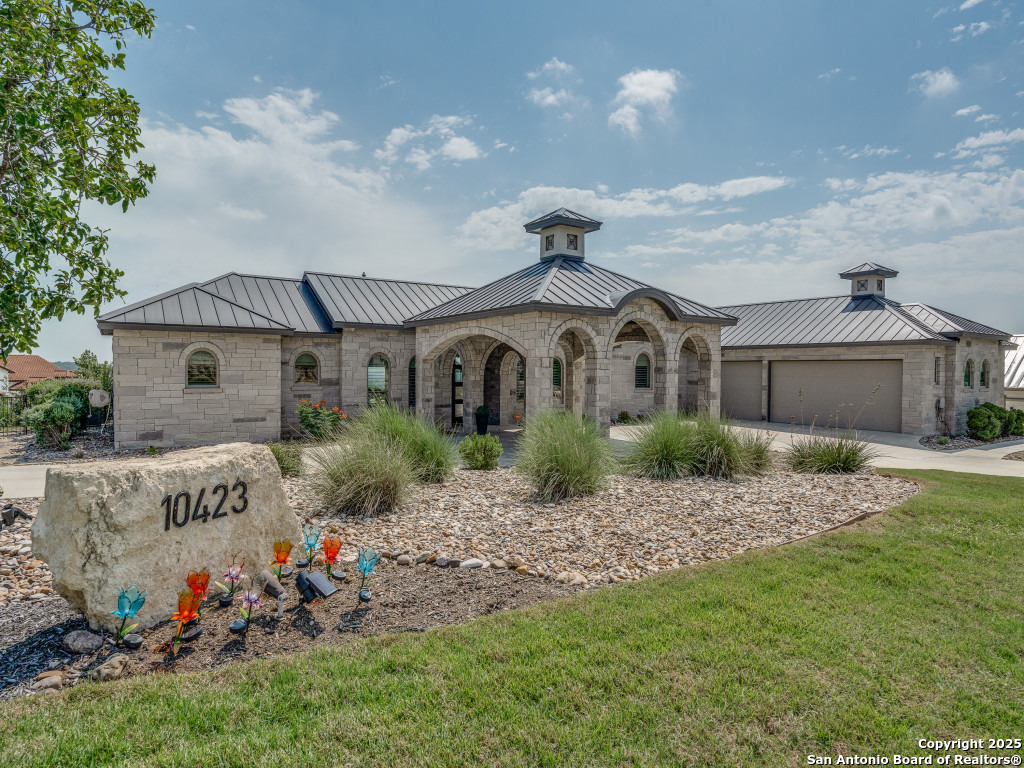
10423 Kendall Cyn, San Antonio, TX 78255
$-7,405
Cash flow
-22.8%
Cash-on-Cash Return
1.0%
Cap rate
0.3%
Rent to Value Ratio
Active
$195,000
2
bds
|
2
ba
|
1,126
sqft
|
built
1985
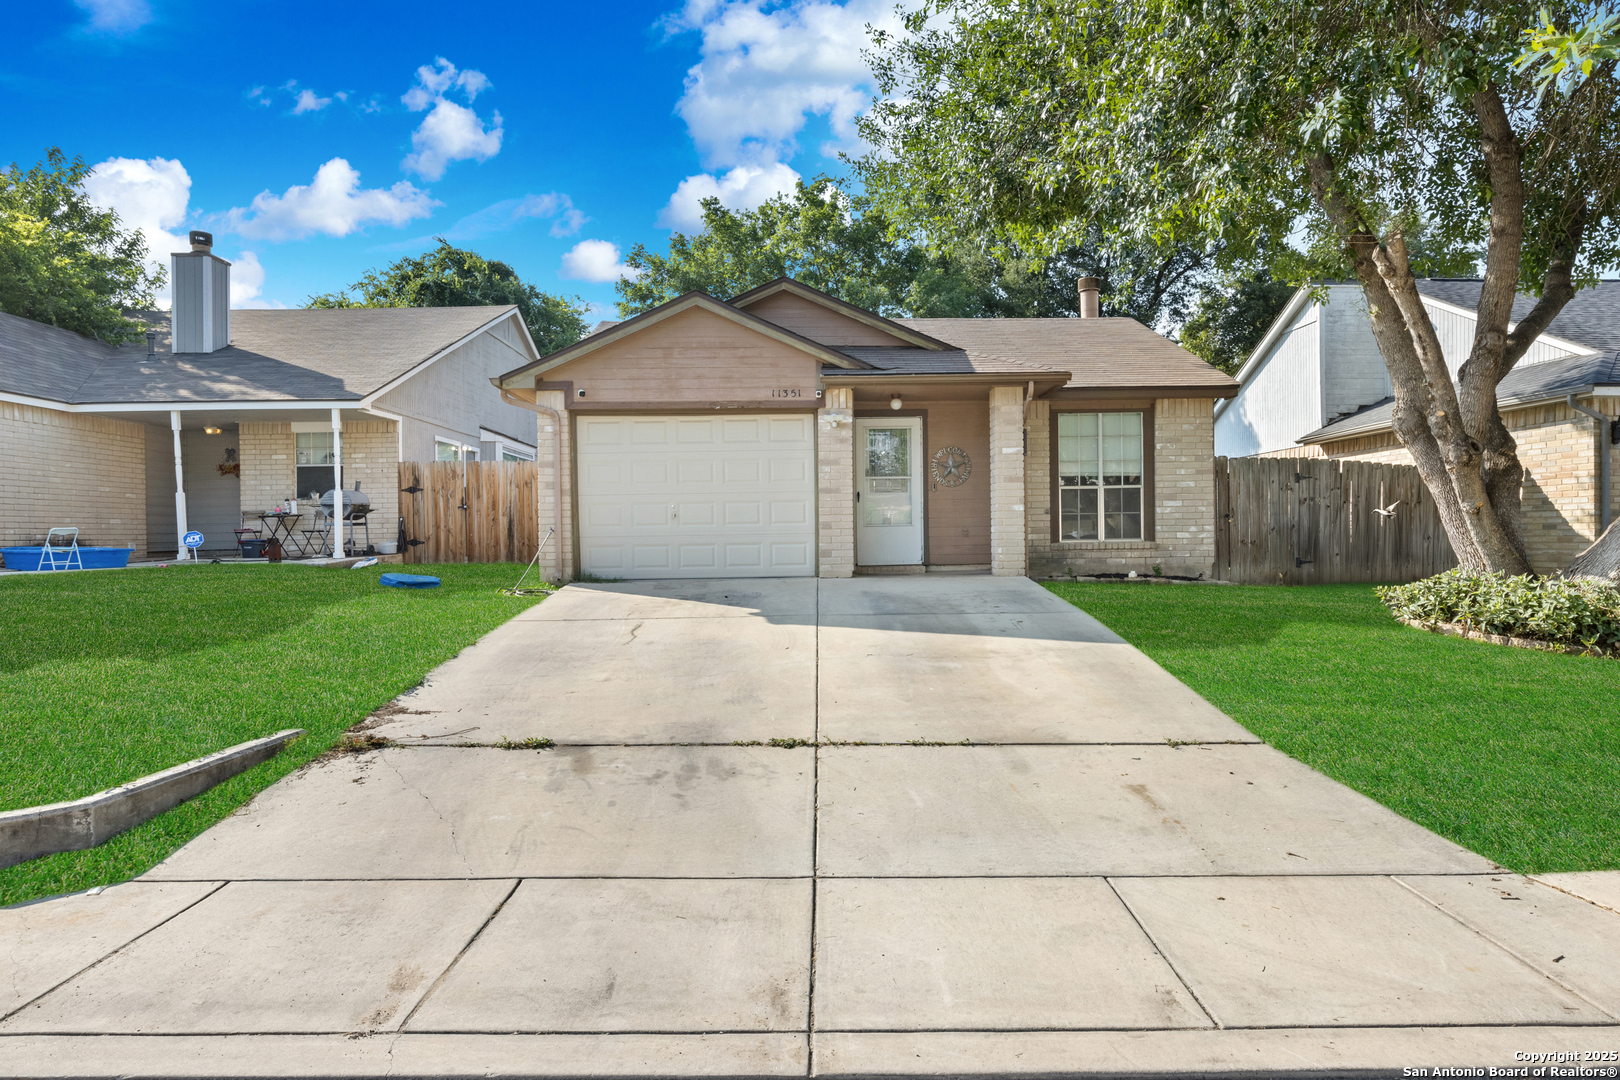
11351 Olney Spgs, San Antonio, TX 78245
$-391
Cash flow
-10.5%
Cash-on-Cash Return
3.9%
Cap rate
0.7%
Rent to Value Ratio
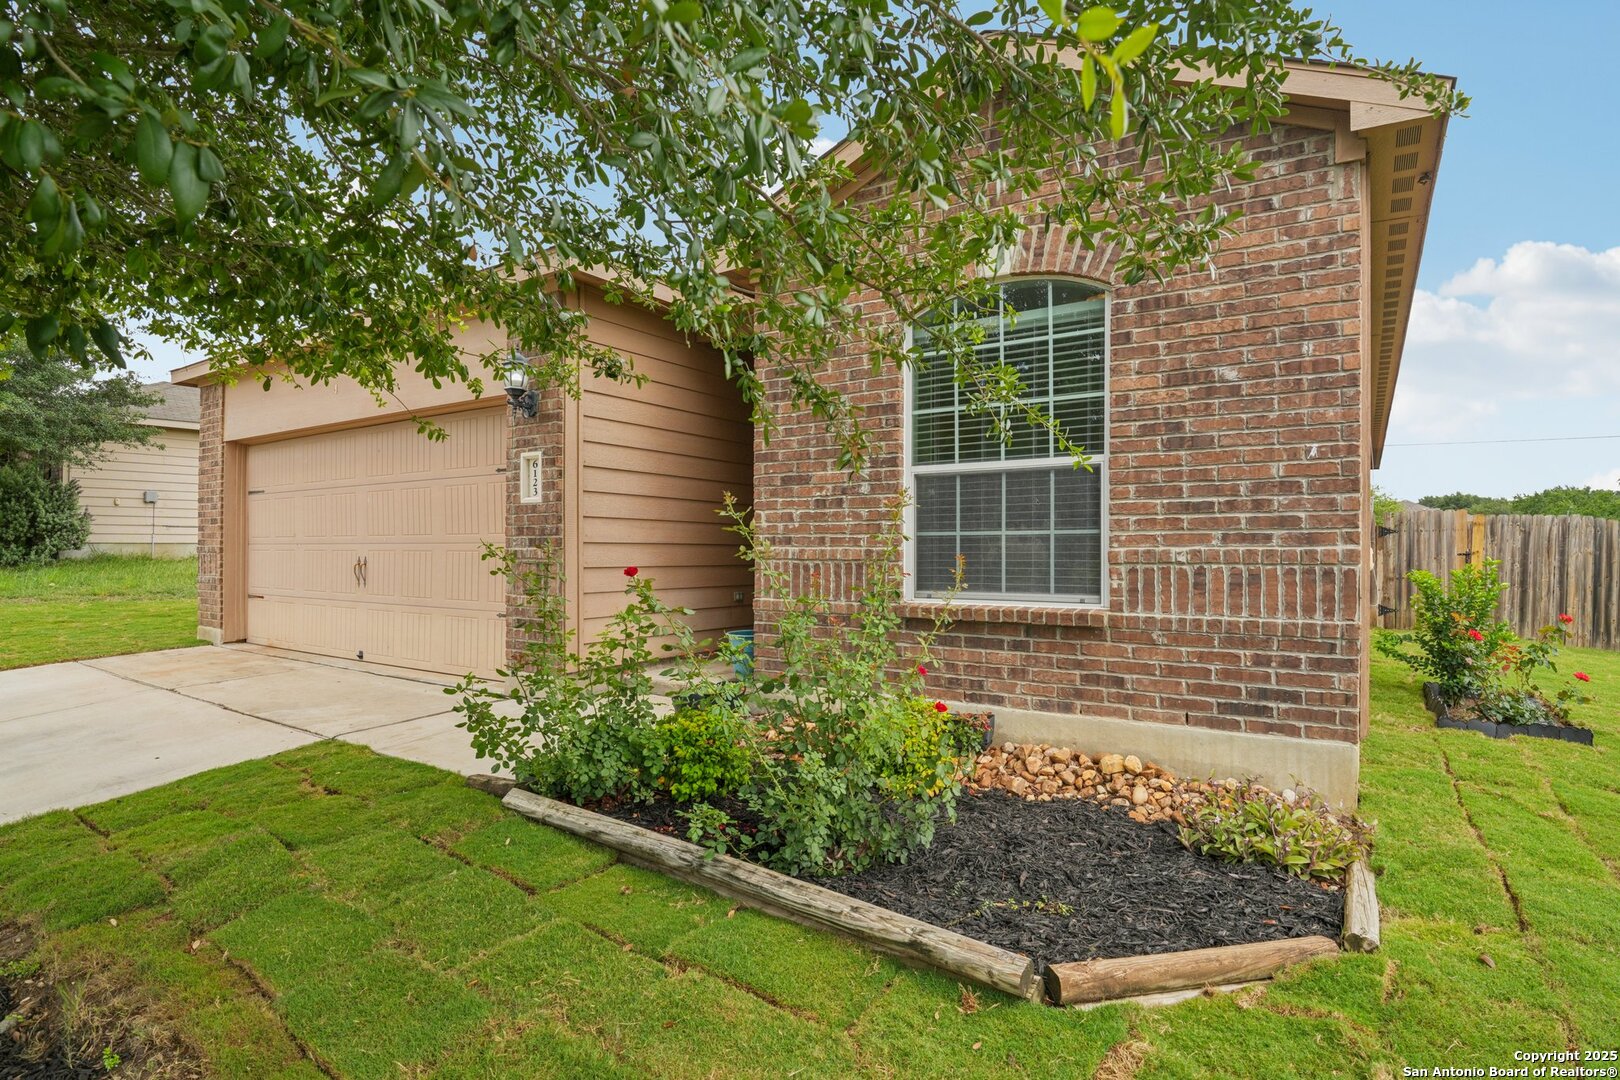
Active
$220,000
3
bds
|
2
ba
|
1,556
sqft
|
built
2013
6123 Foster Mill Dr, San Antonio, TX 78222
$-441
Cash flow
-10.5%
Cash-on-Cash Return
3.9%
Cap rate
0.8%
Rent to Value Ratio
Active
$259,000
3
bds
|
2
ba
|
1,312
sqft
|
built
1963
2738 Ravina St, San Antonio, TX 78222
$-627
Cash flow
-12.6%
Cash-on-Cash Return
3.4%
Cap rate
0.6%
Rent to Value Ratio
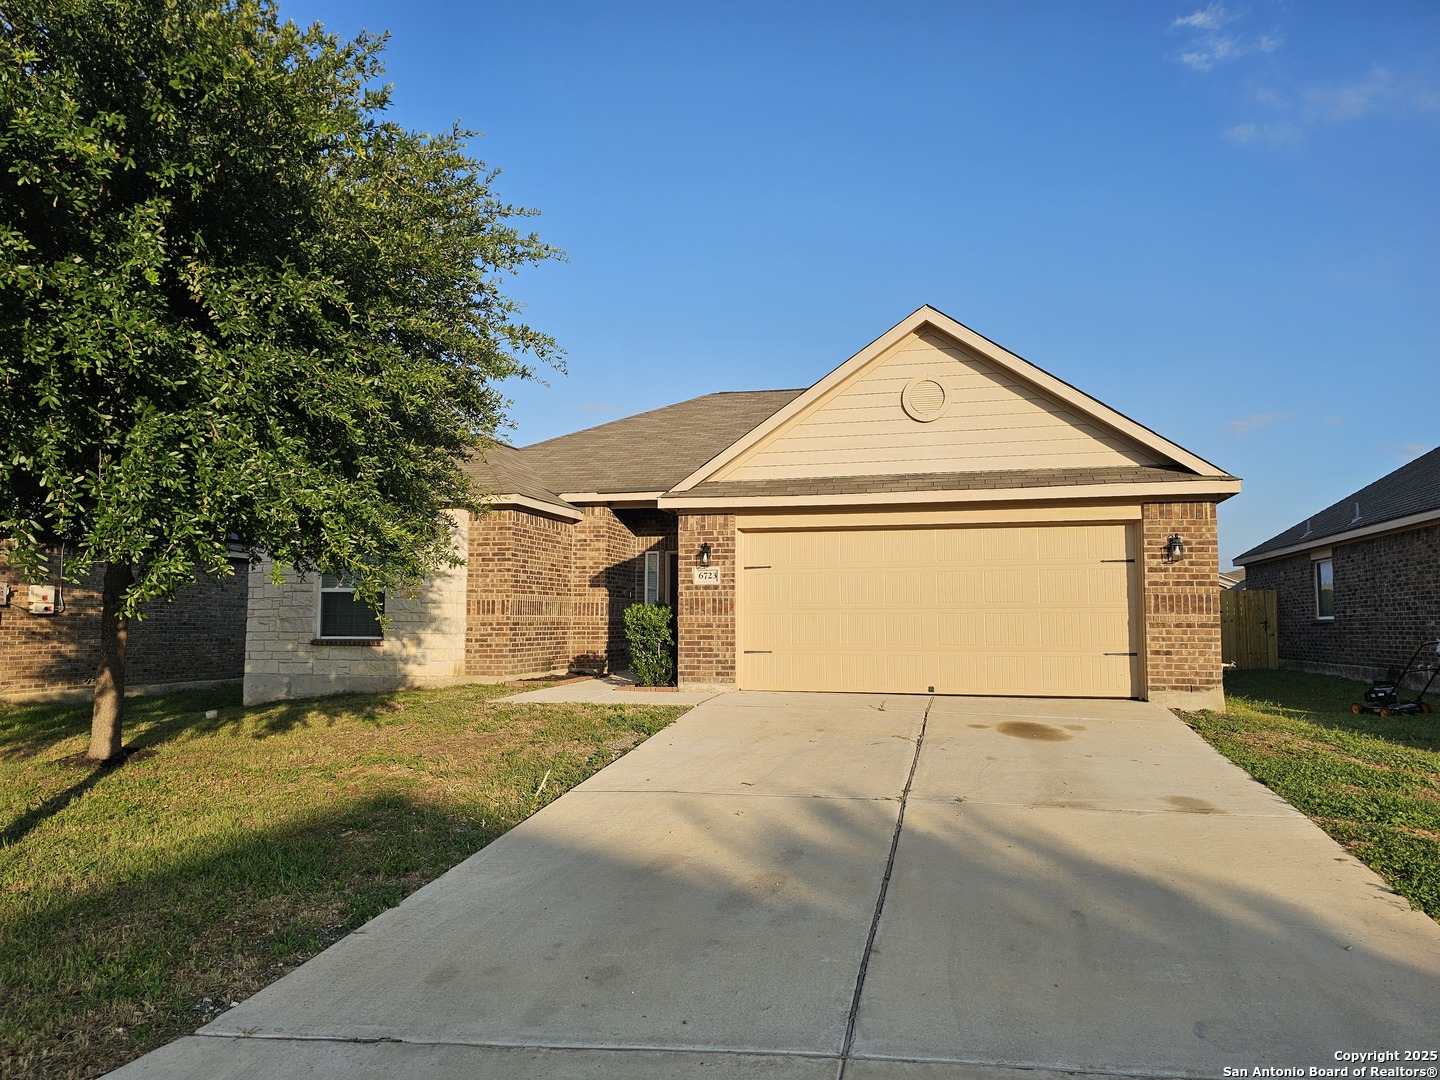
Active
$289,998
4
bds
|
2
ba
|
1,946
sqft
|
built
2015
6723 Luckey Pond, San Antonio, TX 78252
$-845
Cash flow
-15.2%
Cash-on-Cash Return
2.8%
Cap rate
0.6%
Rent to Value Ratio
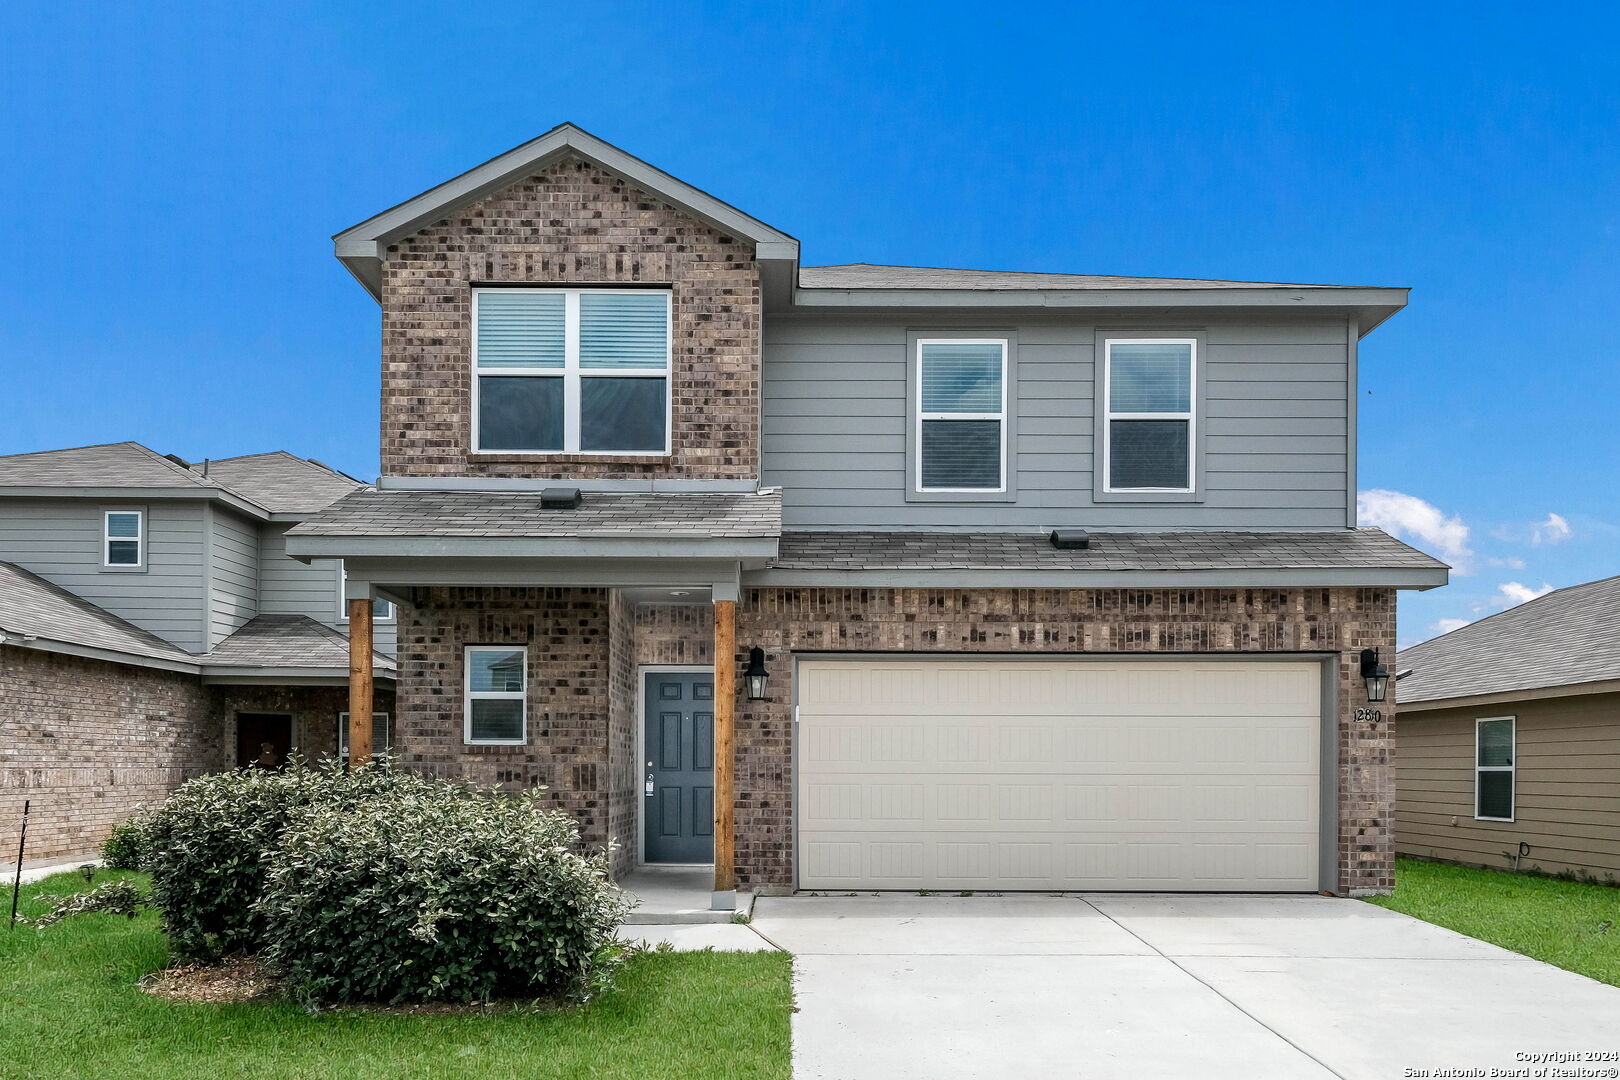
Active
$269,750
4
bds
|
3
ba
|
2,070
sqft
|
built
2020
12810 Olson Pt, San Antonio, TX 78252
$-568
Cash flow
-11.0%
Cash-on-Cash Return
3.8%
Cap rate
0.7%
Rent to Value Ratio
Active
$299,500
3
bds
|
3
ba
|
1,816
sqft
|
built
2022
10623 Rayburn Lndg, San Antonio, TX 78252
$-783
Cash flow
-13.6%
Cash-on-Cash Return
3.1%
Cap rate
0.6%
Rent to Value Ratio
Active
$319,000
3
bds
|
2
ba
|
1,570
sqft
|
built
1966
3207 Oneida Dr, San Antonio, TX 78230
$-854
Cash flow
-14.0%
Cash-on-Cash Return
3.1%
Cap rate
0.6%
Rent to Value Ratio
Active
$455,000
4
bds
|
3
ba
|
2,574
sqft
|
built
2005
223 Verde Blf, San Antonio, TX 78258
$-1,460
Cash flow
-16.7%
Cash-on-Cash Return
2.4%
Cap rate
0.6%
Rent to Value Ratio
Active
$449,990
4
bds
|
4
ba
|
3,040
sqft
|
built
2003
20927 Las Lomas Blvd, San Antonio, TX 78258
$-1,340
Cash flow
-15.5%
Cash-on-Cash Return
2.7%
Cap rate
0.6%
Rent to Value Ratio
Active
$824,900
4
bds
|
4
ba
|
3,077
sqft
|
built
2004
26815 Duet Dr, San Antonio, TX 78260
$-3,220
Cash flow
-20.4%
Cash-on-Cash Return
1.6%
Cap rate
0.4%
Rent to Value Ratio
Active
$350,000
3
bds
|
2
ba
|
1,440
sqft
|
built
1985
4127 Pleasanton Rd, San Antonio, TX 78221
$-1,125
Cash flow
-16.8%
Cash-on-Cash Return
2.4%
Cap rate
0.5%
Rent to Value Ratio
Active
$580,000
3
bds
|
4
ba
|
2,379
sqft
|
built
2019
26713 Snuggle Vly, San Antonio, TX 78260
$-2,512
Cash flow
-22.6%
Cash-on-Cash Return
1.1%
Cap rate
0.5%
Rent to Value Ratio
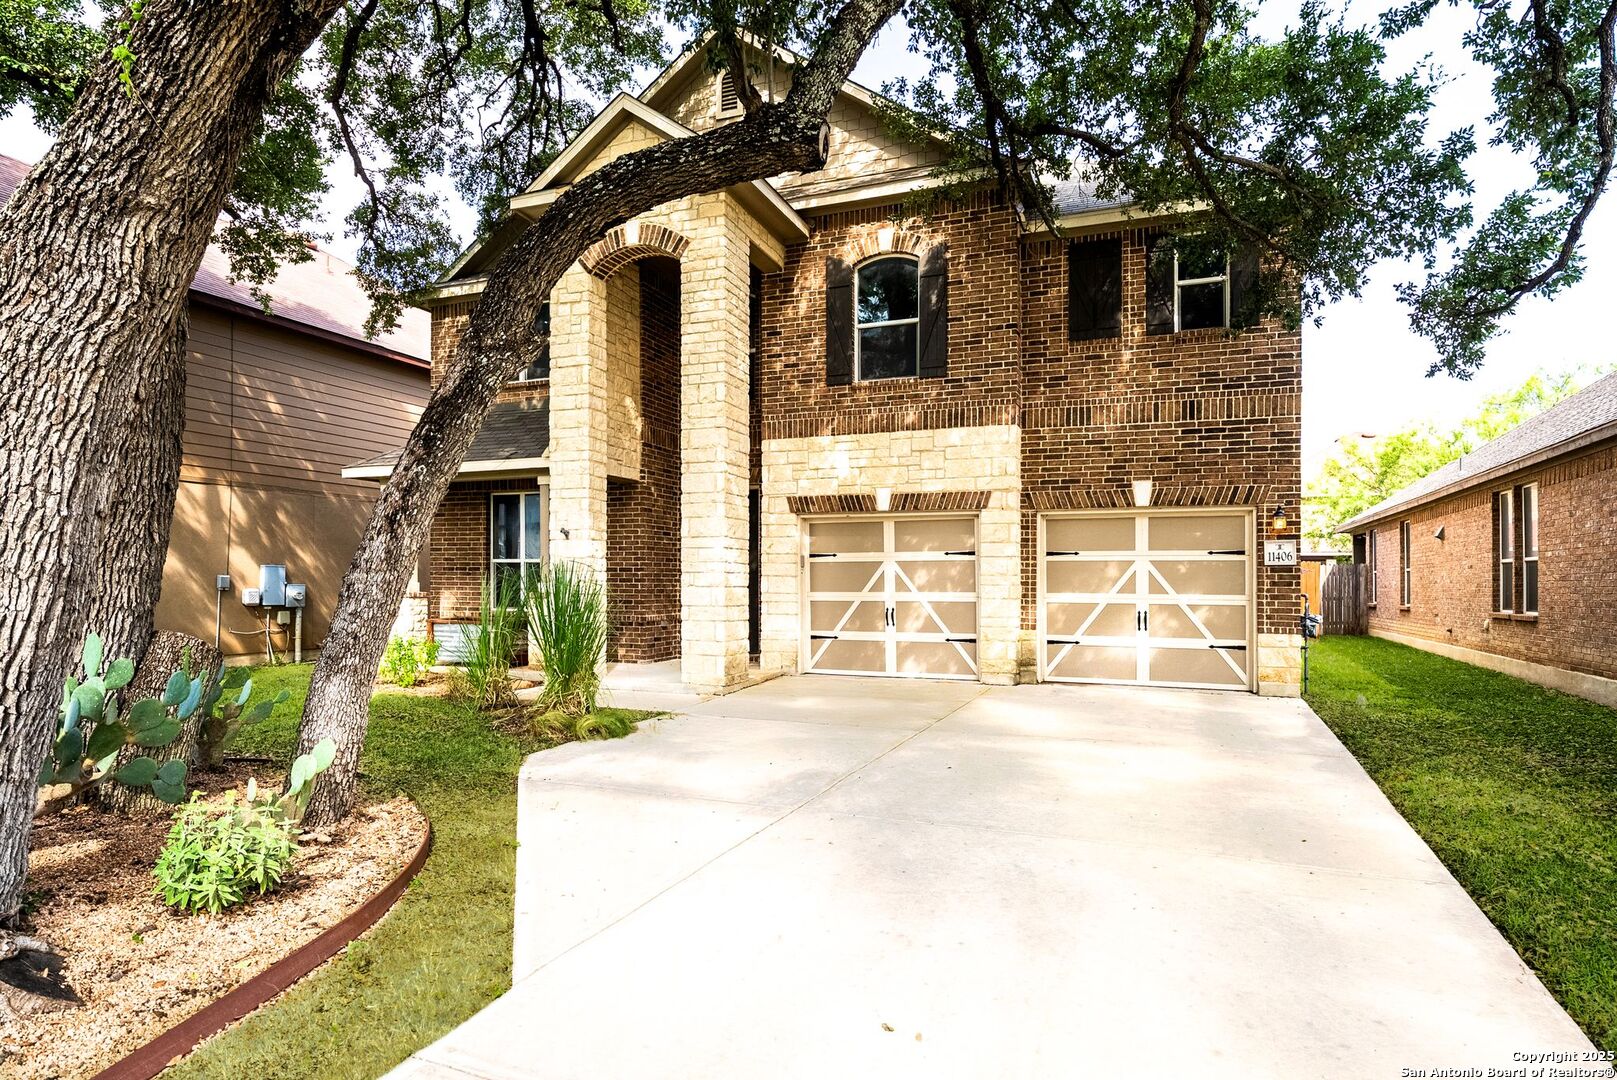
Active
$360,000
4
bds
|
3
ba
|
2,717
sqft
|
built
2017
11406 Sawyer Vly, San Antonio, TX 78254
$-736
Cash flow
-10.7%
Cash-on-Cash Return
3.8%
Cap rate
0.7%
Rent to Value Ratio
Active
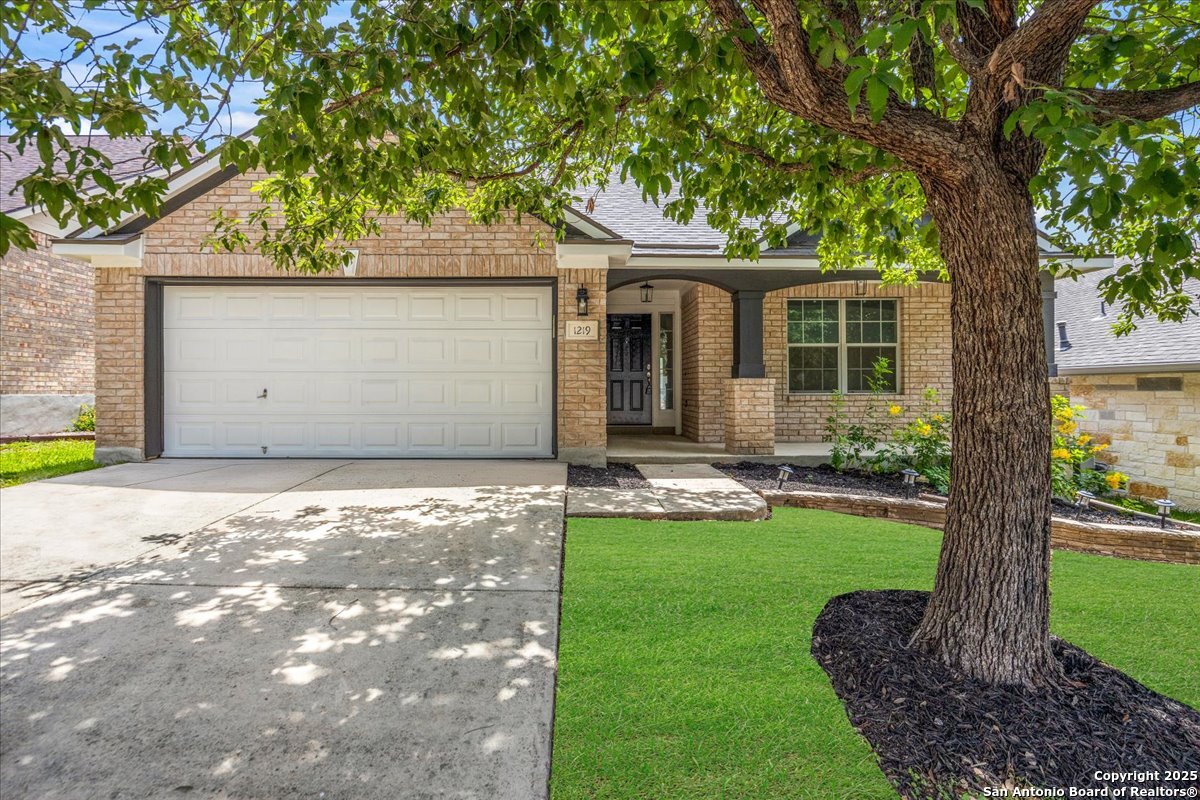
$349,900
3
bds
|
2
ba
|
1,829
sqft
|
built
2006
1219 Alpine Pond, San Antonio, TX 78260
$-917
Cash flow
-13.7%
Cash-on-Cash Return
3.1%
Cap rate
0.6%
Rent to Value Ratio
Active
$249,000
4
bds
|
2
ba
|
1,307
sqft
|
built
1964
5823 Prentiss Dr, San Antonio, TX 78240
$-539
Cash flow
-11.3%
Cash-on-Cash Return
3.7%
Cap rate
0.7%
Rent to Value Ratio
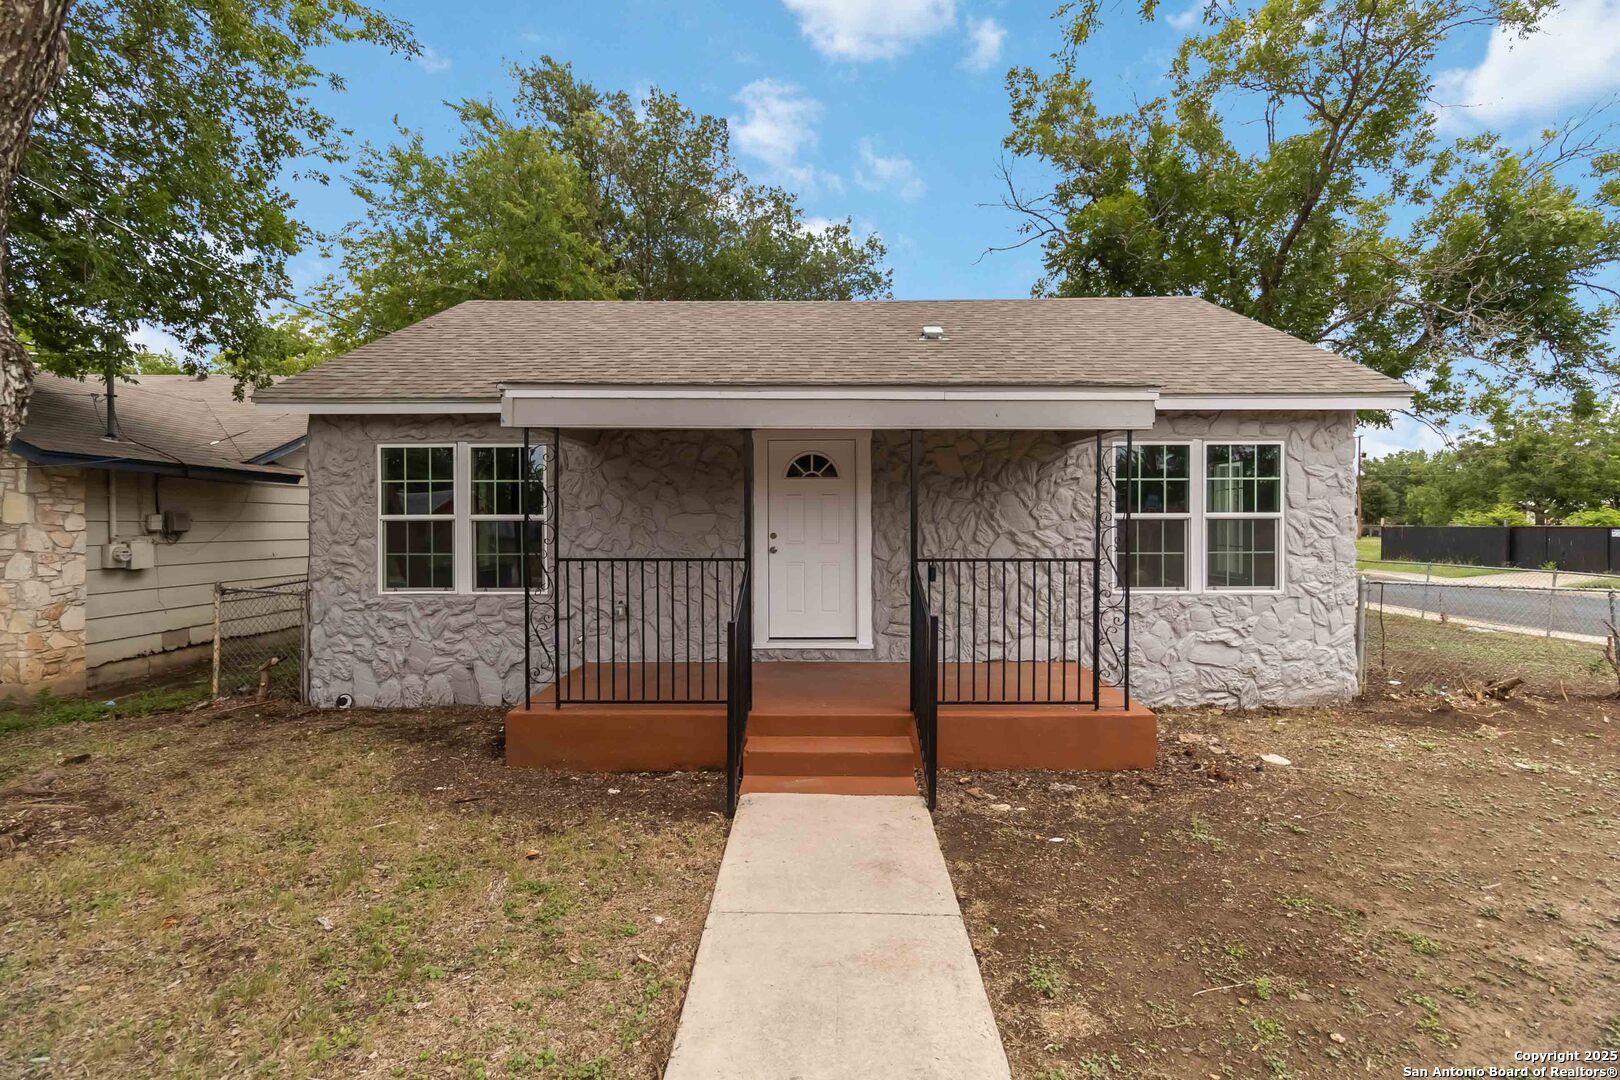
Active
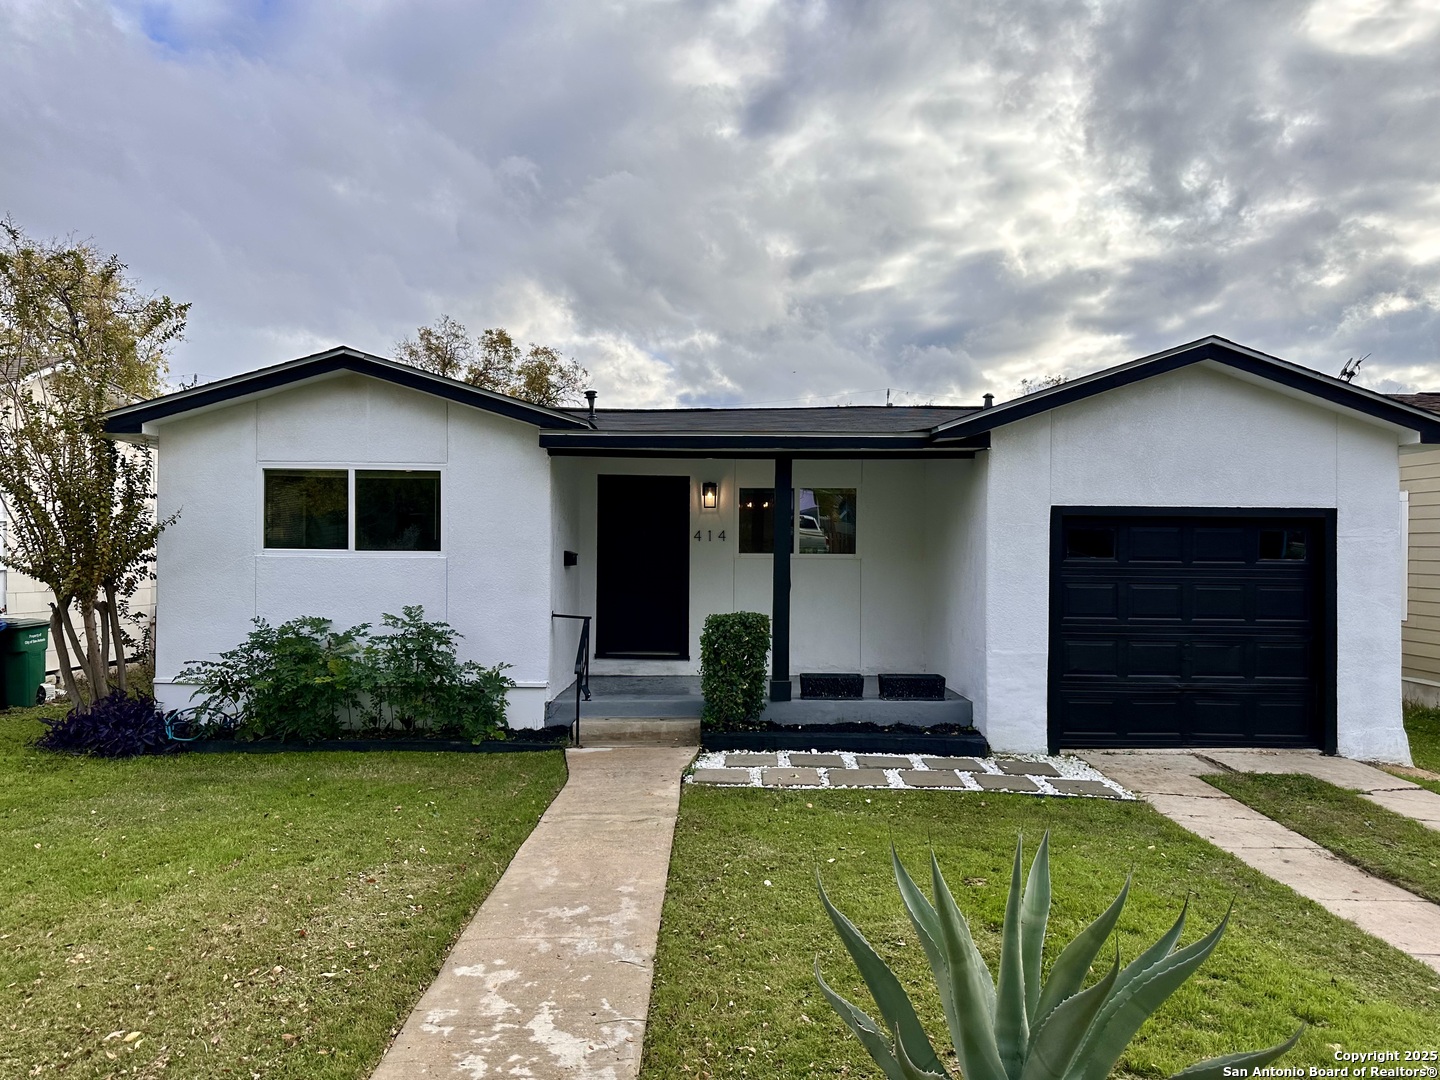
$299,999
3
bds
|
2
ba
|
1,436
sqft
|
built
1949
414 Clower, San Antonio, TX 78212
$-516
Cash flow
-9.0%
Cash-on-Cash Return
4.2%
Cap rate
0.7%
Rent to Value Ratio
Active
$150,000
3
bds
|
1
ba
|
1,475
sqft
|
built
1960
503 E Palfrey St, San Antonio, TX 78223
$-128
Cash flow
-4.5%
Cash-on-Cash Return
5.3%
Cap rate
1.1%
Rent to Value Ratio
Active
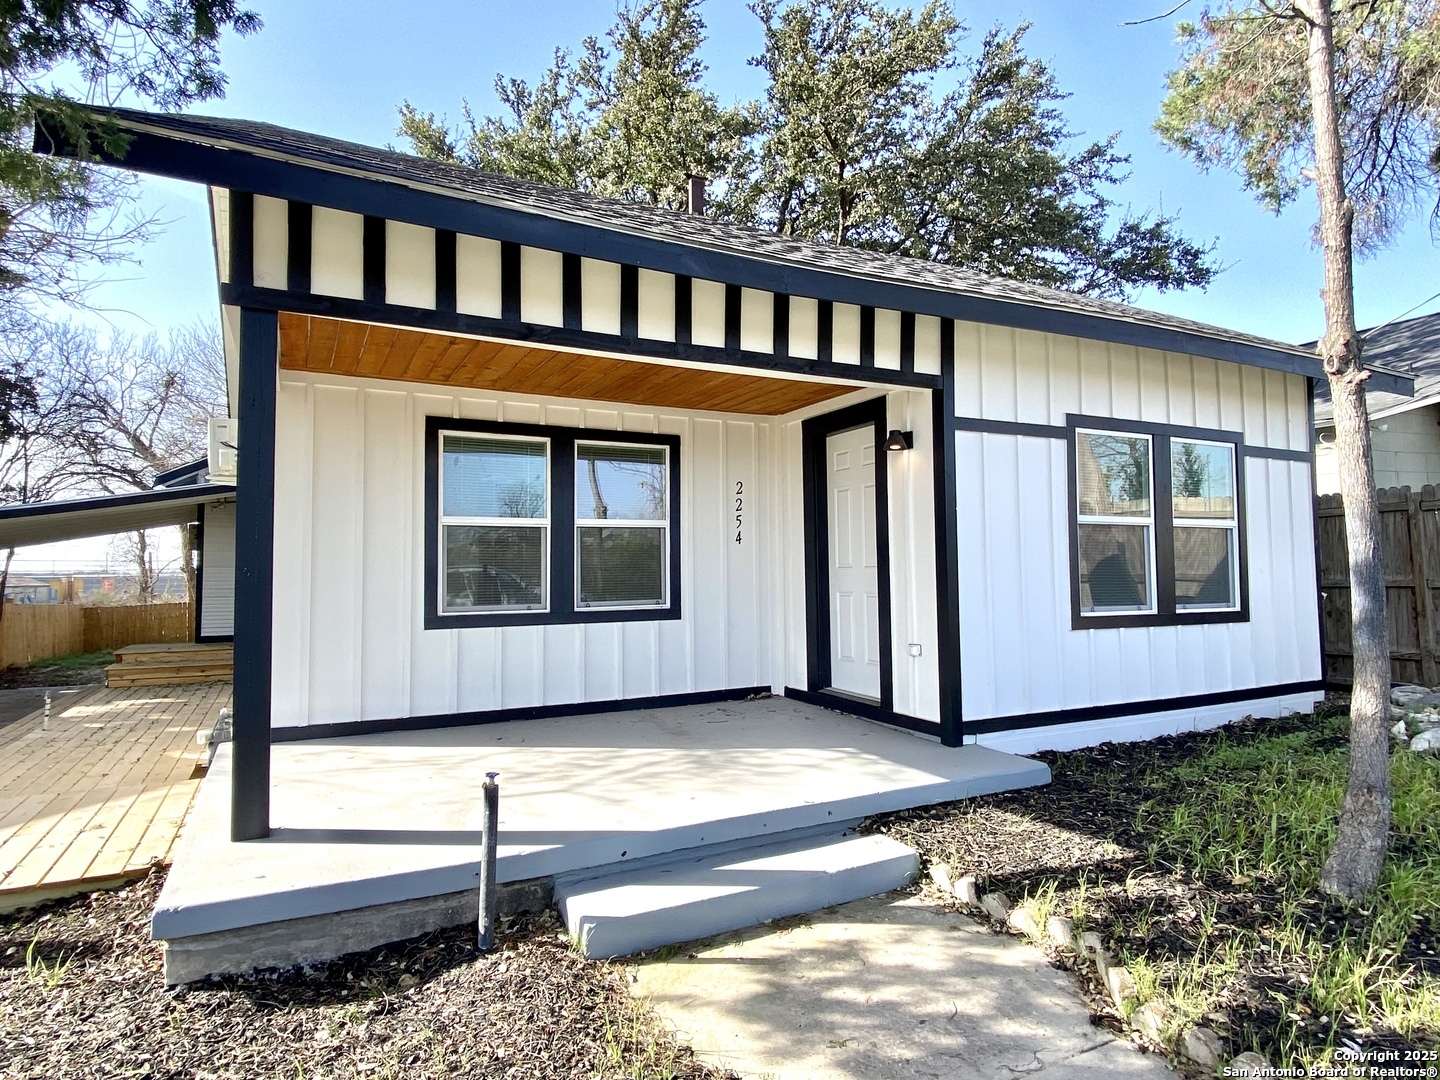
$225,000
3
bds
|
2
ba
|
1,167
sqft
|
built
1959
2254 N Interstate 35, San Antonio, TX 78208
$-239
Cash flow
-5.5%
Cash-on-Cash Return
5.0%
Cap rate
0.8%
Rent to Value Ratio
Active
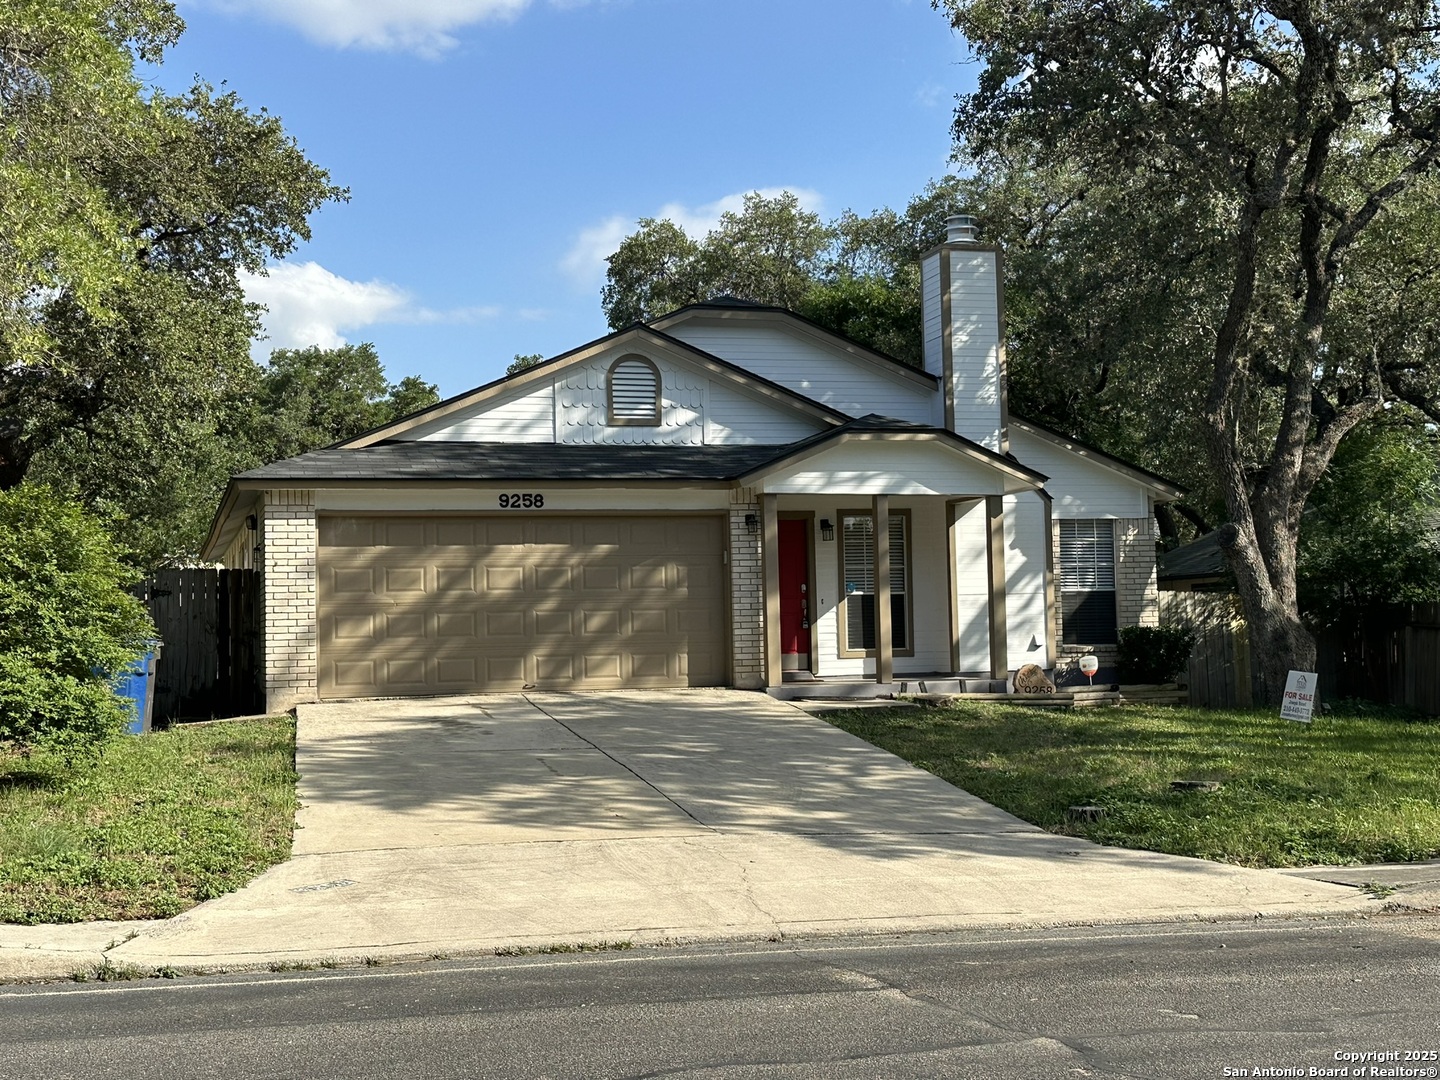
$249,995
3
bds
|
2
ba
|
1,346
sqft
|
built
1985
9258 Ridge Cross, San Antonio, TX 78250
$-683
Cash flow
-14.3%
Cash-on-Cash Return
3.0%
Cap rate
0.6%
Rent to Value Ratio
Active
$157,000
3
bds
|
2
ba
|
1,124
sqft
|
built
1975
5638 Green Manor St, San Antonio, TX 78223
$-18
Cash flow
-0.6%
Cash-on-Cash Return
6.1%
Cap rate
1.0%
Rent to Value Ratio
Active
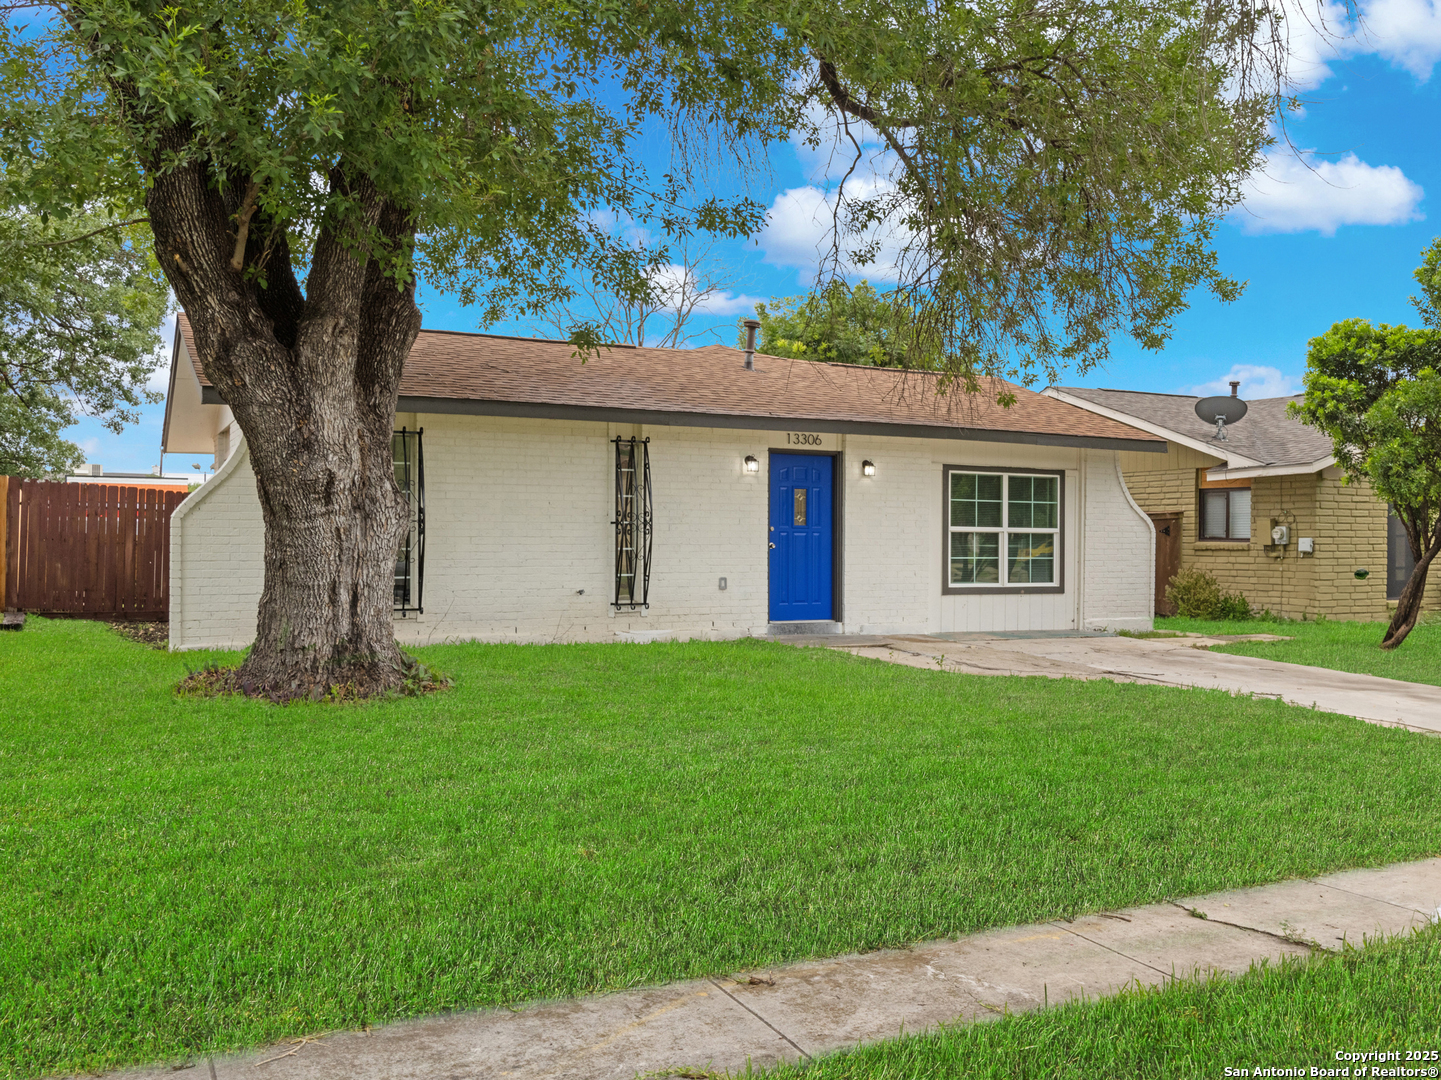
$195,000
4
bds
|
2
ba
|
1,255
sqft
|
built
1971
13306 Chesterton Dr, San Antonio, TX 78217
$-239
Cash flow
-6.4%
Cash-on-Cash Return
4.8%
Cap rate
0.8%
Rent to Value Ratio
Active
$245,000
4
bds
|
2
ba
|
1,639
sqft
|
built
1987
2915 Village Pkwy, San Antonio, TX 78251
$-596
Cash flow
-12.7%
Cash-on-Cash Return
3.4%
Cap rate
0.7%
Rent to Value Ratio
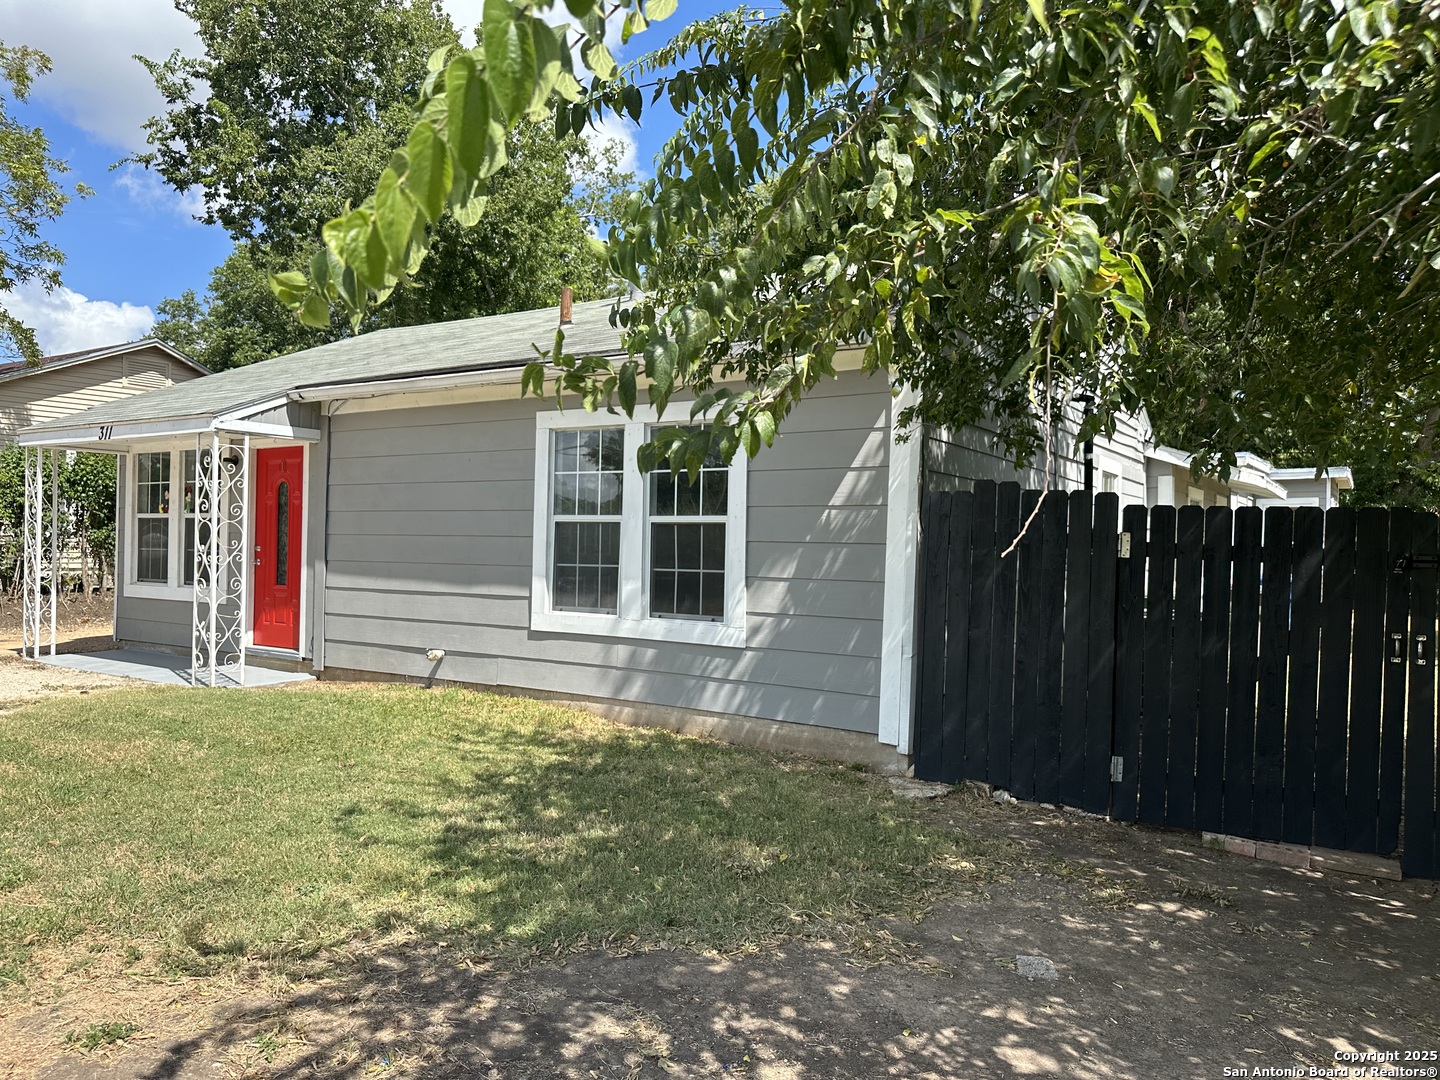
Active
$328,000
6
bds
|
0
ba
|
2,182
sqft
|
built
1948
311 Glamis Ave, San Antonio, TX 78223
$-1,149
Cash flow
-18.3%
Cash-on-Cash Return
2.1%
Cap rate
0.4%
Rent to Value Ratio