San Antonio, TX Investment Properties for Sale
Browse homes for sale and investment properties in San Antonio, TX. Refine your search by price, property type, or more.
Best cash flowing properties in San Antonio, TX
Active
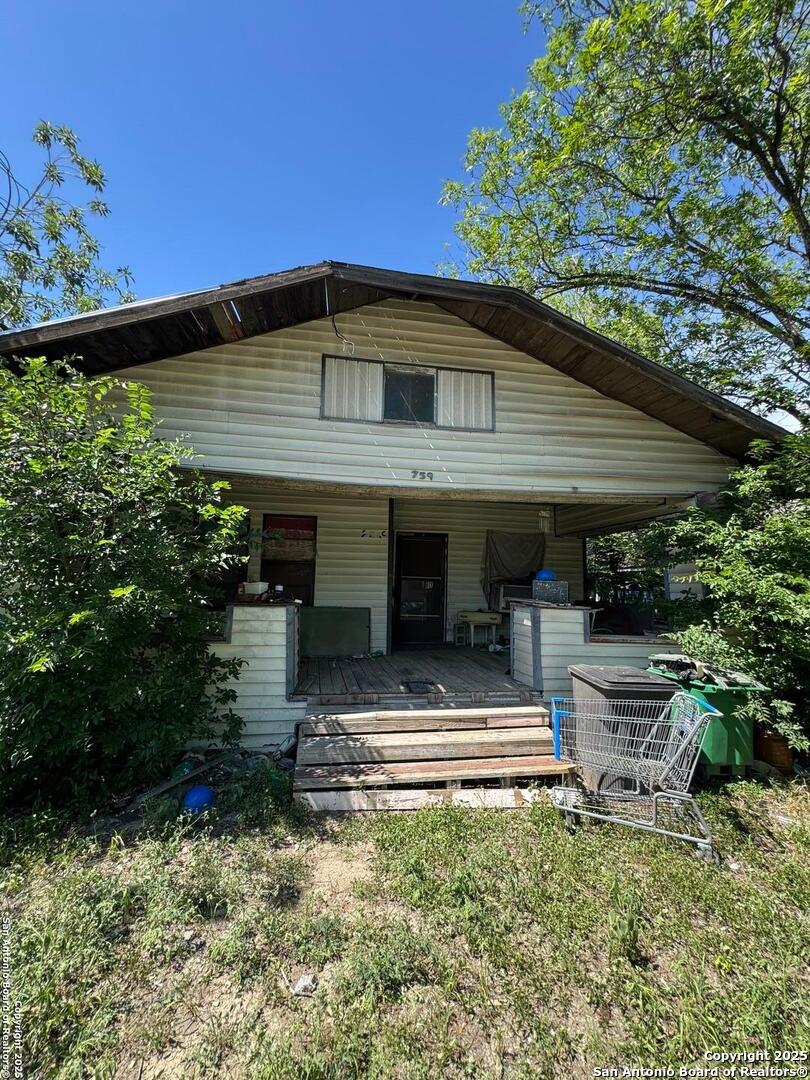
$65,000
4
bds
|
2
ba
|
1,228
sqft
|
built
1940
759 Gladstone, San Antonio, TX 78225
$931
Cash flow
16.7%
Cash-on-Cash Return
17.2%
Cap rate
2.5%
Rent to Value Ratio
Active
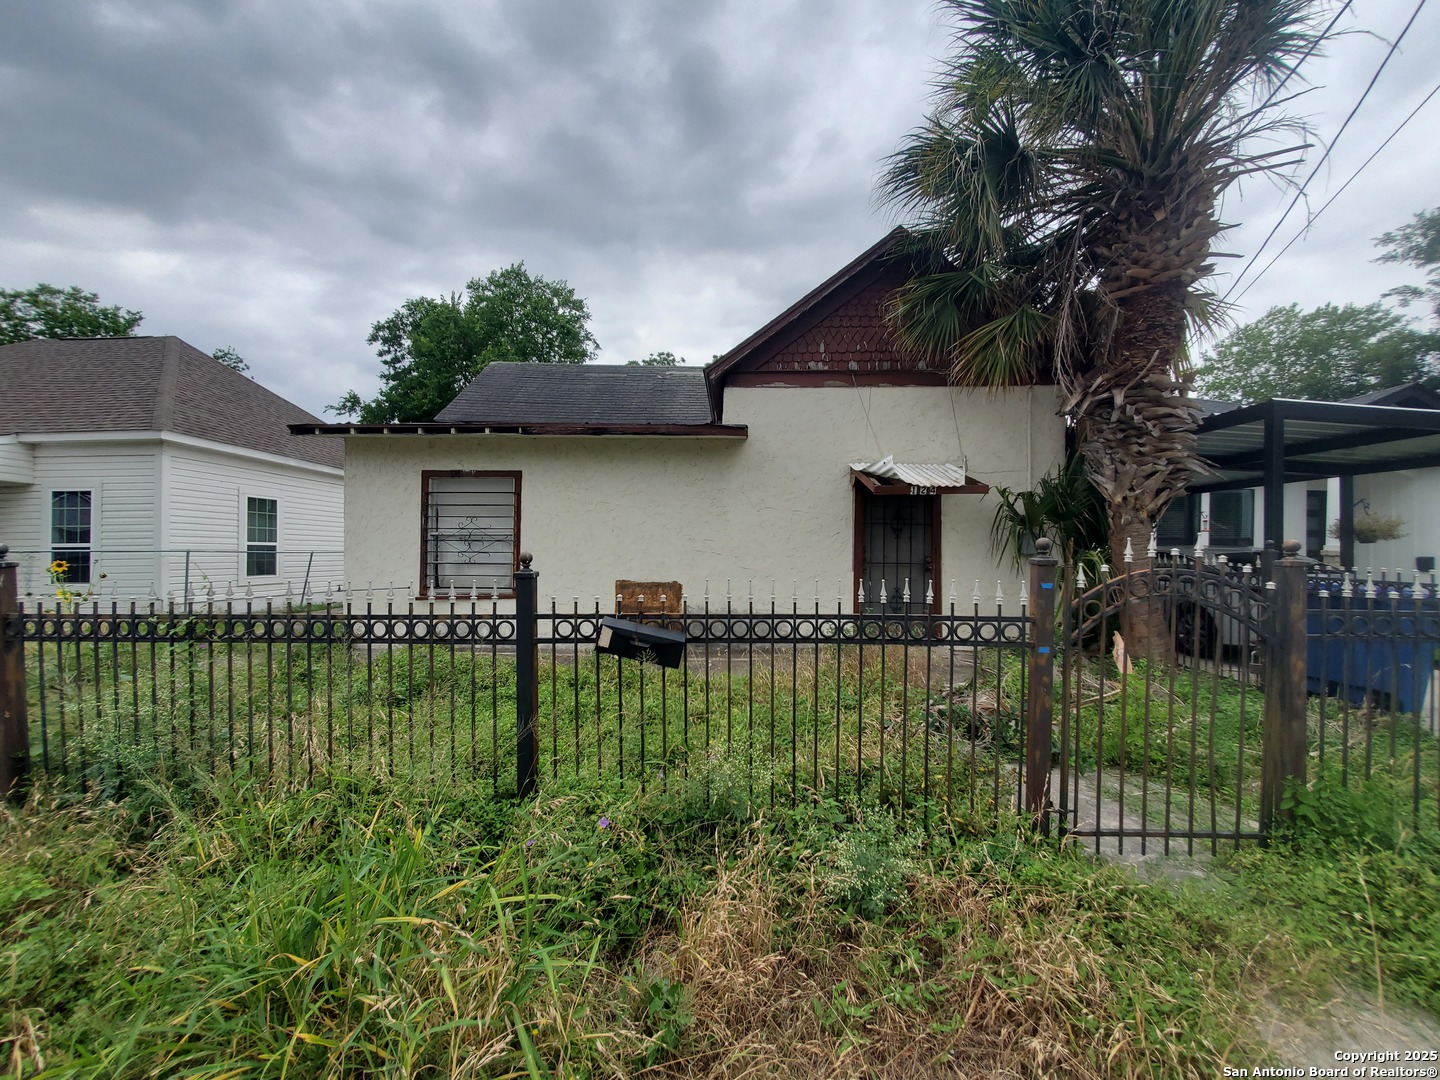
$120,000
3
bds
|
2
ba
|
1,032
sqft
|
built
1910
124 Furnish Ave, San Antonio, TX 78204
$187
Cash flow
8.1%
Cash-on-Cash Return
7.6%
Cap rate
1.3%
Rent to Value Ratio
5,912 out of 6,203 properties for sale in San Antonio, TX
Limited Results Shown
Create a free account, or log in to reveal all property listings and enjoy the complete experience.
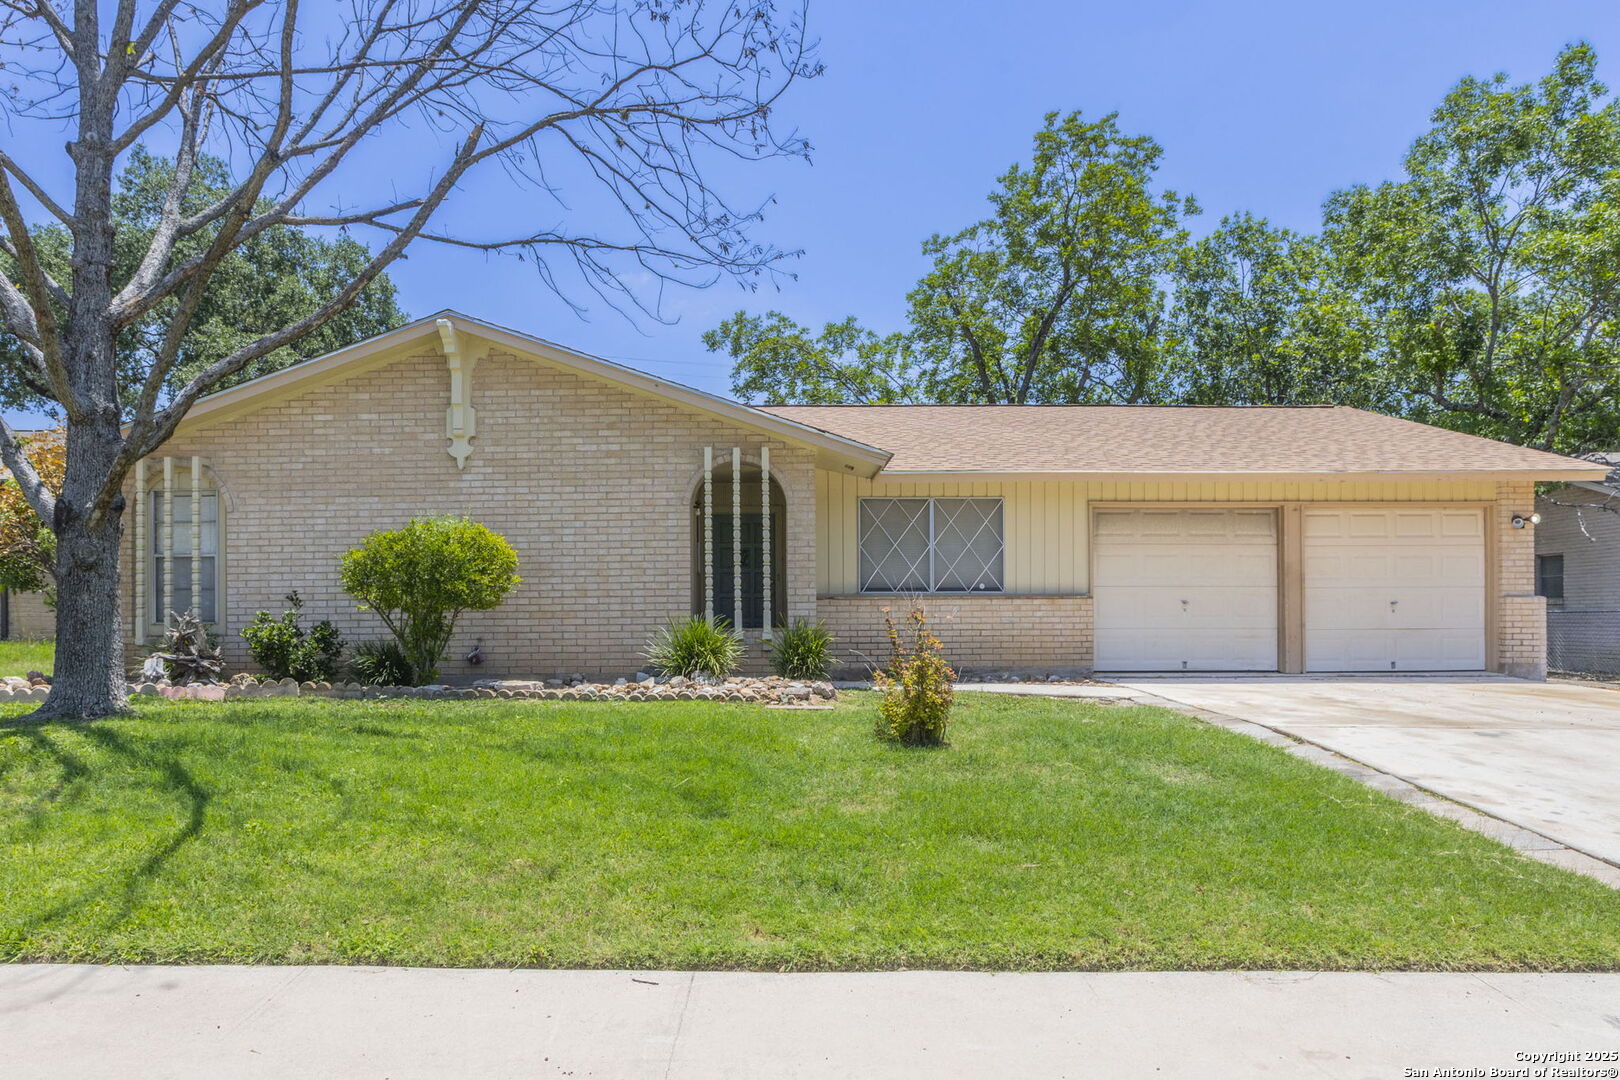
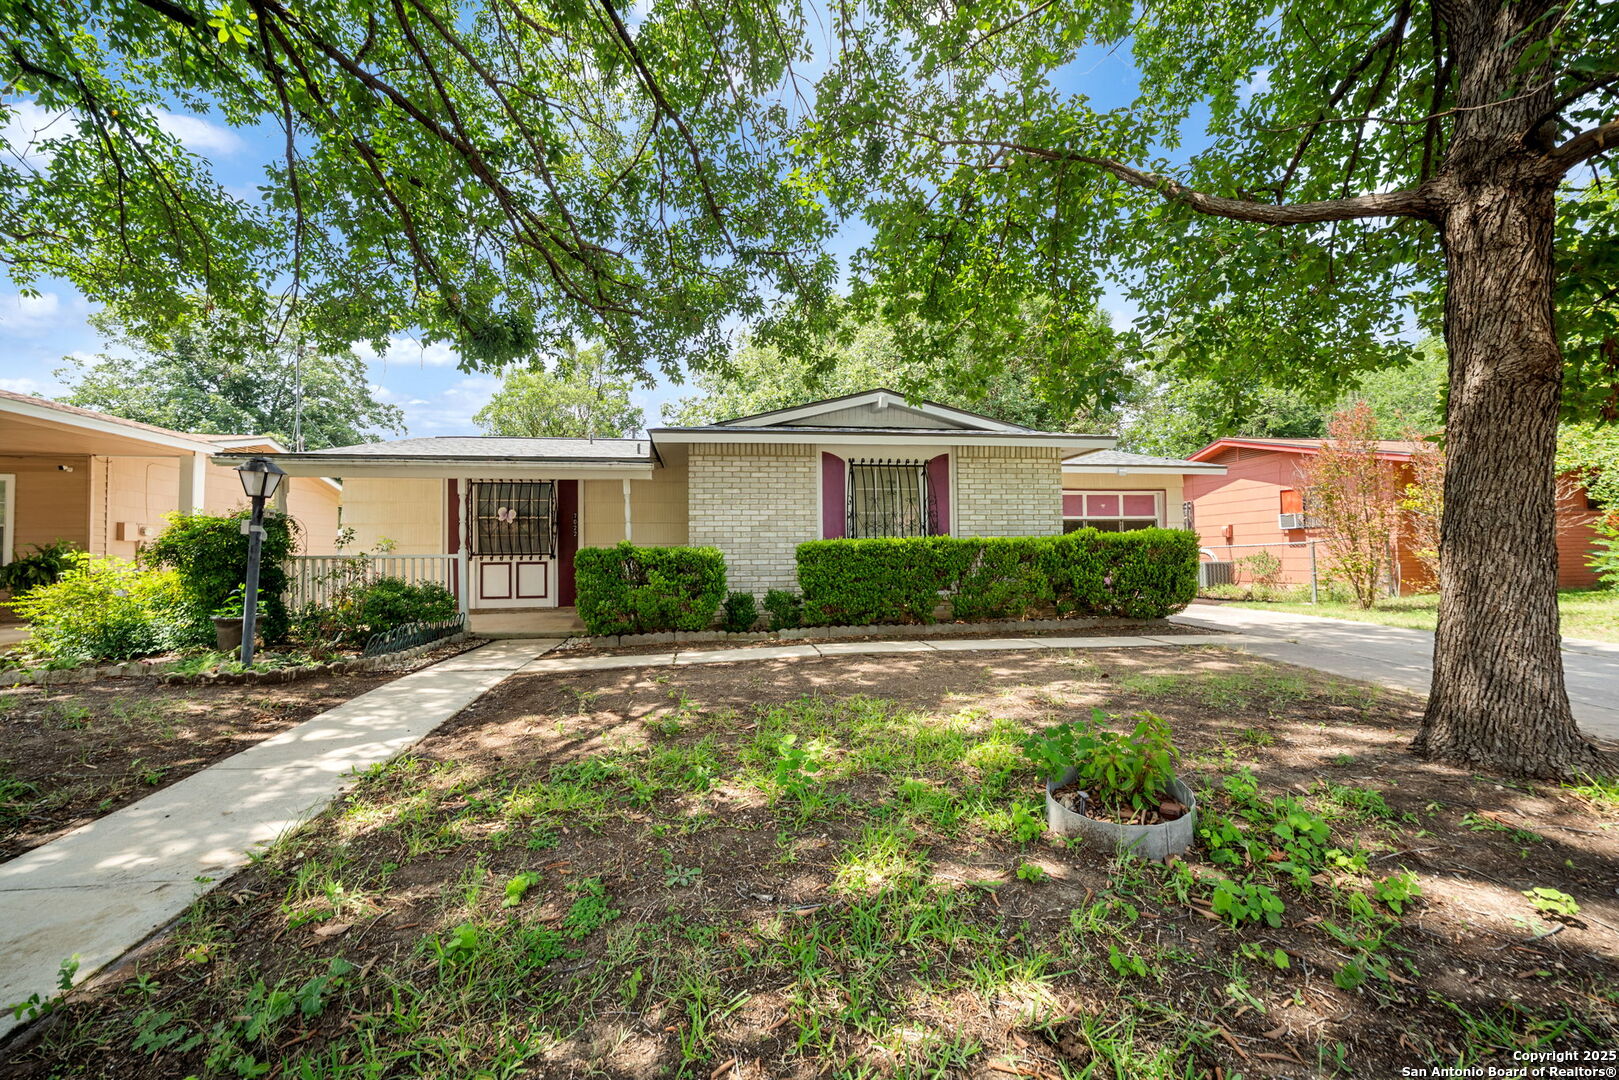
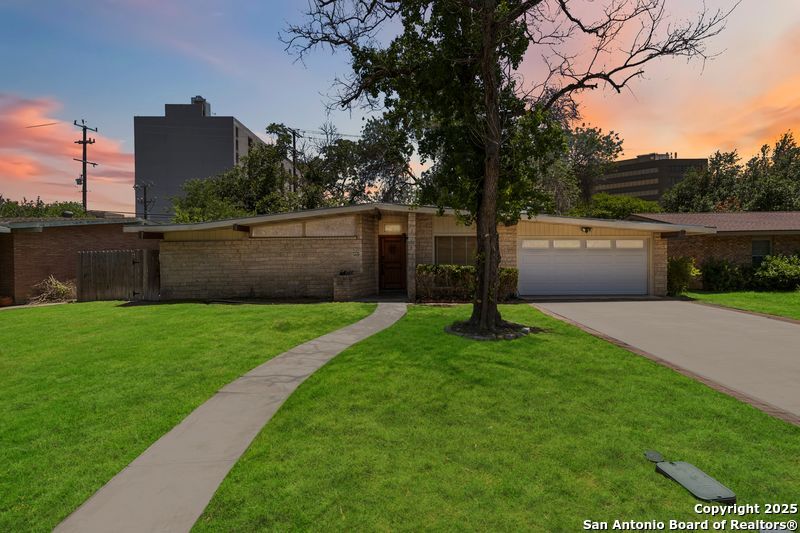
Active
$250,000
4
bds
|
2
ba
|
1,553
sqft
|
built
1967
6618 N Forest Bnd, San Antonio, TX 78240
$59
Cash flow
1.2%
Cash-on-Cash Return
6.0%
Cap rate
0.7%
Rent to Value Ratio
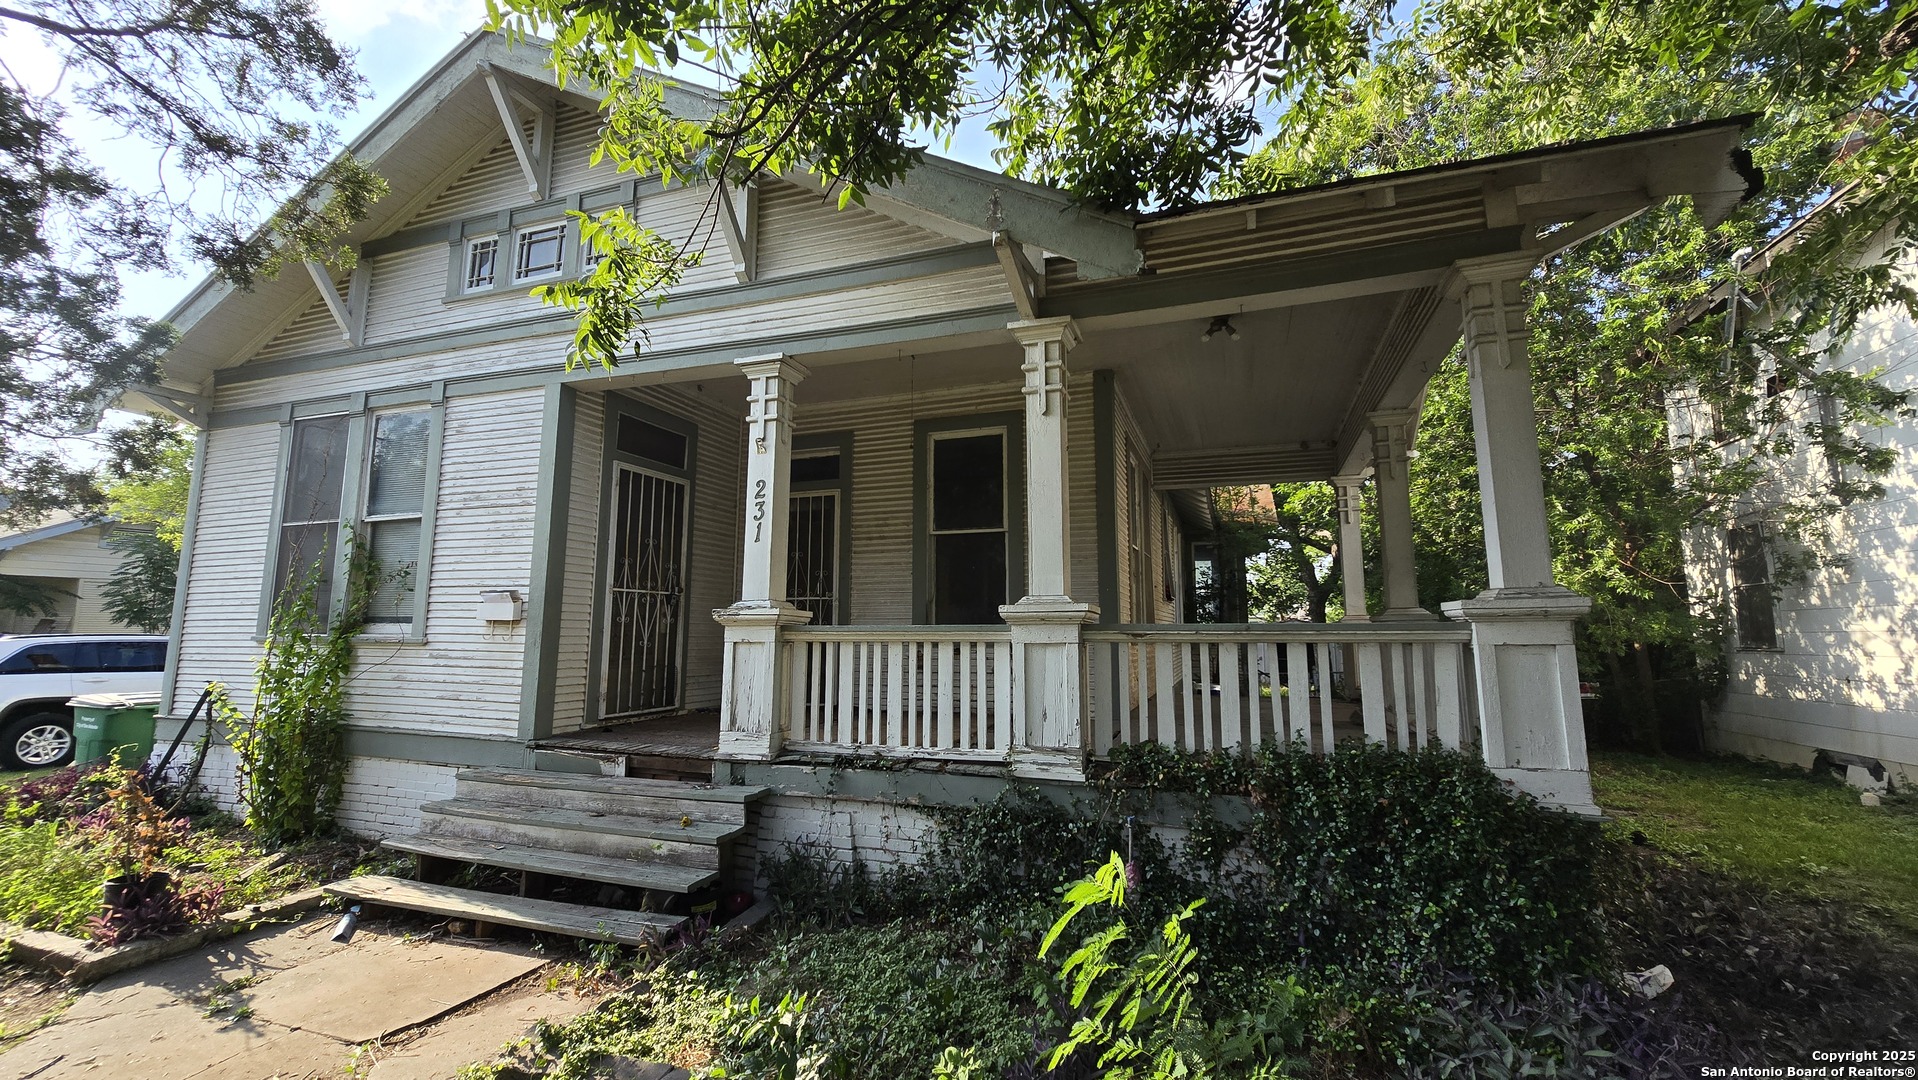
Active
$250,000
3
bds
|
1
ba
|
1,460
sqft
|
built
1915
231 Wilkens Ave, San Antonio, TX 78210
$-466
Cash flow
-9.7%
Cash-on-Cash Return
3.4%
Cap rate
0.8%
Rent to Value Ratio
Active under contract
$330,000
4
bds
|
2
ba
|
1,739
sqft
|
built
1970
339 W Silver Sands Dr, San Antonio, TX 78216
$-657
Cash flow
-10.4%
Cash-on-Cash Return
3.3%
Cap rate
0.7%
Rent to Value Ratio
Active
$120,000
3
bds
|
2
ba
|
1,032
sqft
|
built
1910
124 Furnish Ave, San Antonio, TX 78204
$187
Cash flow
8.1%
Cash-on-Cash Return
7.6%
Cap rate
1.3%
Rent to Value Ratio
Active
$185,000
3
bds
|
2
ba
|
1,057
sqft
|
built
1969
7022 Centergrove Dr, San Antonio, TX 78227
$-204
Cash flow
-5.8%
Cash-on-Cash Return
4.4%
Cap rate
0.8%
Rent to Value Ratio
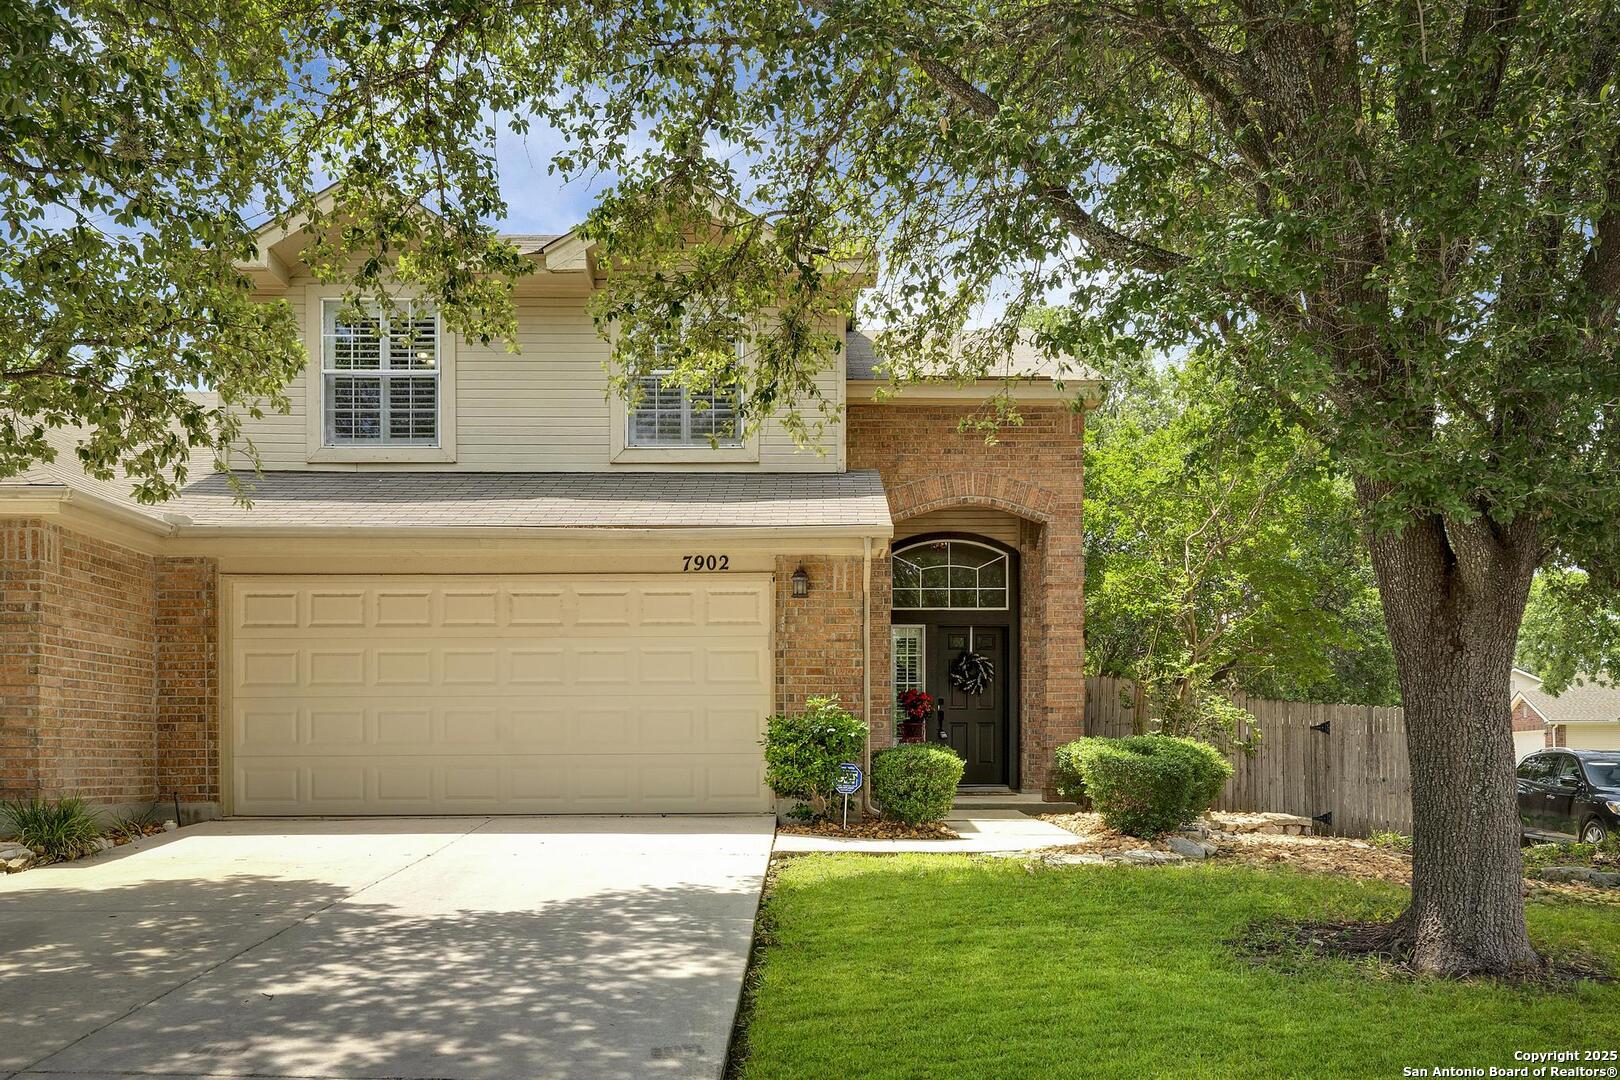
Active
$245,000
3
bds
|
3
ba
|
1,372
sqft
|
built
1997
7902 Coastal Run, San Antonio, TX 78240
$-634
Cash flow
-13.5%
Cash-on-Cash Return
2.6%
Cap rate
0.7%
Rent to Value Ratio
Active under contract
$375,000
3
bds
|
2
ba
|
1,935
sqft
|
built
1992
2430 Burning Trail St, San Antonio, TX 78232
$-1,001
Cash flow
-13.9%
Cash-on-Cash Return
2.5%
Cap rate
0.6%
Rent to Value Ratio
Active
$649,000
2
bds
|
2
ba
|
1,093
sqft
|
built
2020
123 Lexington Ave, San Antonio, TX 78205
$-3,426
Cash flow
-27.5%
Cash-on-Cash Return
-0.7%
Cap rate
0.5%
Rent to Value Ratio

Active
$890,000
5
bds
|
4
ba
|
5,919
sqft
|
built
2001
13307 Ridge Valley Ln, San Antonio, TX 78253
$-2,497
Cash flow
-14.6%
Cash-on-Cash Return
2.3%
Cap rate
0.5%
Rent to Value Ratio
Active
$450,000
2
bds
|
2
ba
|
1,696
sqft
|
built
1956
403 E Nottingham Dr, San Antonio, TX 78209
$-1,335
Cash flow
-15.5%
Cash-on-Cash Return
2.1%
Cap rate
0.6%
Rent to Value Ratio
Active
$650,000
5
bds
|
4
ba
|
3,036
sqft
|
built
2020
1817 Delafield Rd, San Antonio, TX 78253
$-1,639
Cash flow
-13.2%
Cash-on-Cash Return
2.7%
Cap rate
0.5%
Rent to Value Ratio
Active under contract
$165,000
2
bds
|
2
ba
|
1,090
sqft
|
built
2003
2111 Clear Ct, San Antonio, TX 78227
$-55
Cash flow
-1.7%
Cash-on-Cash Return
5.3%
Cap rate
0.9%
Rent to Value Ratio
Active
$329,900
2
bds
|
2
ba
|
1,240
sqft
|
built
1984
14126 Sage Trl, San Antonio, TX 78231
$-839
Cash flow
-13.3%
Cash-on-Cash Return
2.6%
Cap rate
0.5%
Rent to Value Ratio
Active
$65,000
4
bds
|
2
ba
|
1,228
sqft
|
built
1940
759 Gladstone, San Antonio, TX 78225
$931
Cash flow
16.7%
Cash-on-Cash Return
17.2%
Cap rate
2.5%
Rent to Value Ratio
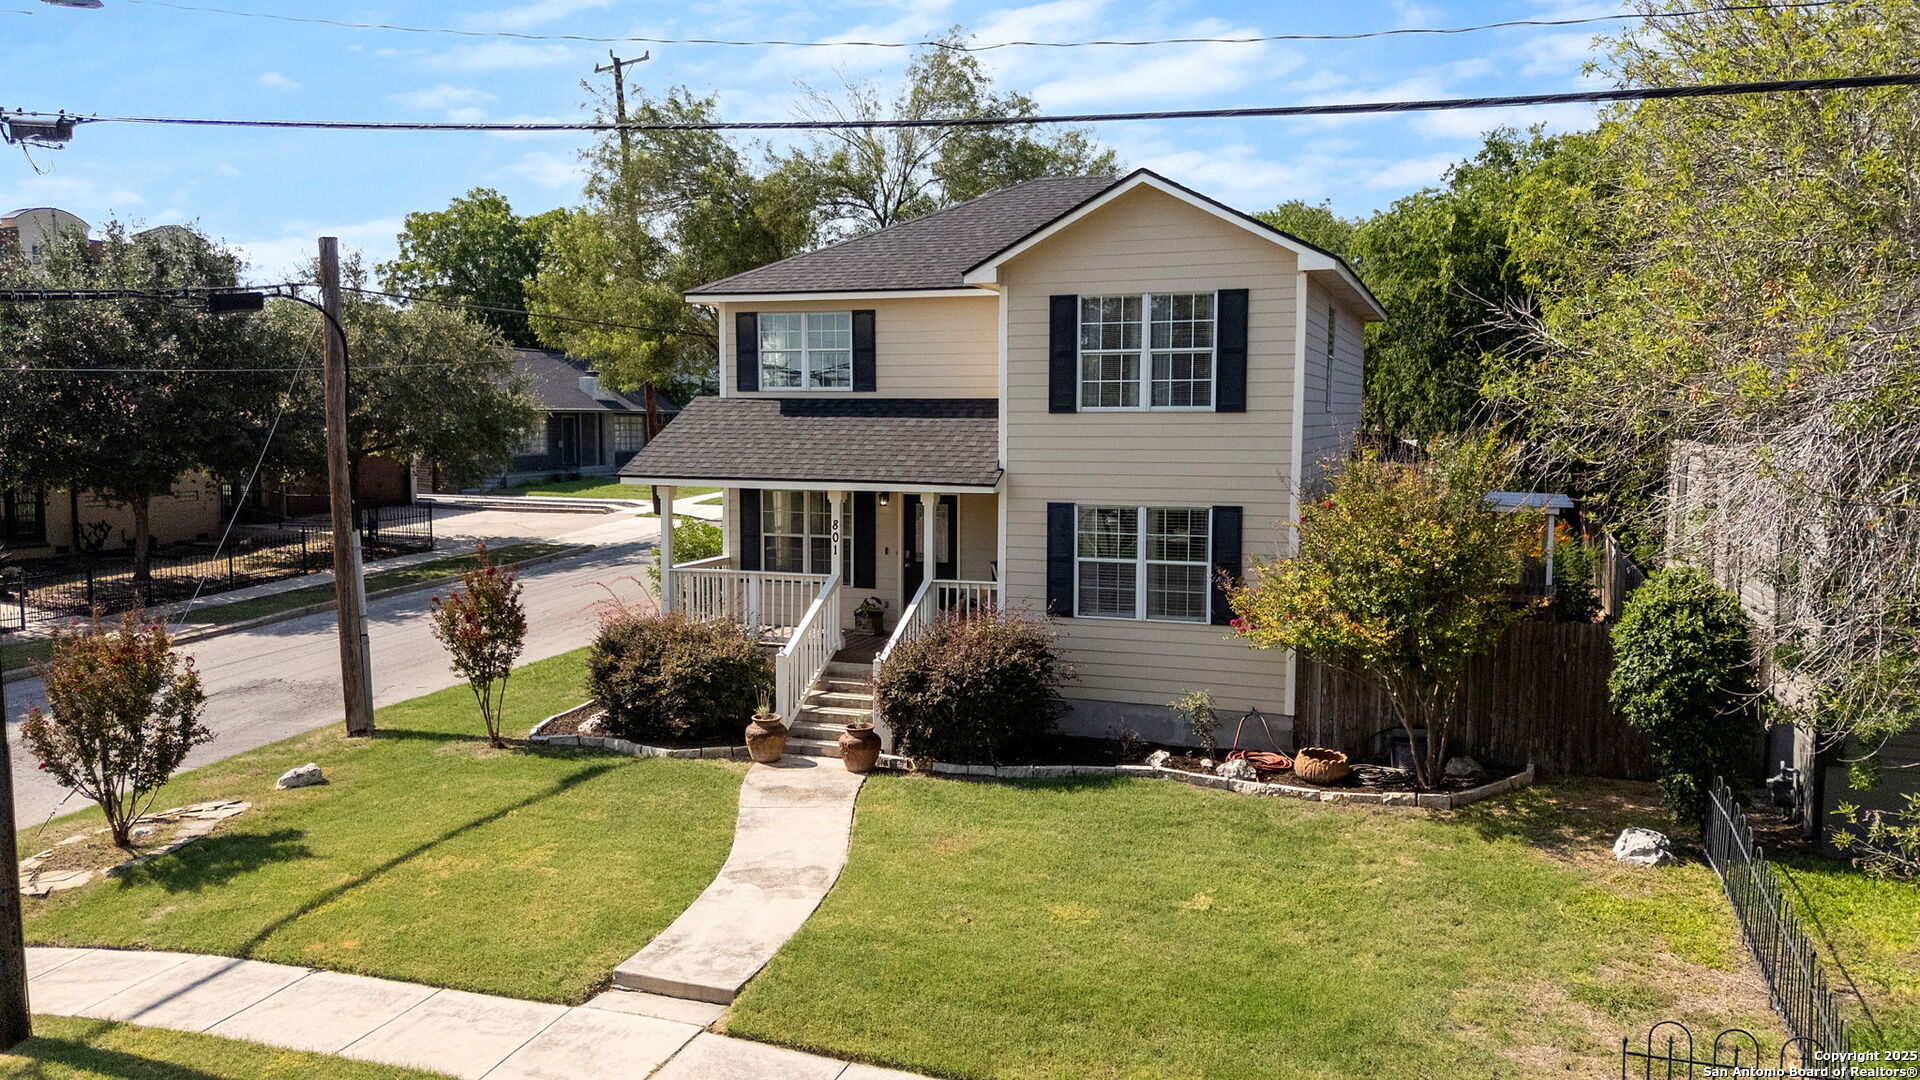
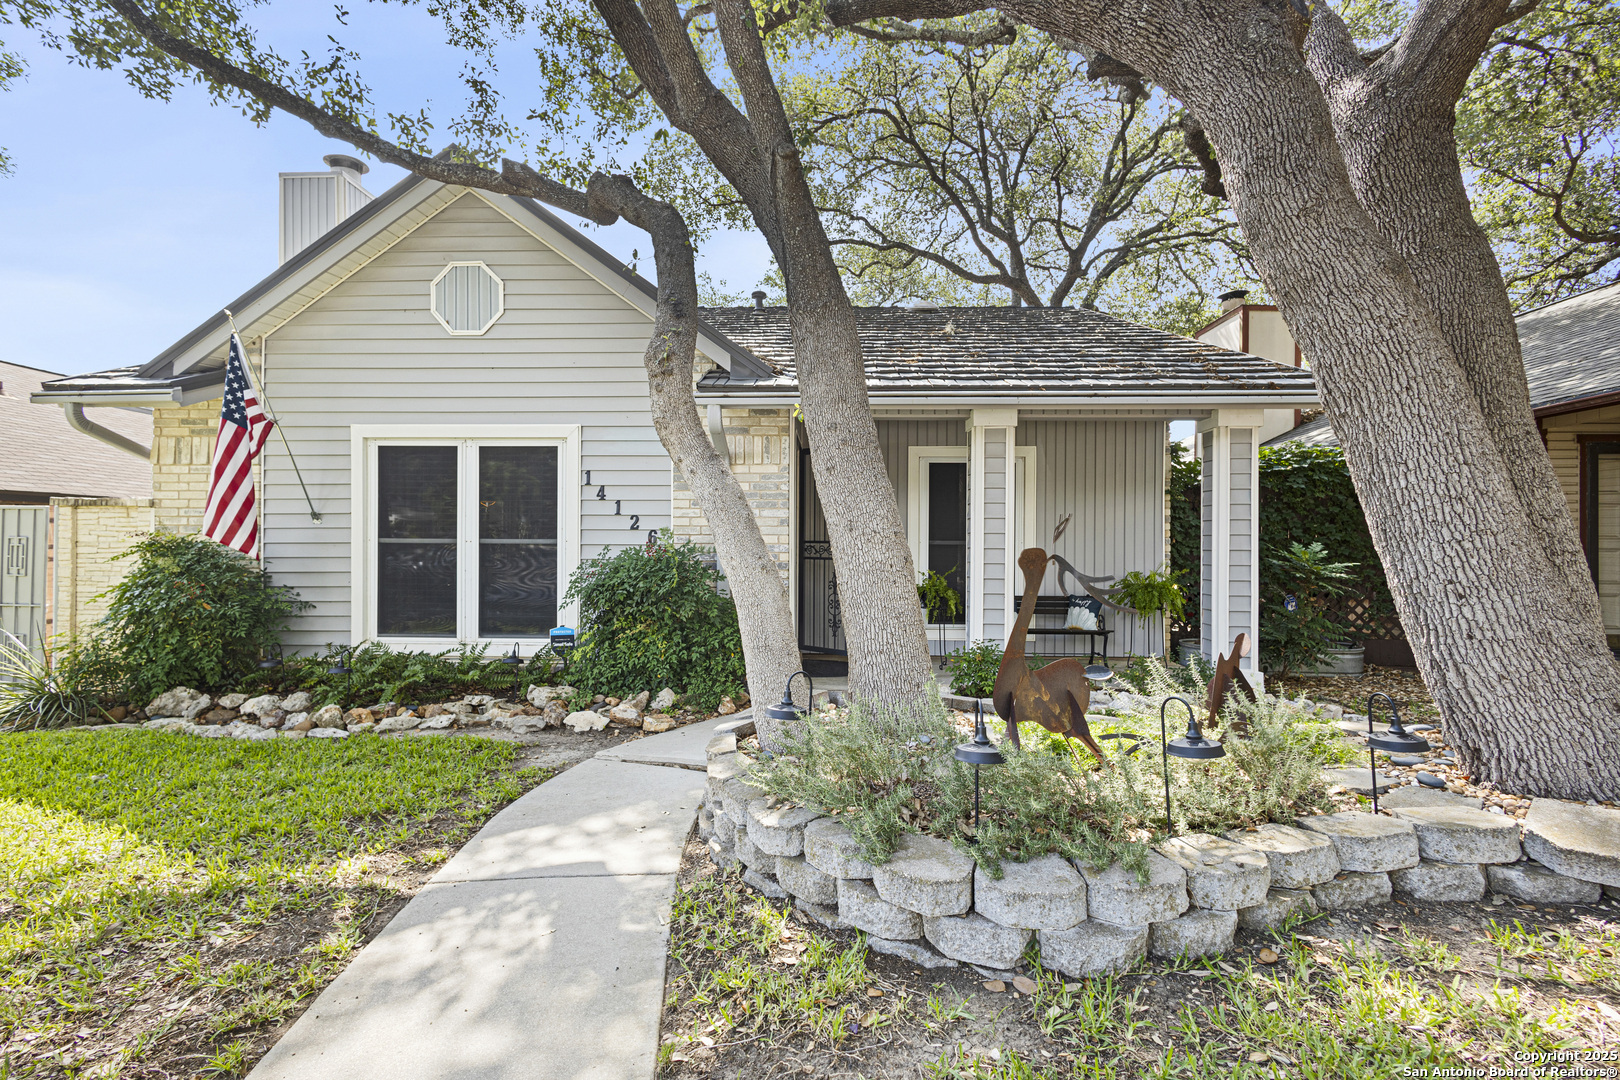
Active
$348,000
4
bds
|
3
ba
|
1,616
sqft
|
built
2003
801 Dawson St, San Antonio, TX 78202
$-729
Cash flow
-10.9%
Cash-on-Cash Return
3.2%
Cap rate
0.7%
Rent to Value Ratio
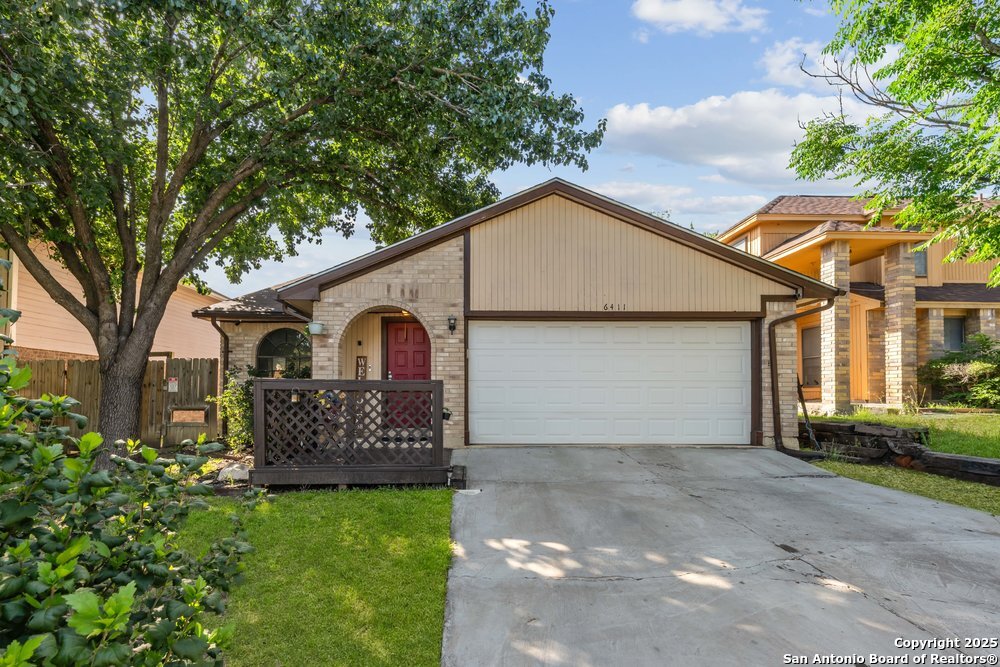
Active
$250,000
3
bds
|
2
ba
|
1,508
sqft
|
built
1985
6411 Gray Rdg, San Antonio, TX 78233
$-79
Cash flow
-1.6%
Cash-on-Cash Return
5.3%
Cap rate
0.6%
Rent to Value Ratio
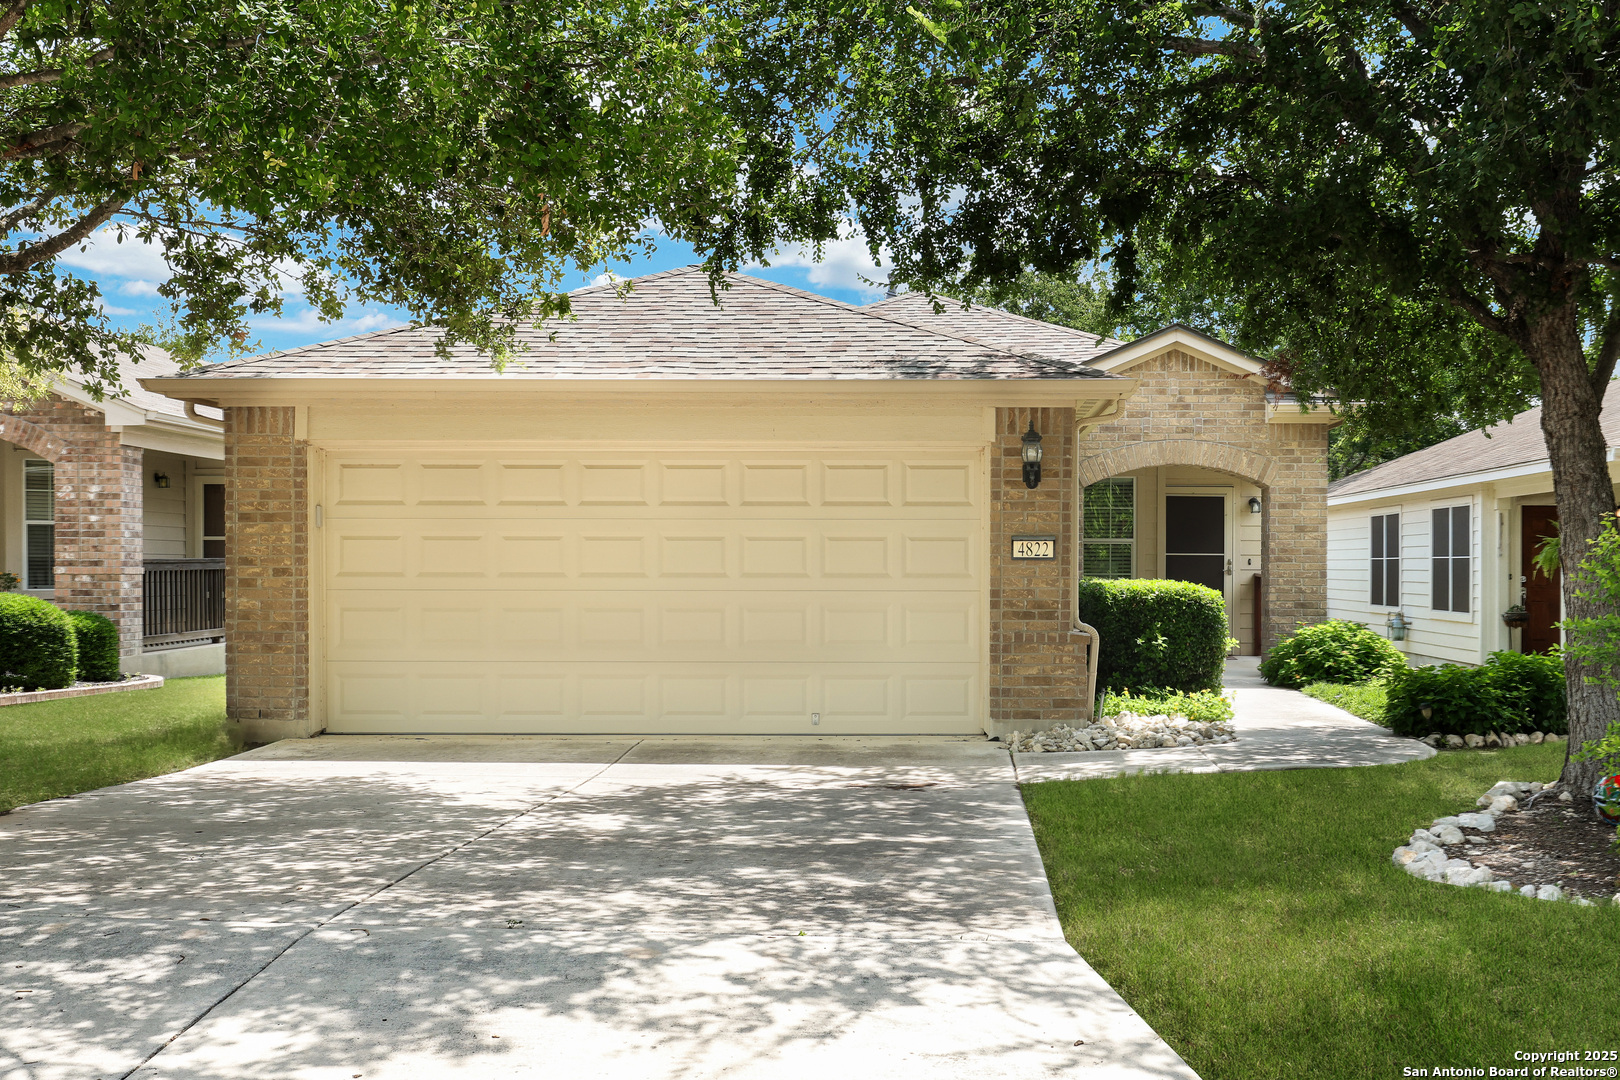
Active
$290,900
2
bds
|
2
ba
|
1,465
sqft
|
built
2009
4822 Sandhill Crane, San Antonio, TX 78253
$-760
Cash flow
-13.6%
Cash-on-Cash Return
2.5%
Cap rate
0.6%
Rent to Value Ratio
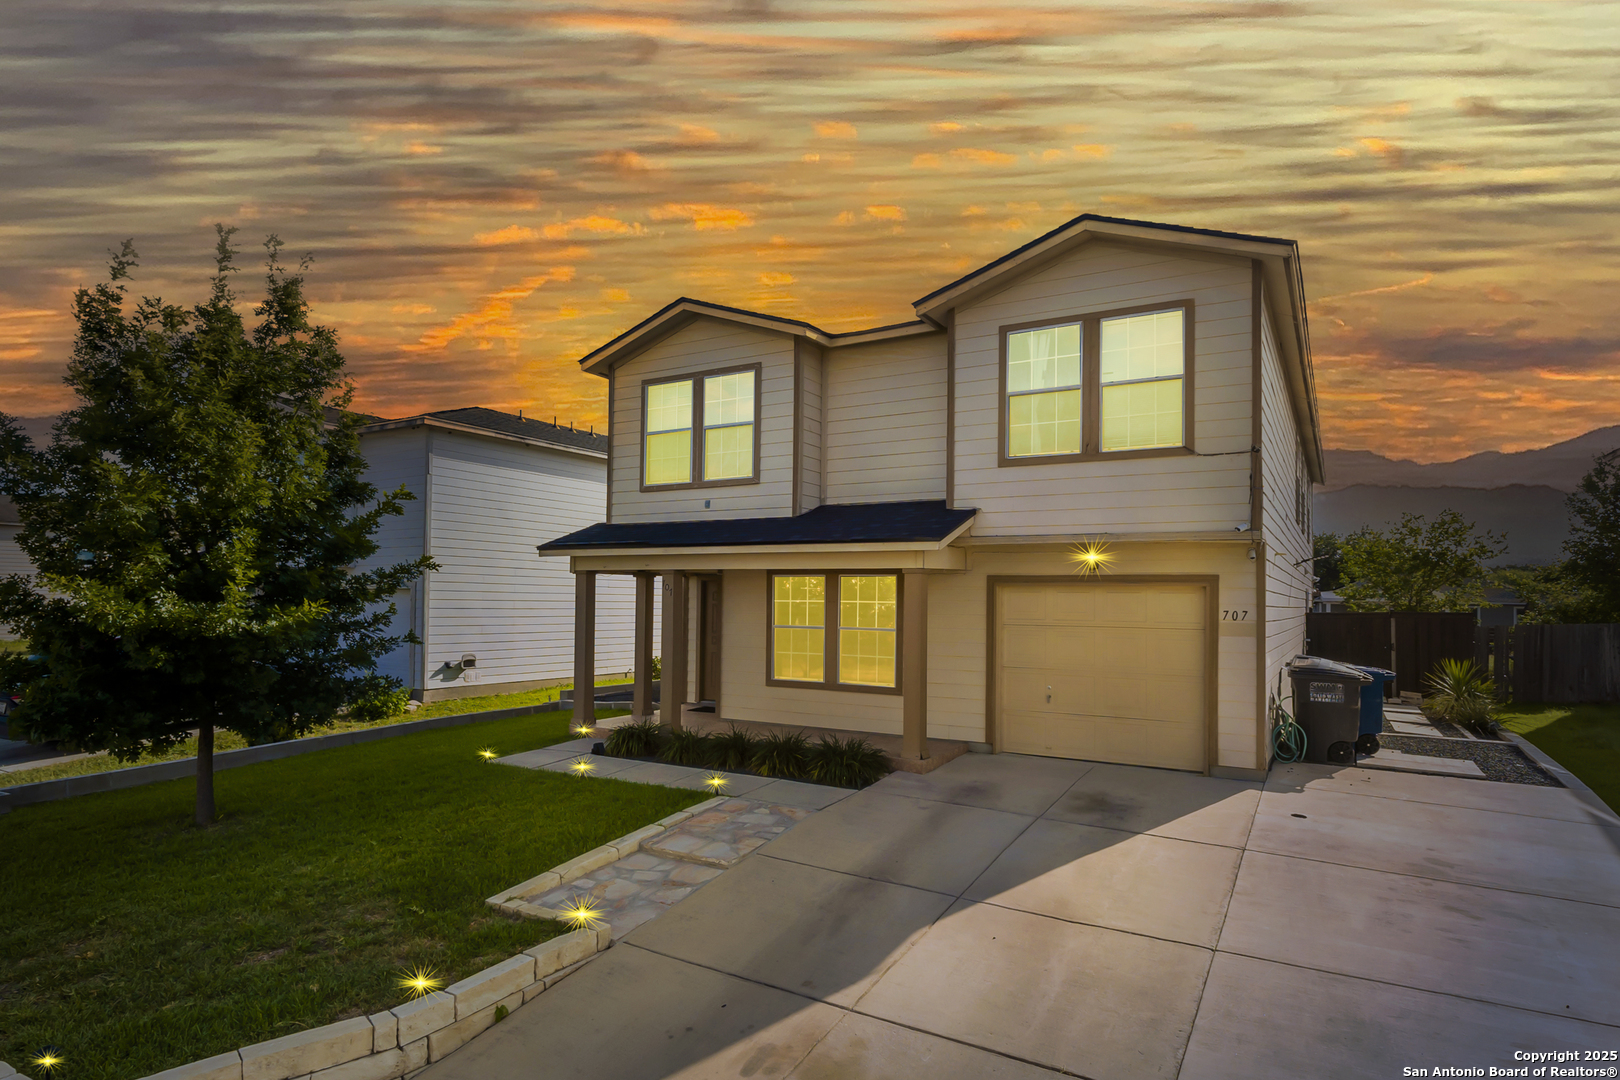
Active
$310,000
4
bds
|
4
ba
|
3,178
sqft
|
built
2005
707 Ridingate Farm, San Antonio, TX 78228
$-478
Cash flow
-8.0%
Cash-on-Cash Return
3.8%
Cap rate
0.7%
Rent to Value Ratio
Active
$650,000
4
bds
|
3
ba
|
2,512
sqft
|
built
2012
1126 Via Se Villa, San Antonio, TX 78260
$-1,911
Cash flow
-15.3%
Cash-on-Cash Return
2.2%
Cap rate
0.5%
Rent to Value Ratio
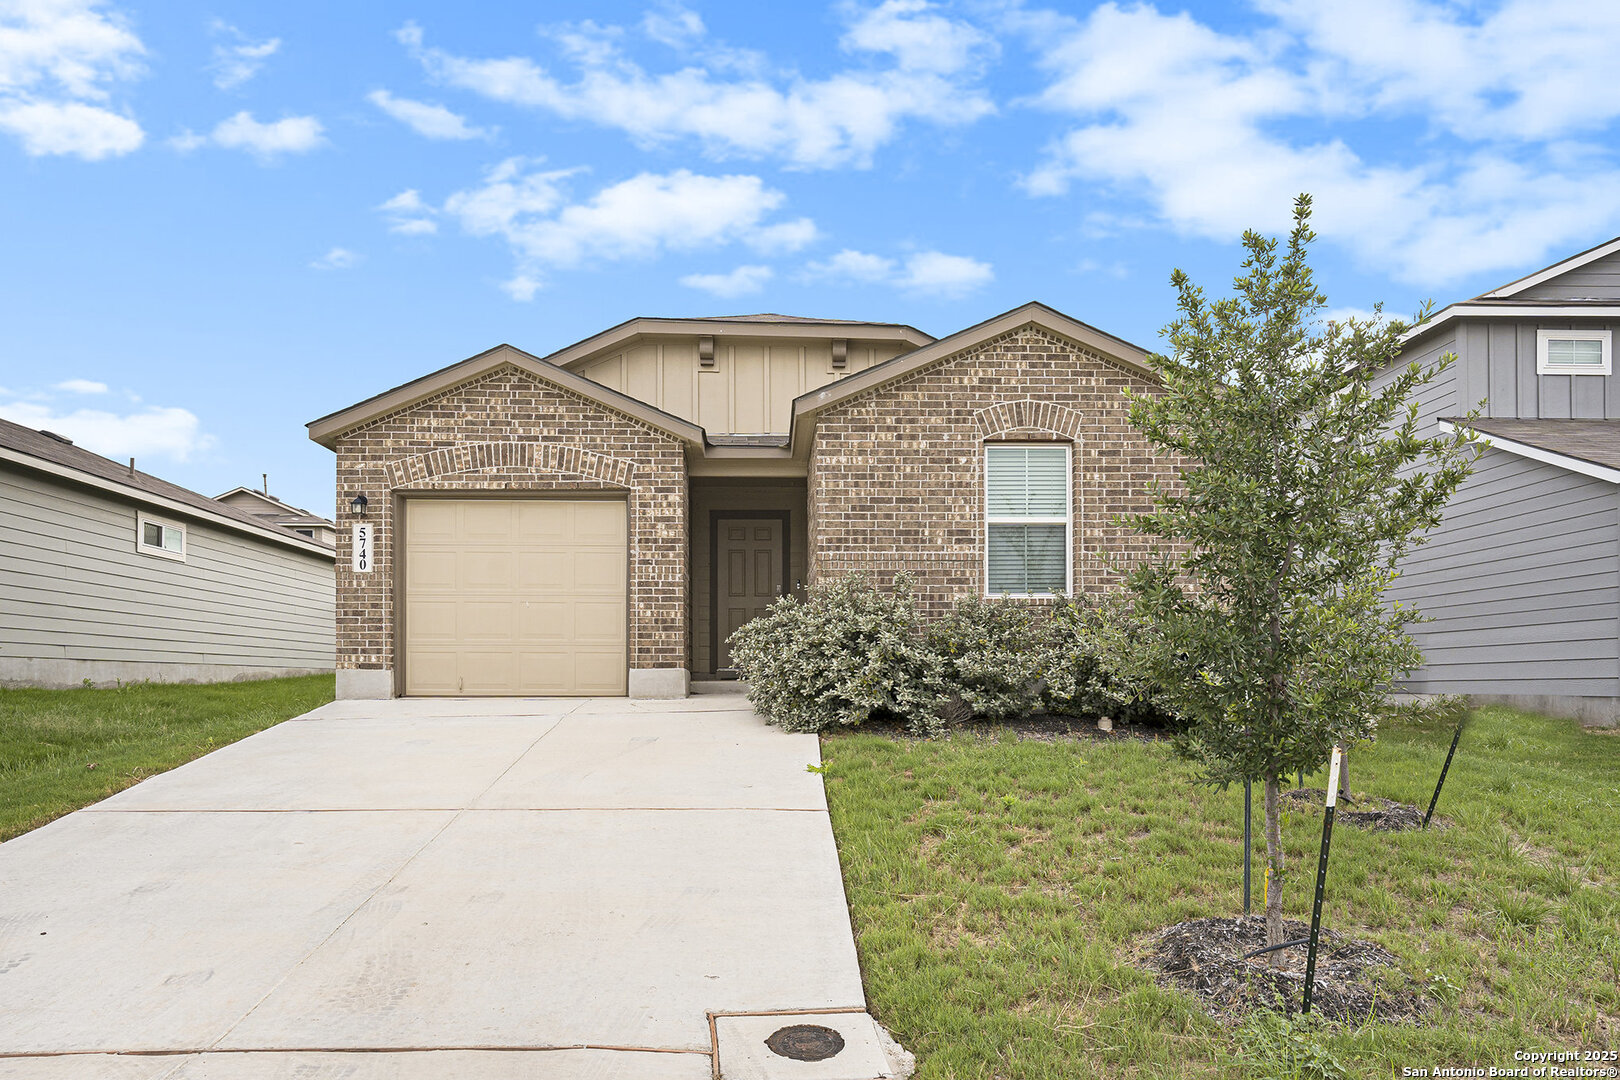
Active
$254,500
3
bds
|
2
ba
|
1,307
sqft
|
built
2022
5740 Brook Pr, San Antonio, TX 78244
$-443
Cash flow
-9.1%
Cash-on-Cash Return
3.6%
Cap rate
0.7%
Rent to Value Ratio
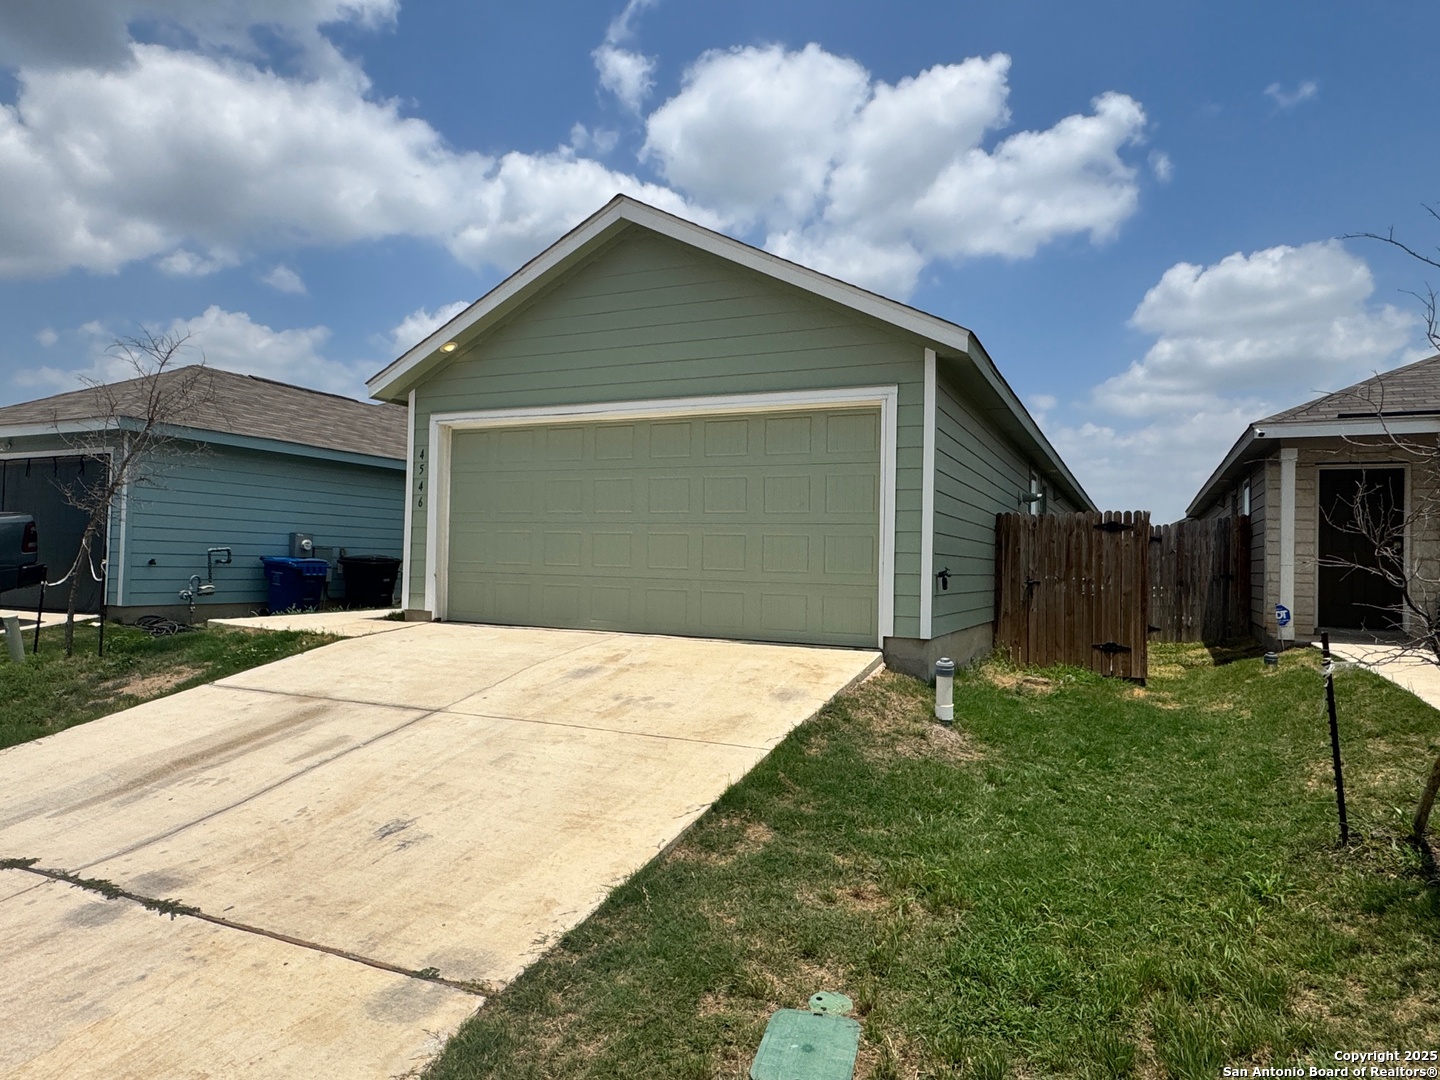
Active
$230,000
4
bds
|
2
ba
|
1,500
sqft
|
built
2023
4546 Zoe Pass, San Antonio, TX 78222
$-341
Cash flow
-7.7%
Cash-on-Cash Return
3.9%
Cap rate
0.7%
Rent to Value Ratio
Active
$253,000
3
bds
|
2
ba
|
1,352
sqft
|
built
1985
6130 Valley Hl, San Antonio, TX 78250
$-526
Cash flow
-10.8%
Cash-on-Cash Return
3.2%
Cap rate
0.7%
Rent to Value Ratio
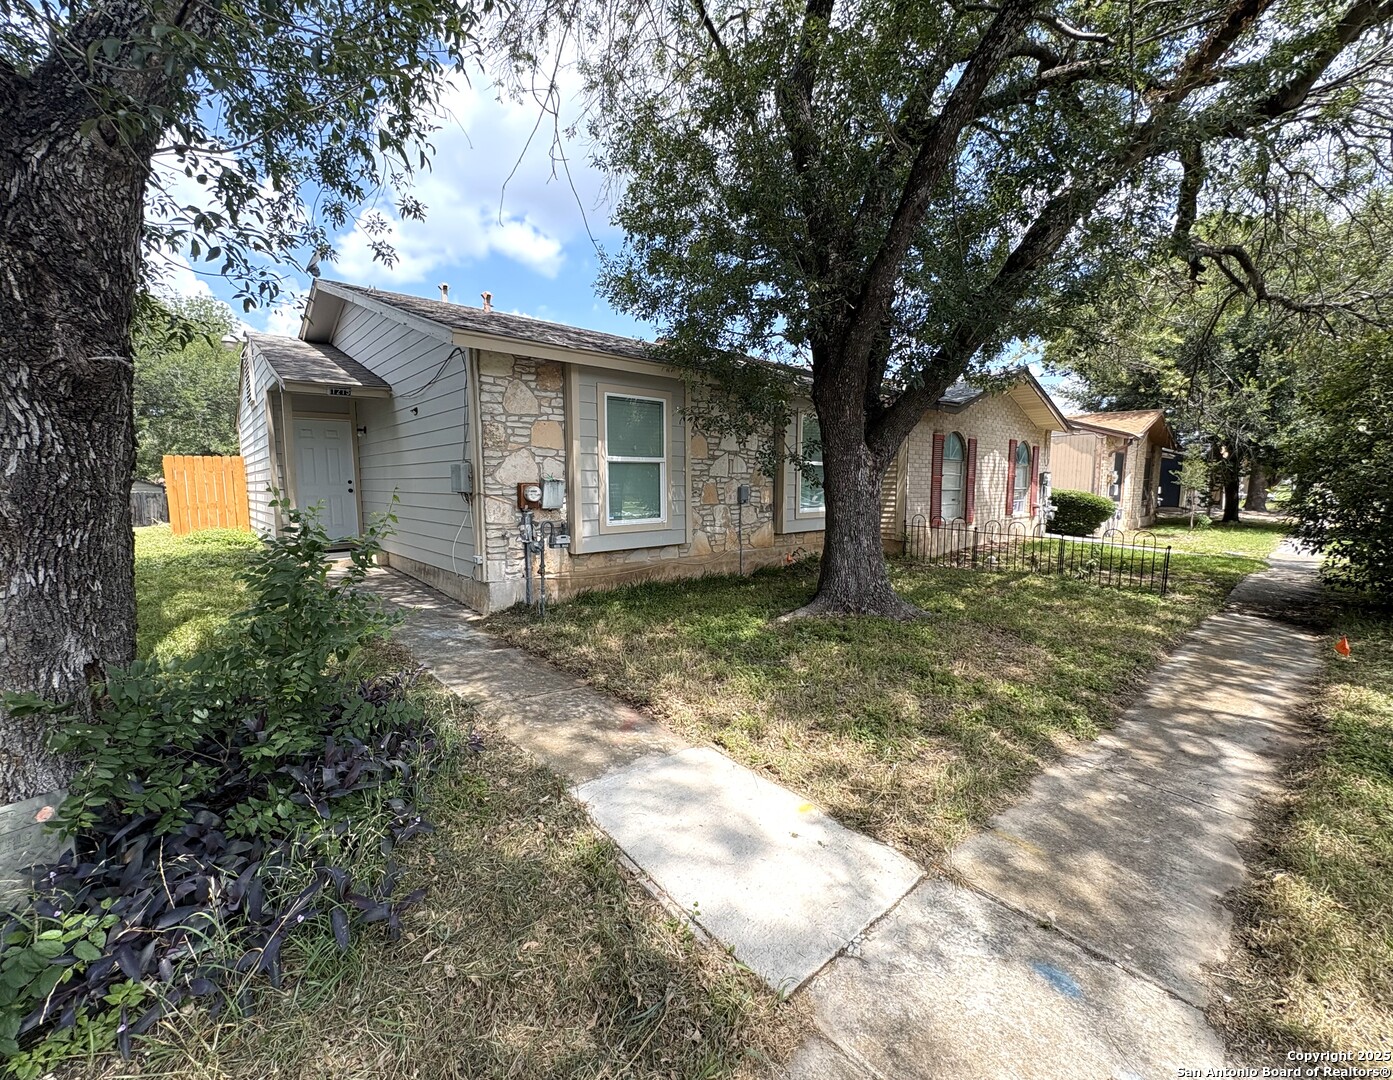
Active
$165,000
1
bds
|
4
ba
|
884
sqft
|
built
1979
1215 Klondike St, San Antonio, TX 78245
$47
Cash flow
1.5%
Cash-on-Cash Return
6.0%
Cap rate
0.7%
Rent to Value Ratio
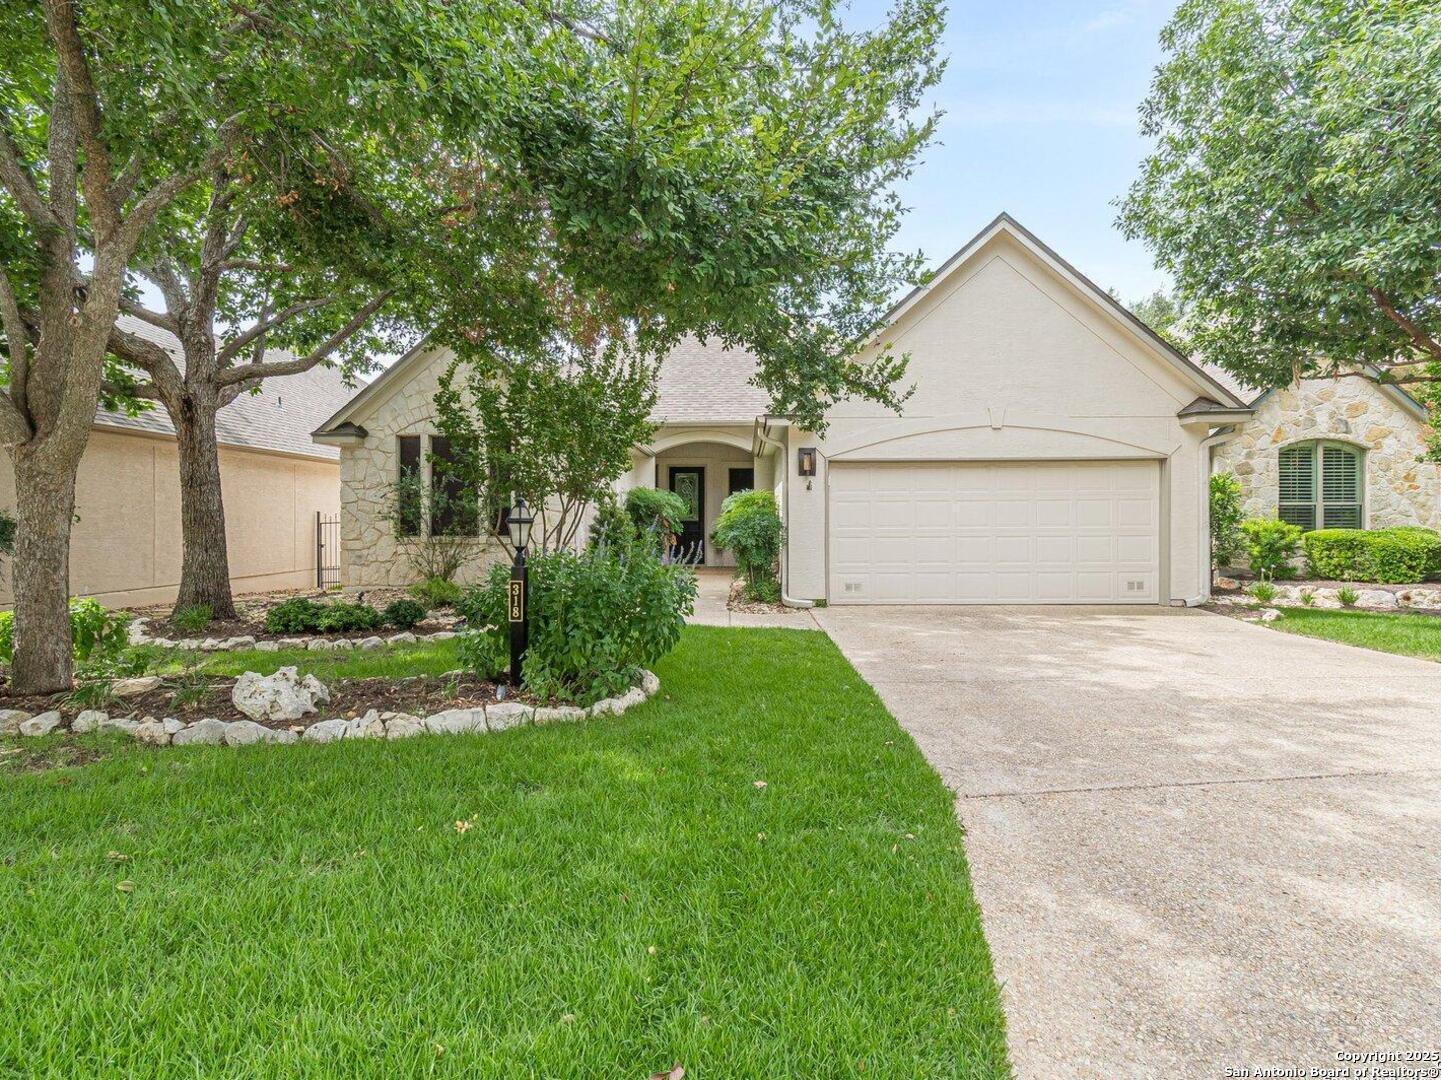
Active
$560,000
3
bds
|
3
ba
|
2,817
sqft
|
built
2007
318 Roseheart, San Antonio, TX 78259
$-1,860
Cash flow
-17.3%
Cash-on-Cash Return
1.7%
Cap rate
0.6%
Rent to Value Ratio
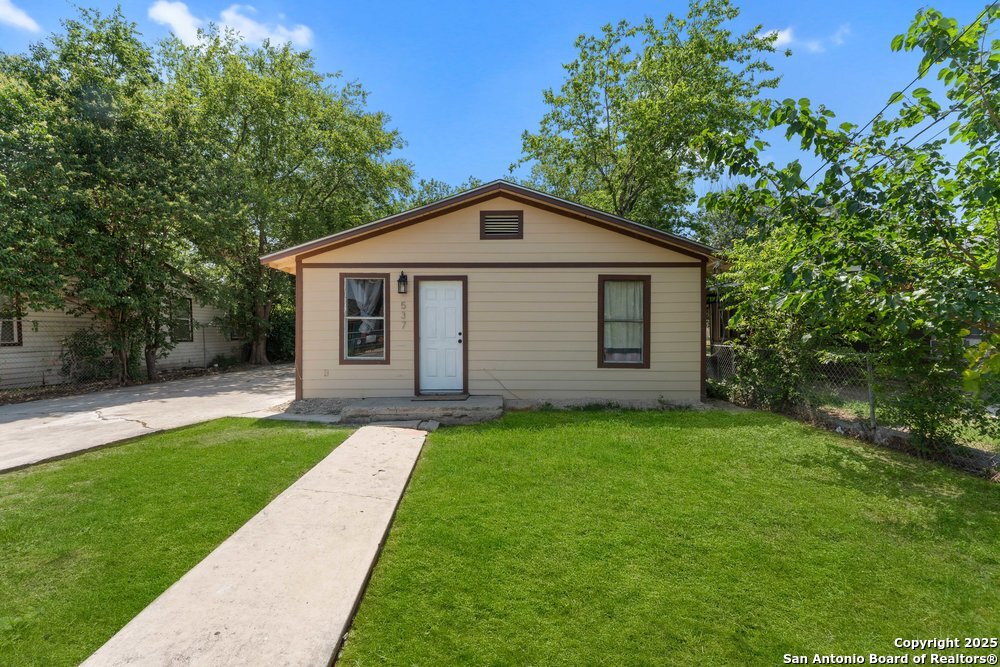
Active
$130,000
3
bds
|
1
ba
|
912
sqft
|
built
1962
537 N San Gabriel Ave, San Antonio, TX 78228
$-72
Cash flow
-2.9%
Cash-on-Cash Return
5.0%
Cap rate
0.8%
Rent to Value Ratio
Active
$1,429,000
4
bds
|
5
ba
|
5,040
sqft
|
built
2015
20414 Tejas Crk, San Antonio, TX 78257
$-4,489
Cash flow
-16.4%
Cash-on-Cash Return
1.9%
Cap rate
0.4%
Rent to Value Ratio
Active
$589,900
5
bds
|
4
ba
|
3,594
sqft
|
built
2002
3329 Navasota Cir, San Antonio, TX 78259
$-2,145
Cash flow
-19.0%
Cash-on-Cash Return
1.3%
Cap rate
0.4%
Rent to Value Ratio
Active
$320,000
2
bds
|
2
ba
|
1,388
sqft
|
built
2000
22150 Goldcrest Run, San Antonio, TX 78260
$-976
Cash flow
-15.9%
Cash-on-Cash Return
2.0%
Cap rate
0.6%
Rent to Value Ratio
Active
$455,000
4
bds
|
3
ba
|
2,656
sqft
|
built
1998
1604 Santa Fe Trail Dr, San Antonio, TX 78232
$-1,342
Cash flow
-15.4%
Cash-on-Cash Return
2.1%
Cap rate
0.6%
Rent to Value Ratio
Active
$325,000
3
bds
|
2
ba
|
1,432
sqft
|
built
1960
506 Marquis Ln, San Antonio, TX 78216
$-668
Cash flow
-10.7%
Cash-on-Cash Return
3.2%
Cap rate
0.6%
Rent to Value Ratio
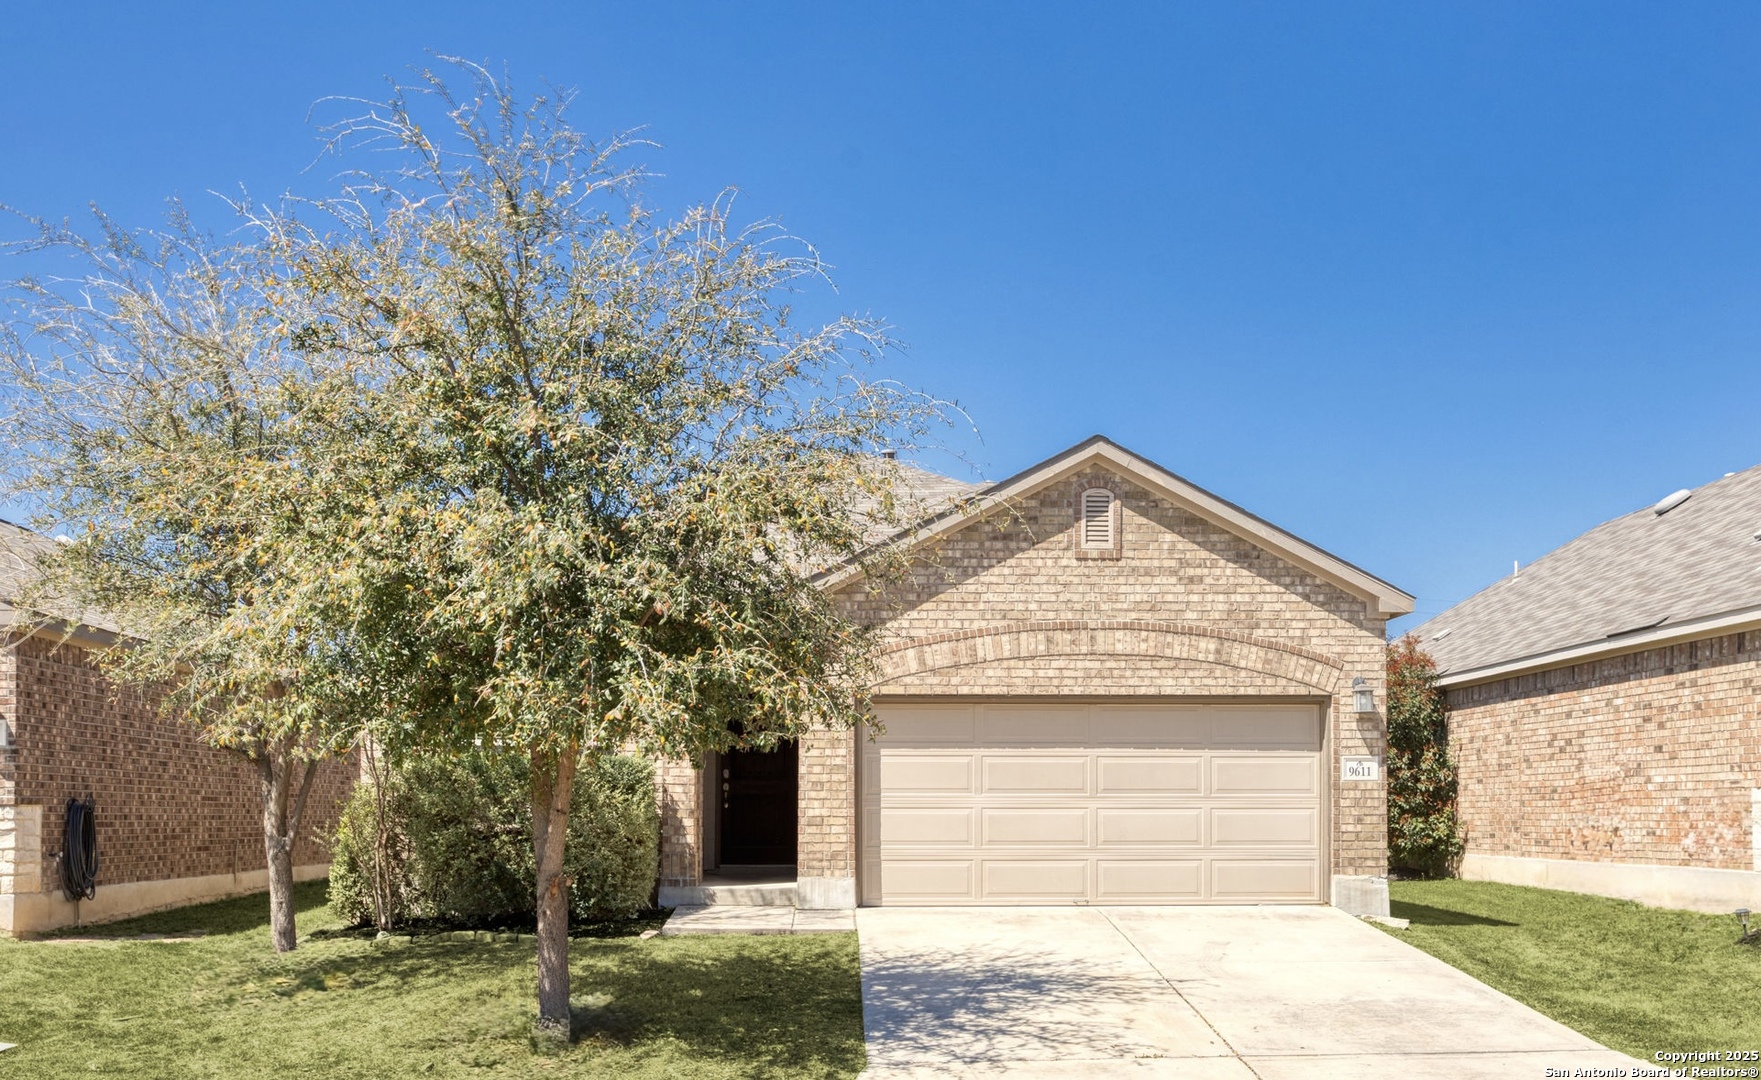
Active
$299,000
4
bds
|
2
ba
|
1,778
sqft
|
built
2016
9611 Bricewood Oak, San Antonio, TX 78254
$-611
Cash flow
-10.7%
Cash-on-Cash Return
3.2%
Cap rate
0.7%
Rent to Value Ratio
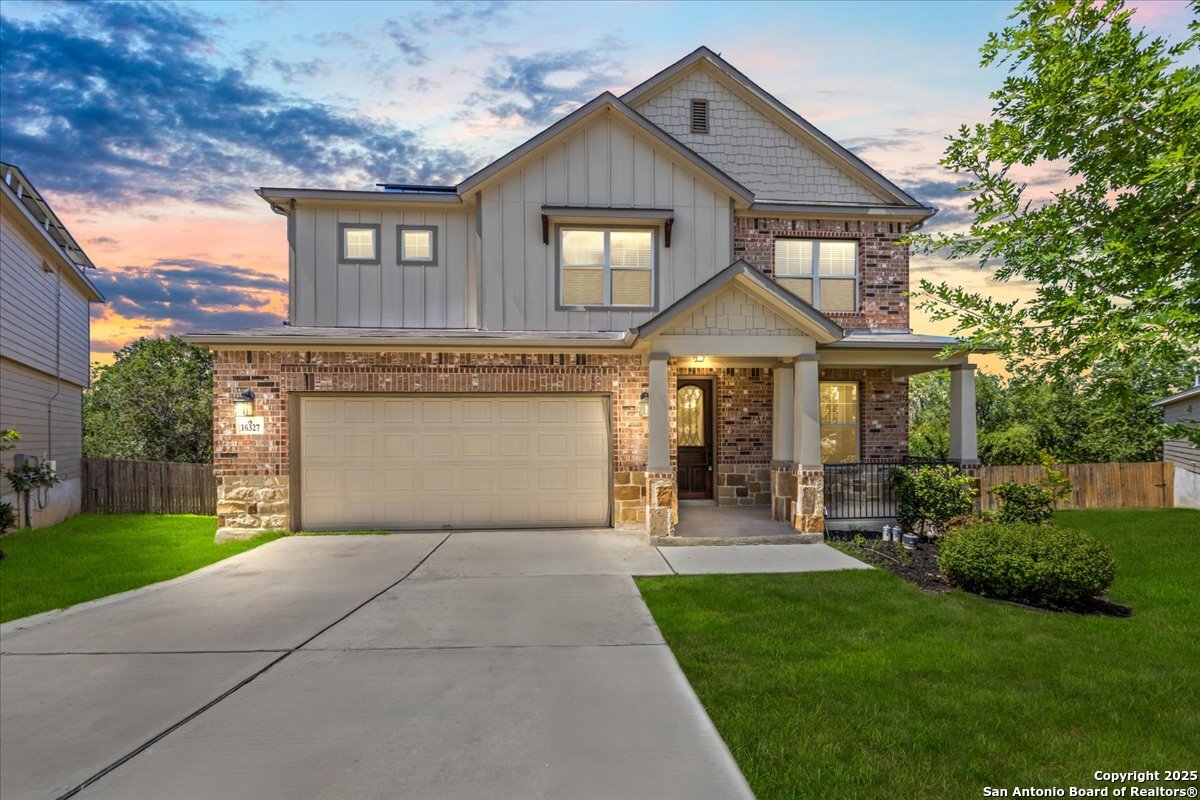
Active
$389,900
4
bds
|
3
ba
|
2,307
sqft
|
built
2017
16327 Amistad Pass, San Antonio, TX 78247
$-1,075
Cash flow
-14.4%
Cash-on-Cash Return
2.4%
Cap rate
0.6%
Rent to Value Ratio

Active
$219,990
3
bds
|
2
ba
|
1,353
sqft
|
built
2007
10323 Green Candle, San Antonio, TX 78223
$-239
Cash flow
-5.7%
Cash-on-Cash Return
4.4%
Cap rate
0.7%
Rent to Value Ratio
Active
$679,786
6
bds
|
4
ba
|
3,900
sqft
|
built
2005
1810 Three Frks, San Antonio, TX 78258
$-1,712
Cash flow
-13.1%
Cash-on-Cash Return
2.7%
Cap rate
0.5%
Rent to Value Ratio
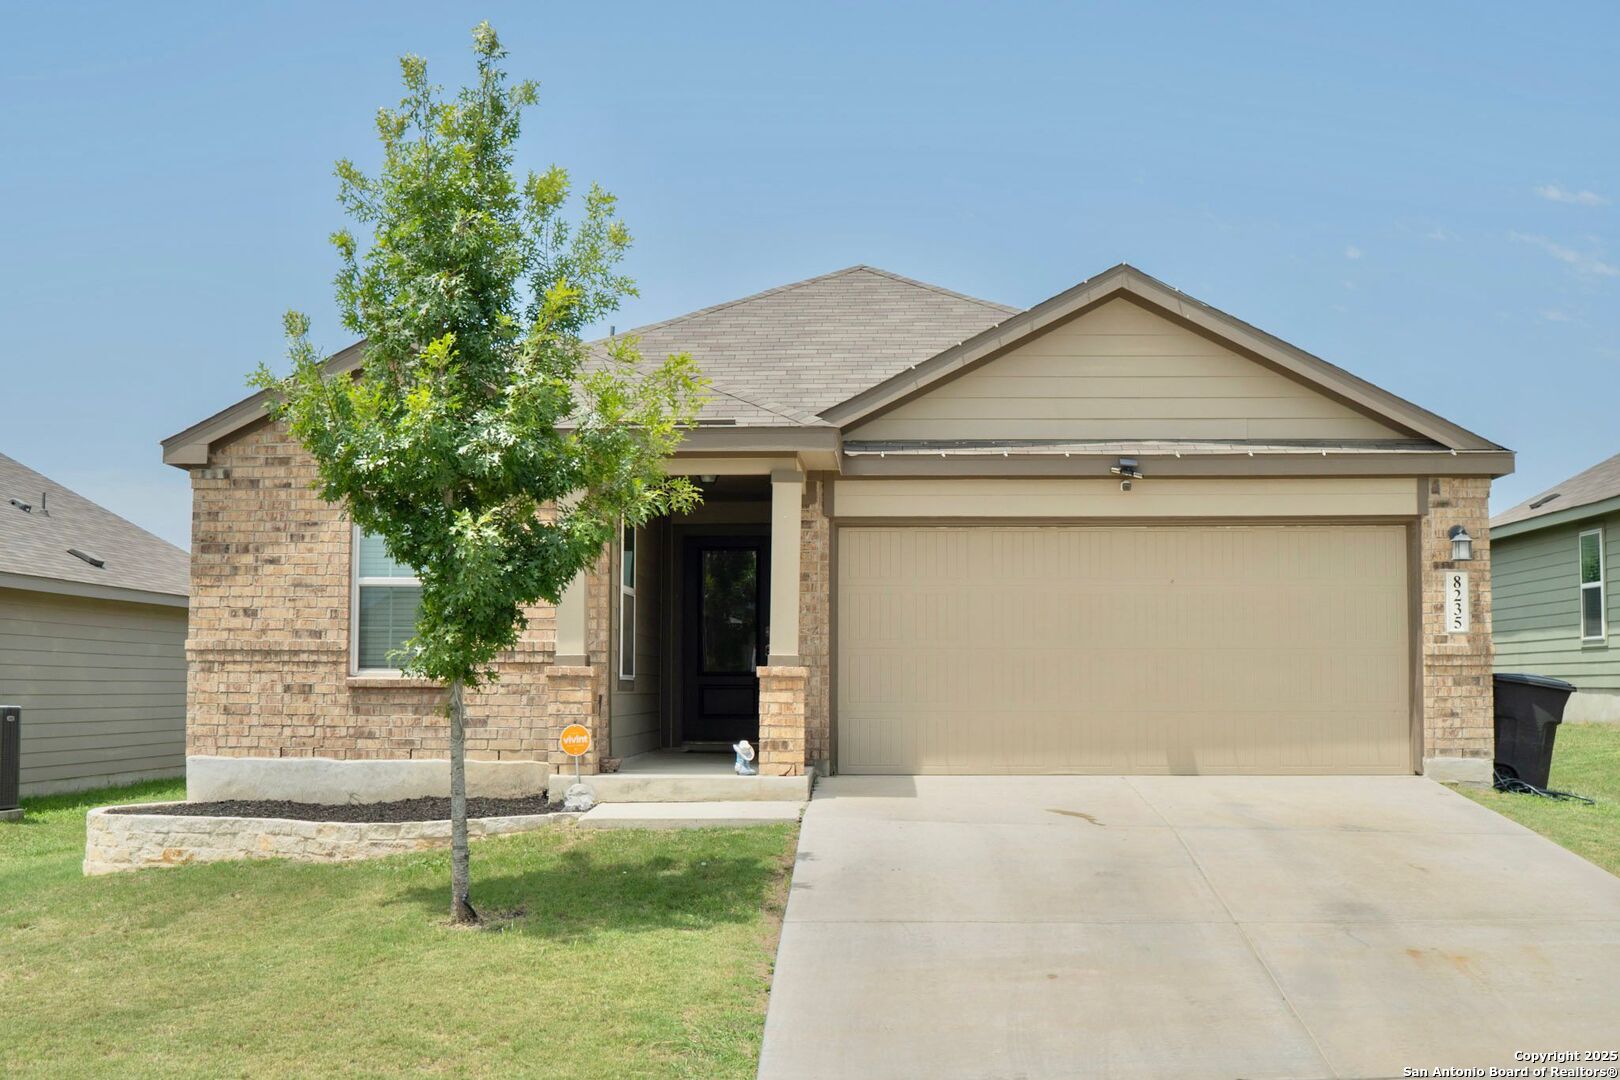
Active
$265,000
3
bds
|
2
ba
|
1,459
sqft
|
built
2020
8235 Glasgow Dr, San Antonio, TX 78223
$-547
Cash flow
-10.8%
Cash-on-Cash Return
3.2%
Cap rate
0.6%
Rent to Value Ratio
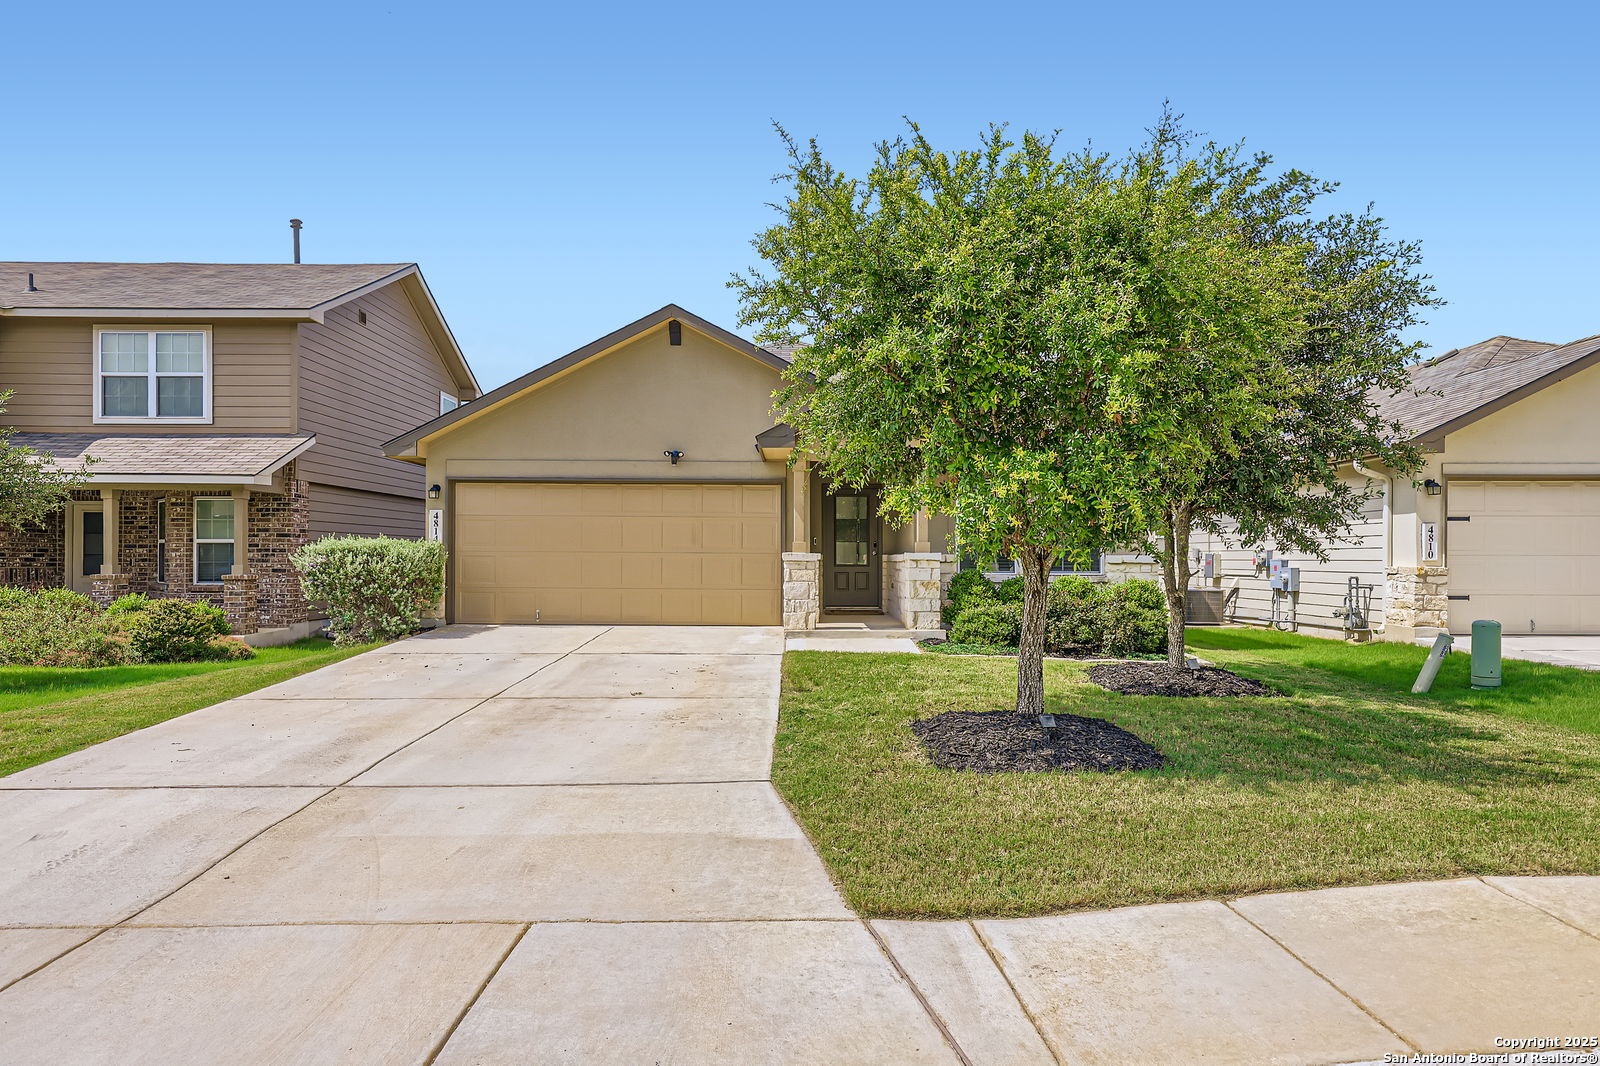
Active
$350,000
4
bds
|
2
ba
|
1,903
sqft
|
built
2019
4814 Forward Swing, San Antonio, TX 78261
$-769
Cash flow
-11.5%
Cash-on-Cash Return
3.0%
Cap rate
0.6%
Rent to Value Ratio
Active
$150,000
2
bds
|
2
ba
|
1,200
sqft
|
built
1982
5359 Fredericksburg Rd, San Antonio, TX 78229
$-320
Cash flow
-11.1%
Cash-on-Cash Return
3.1%
Cap rate
0.9%
Rent to Value Ratio
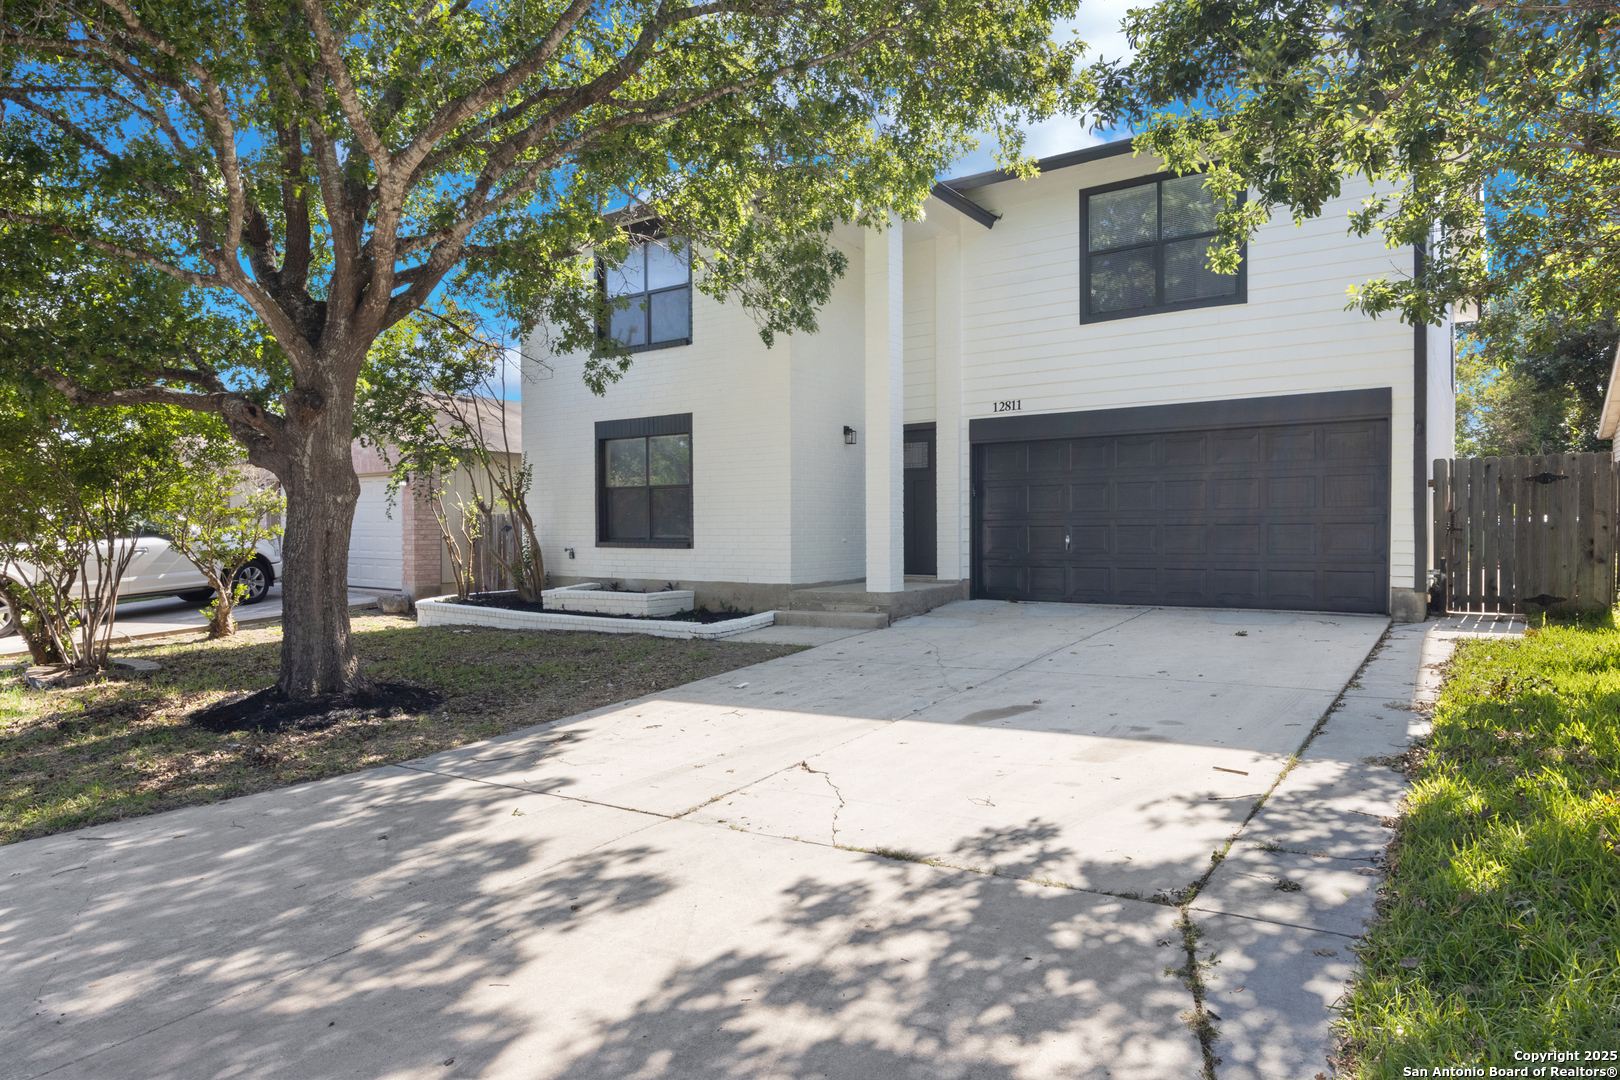
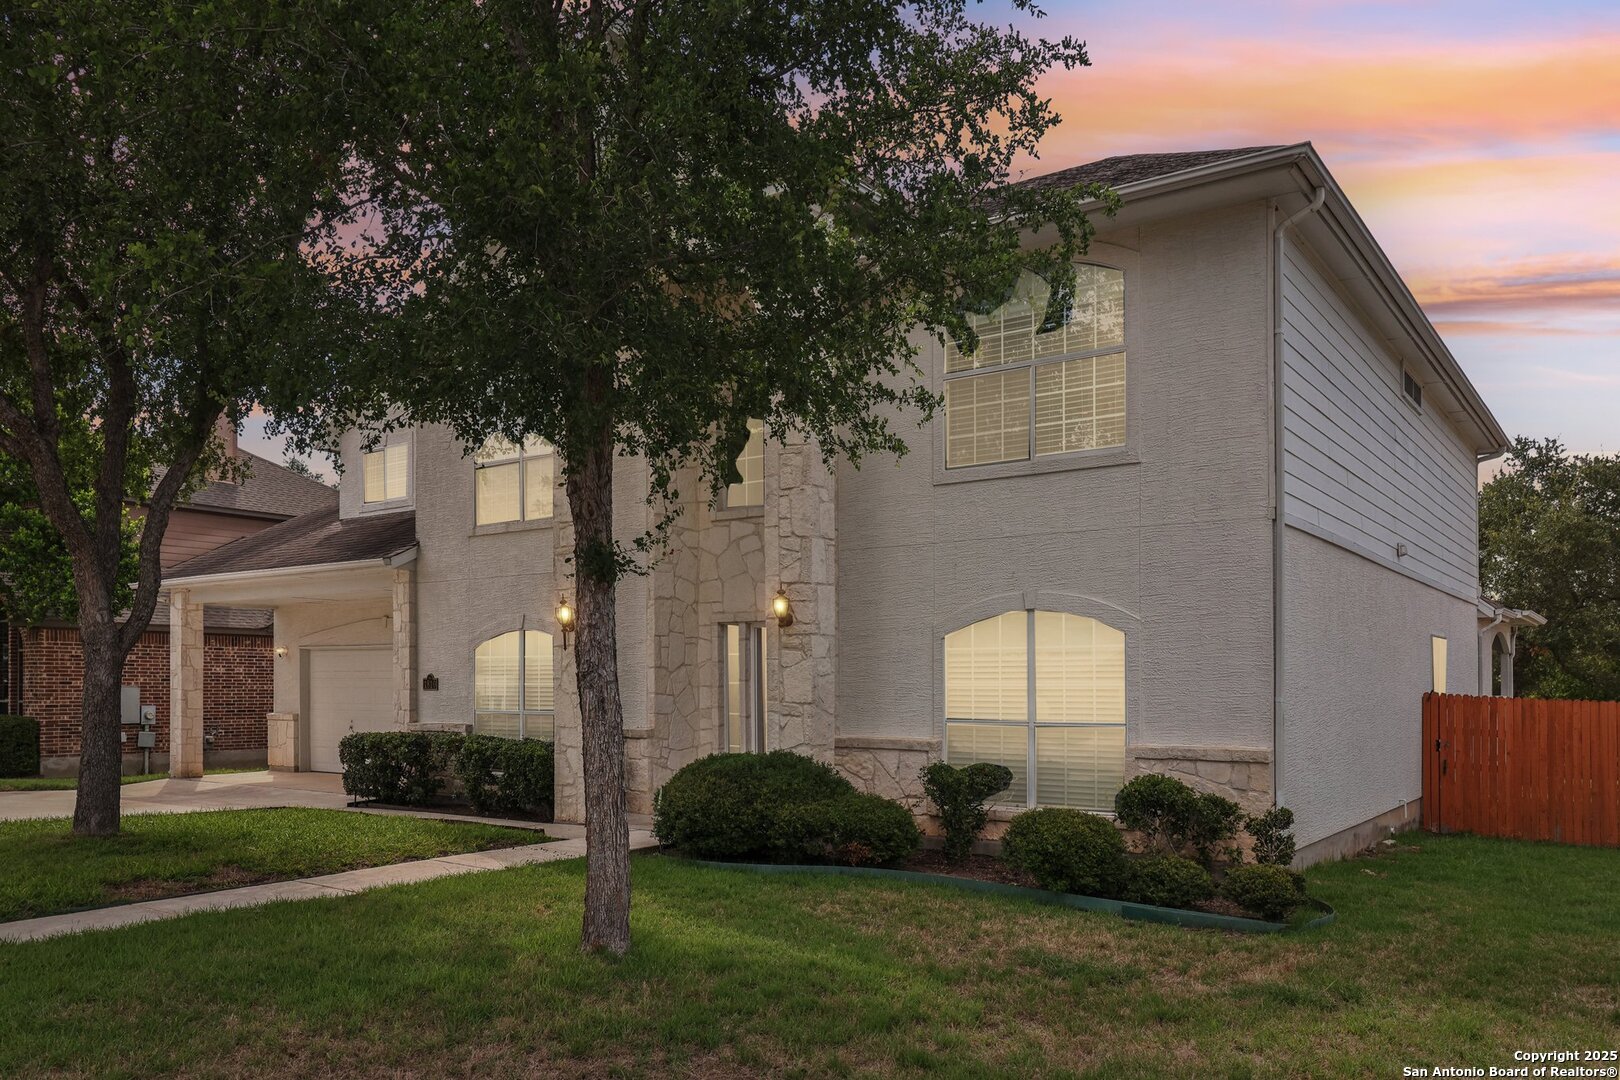
Active
$349,000
4
bds
|
3
ba
|
2,958
sqft
|
built
1994
12811 Hunting Hawk, San Antonio, TX 78249
$-783
Cash flow
-11.7%
Cash-on-Cash Return
3.0%
Cap rate
0.7%
Rent to Value Ratio
Active
$320,000
3
bds
|
3
ba
|
2,110
sqft
|
built
2000
3607 Mill Meadow Dr, San Antonio, TX 78247
$-729
Cash flow
-11.9%
Cash-on-Cash Return
2.9%
Cap rate
0.7%
Rent to Value Ratio
Active
$285,000
3
bds
|
2
ba
|
1,400
sqft
|
built
1969
5703 Charlie Chan Dr, San Antonio, TX 78240
$-554
Cash flow
-10.1%
Cash-on-Cash Return
3.3%
Cap rate
0.6%
Rent to Value Ratio