San Antonio, TX Investment Properties for Sale
Browse homes for sale and investment properties in San Antonio, TX. Refine your search by price, property type, or more.
Best cash flowing properties in San Antonio, TX
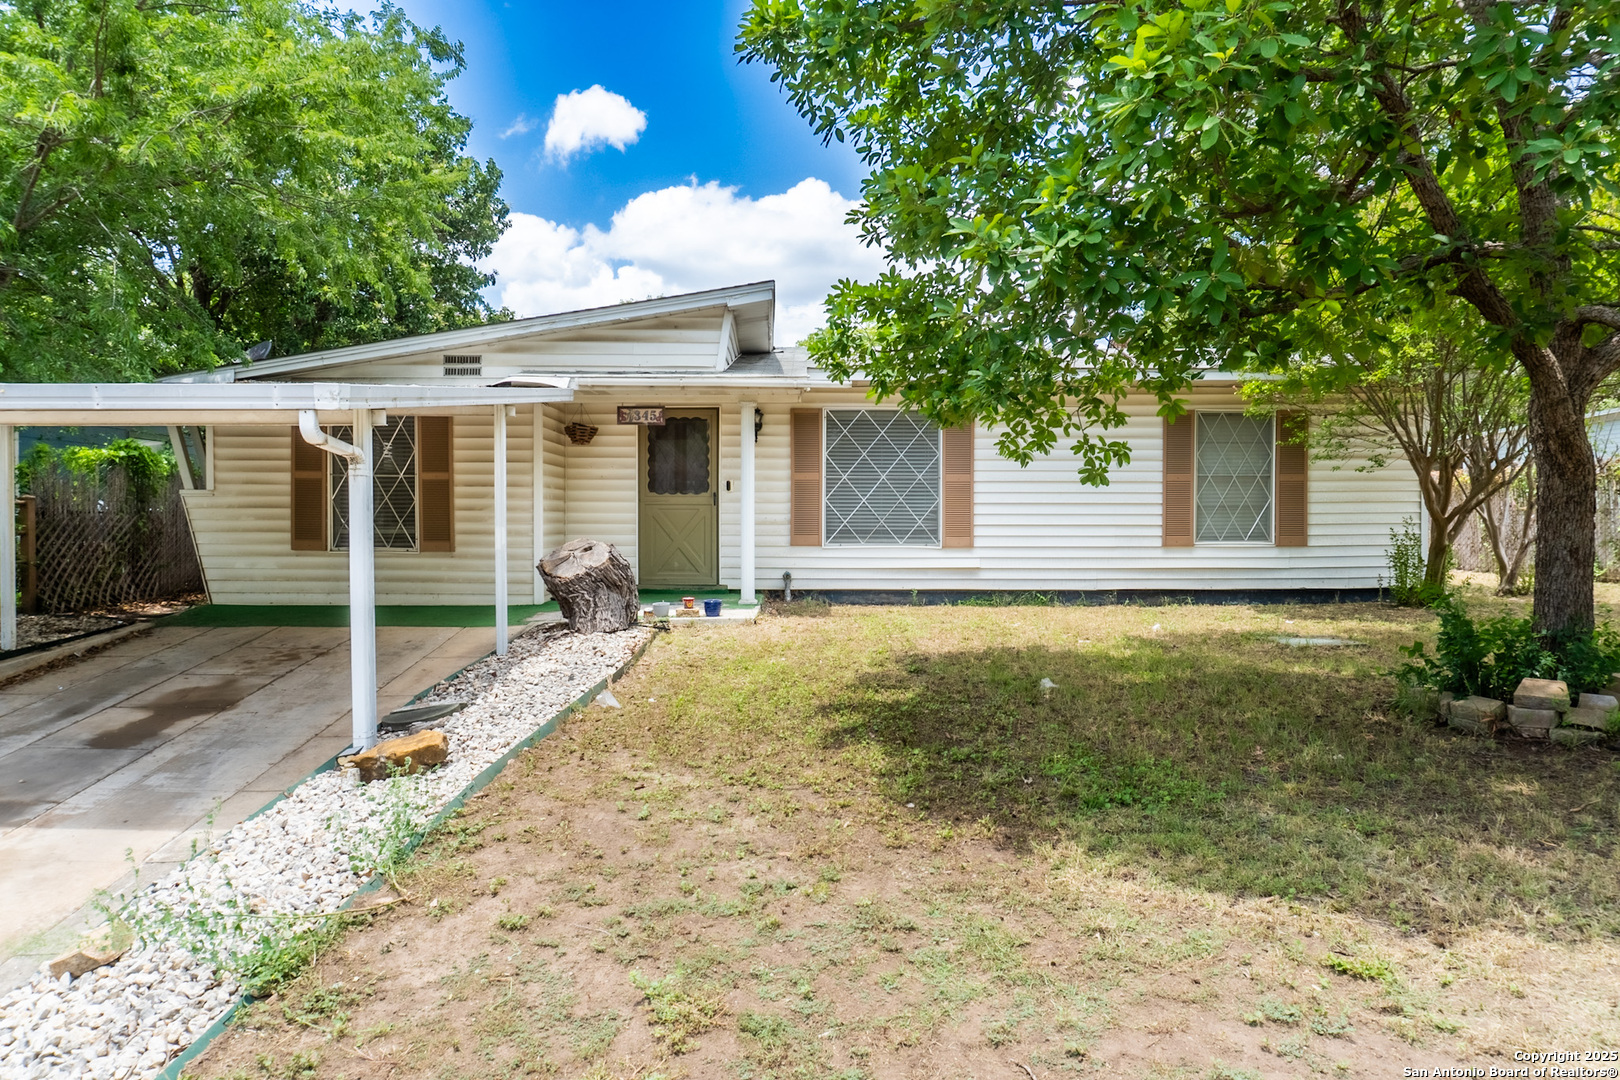
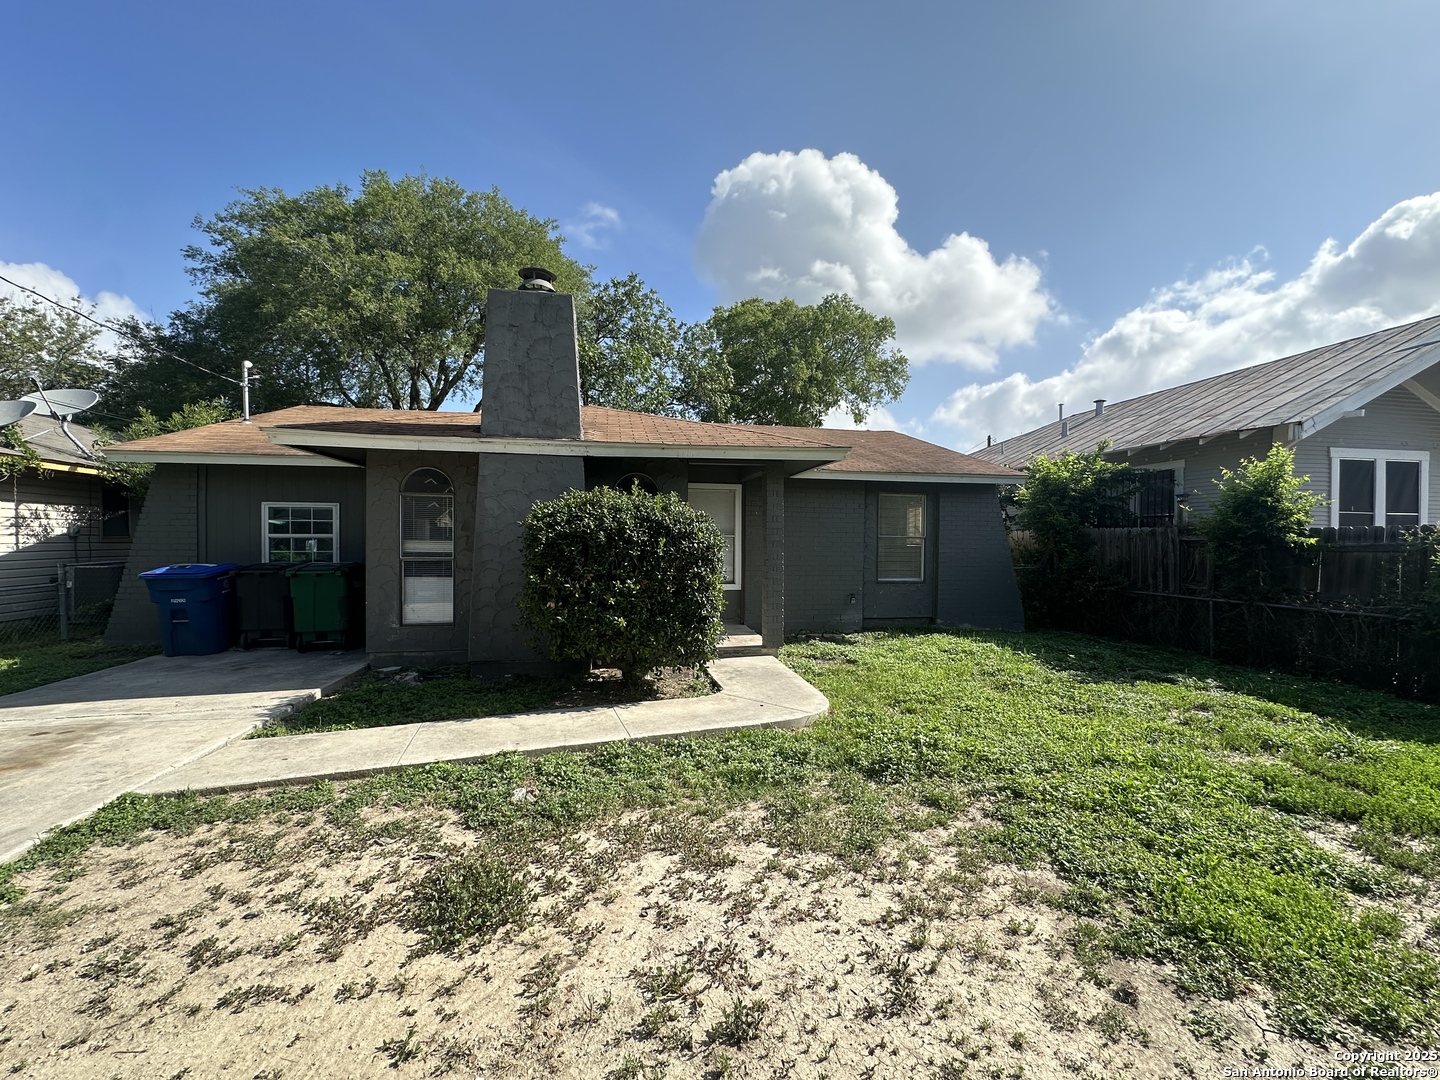
Active
$165,000
2
bds
|
1
ba
|
1,032
sqft
|
built
1951
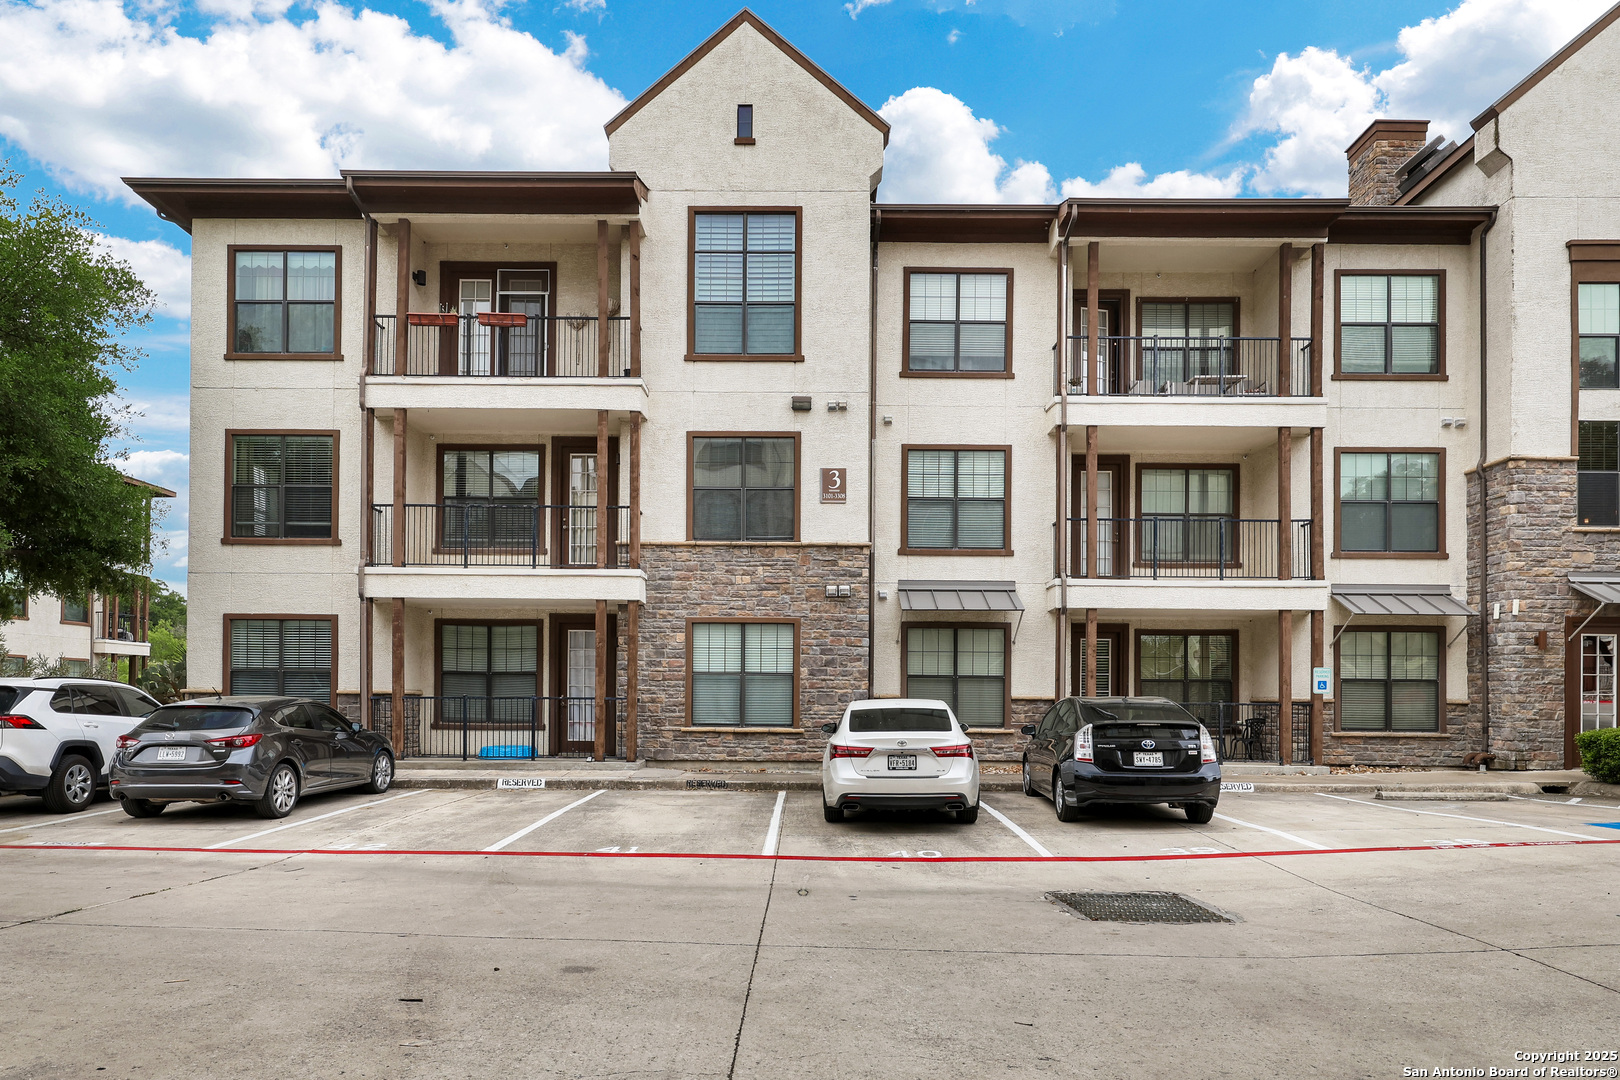
345 Shelburn Dr, San Antonio, TX 78220
$-223
Cash flow
-7.1%
Cash-on-Cash Return
4.7%
Cap rate
0.8%
Rent to Value Ratio
Active
$269,900
3
bds
|
3
ba
|
1,600
sqft
|
built
1983
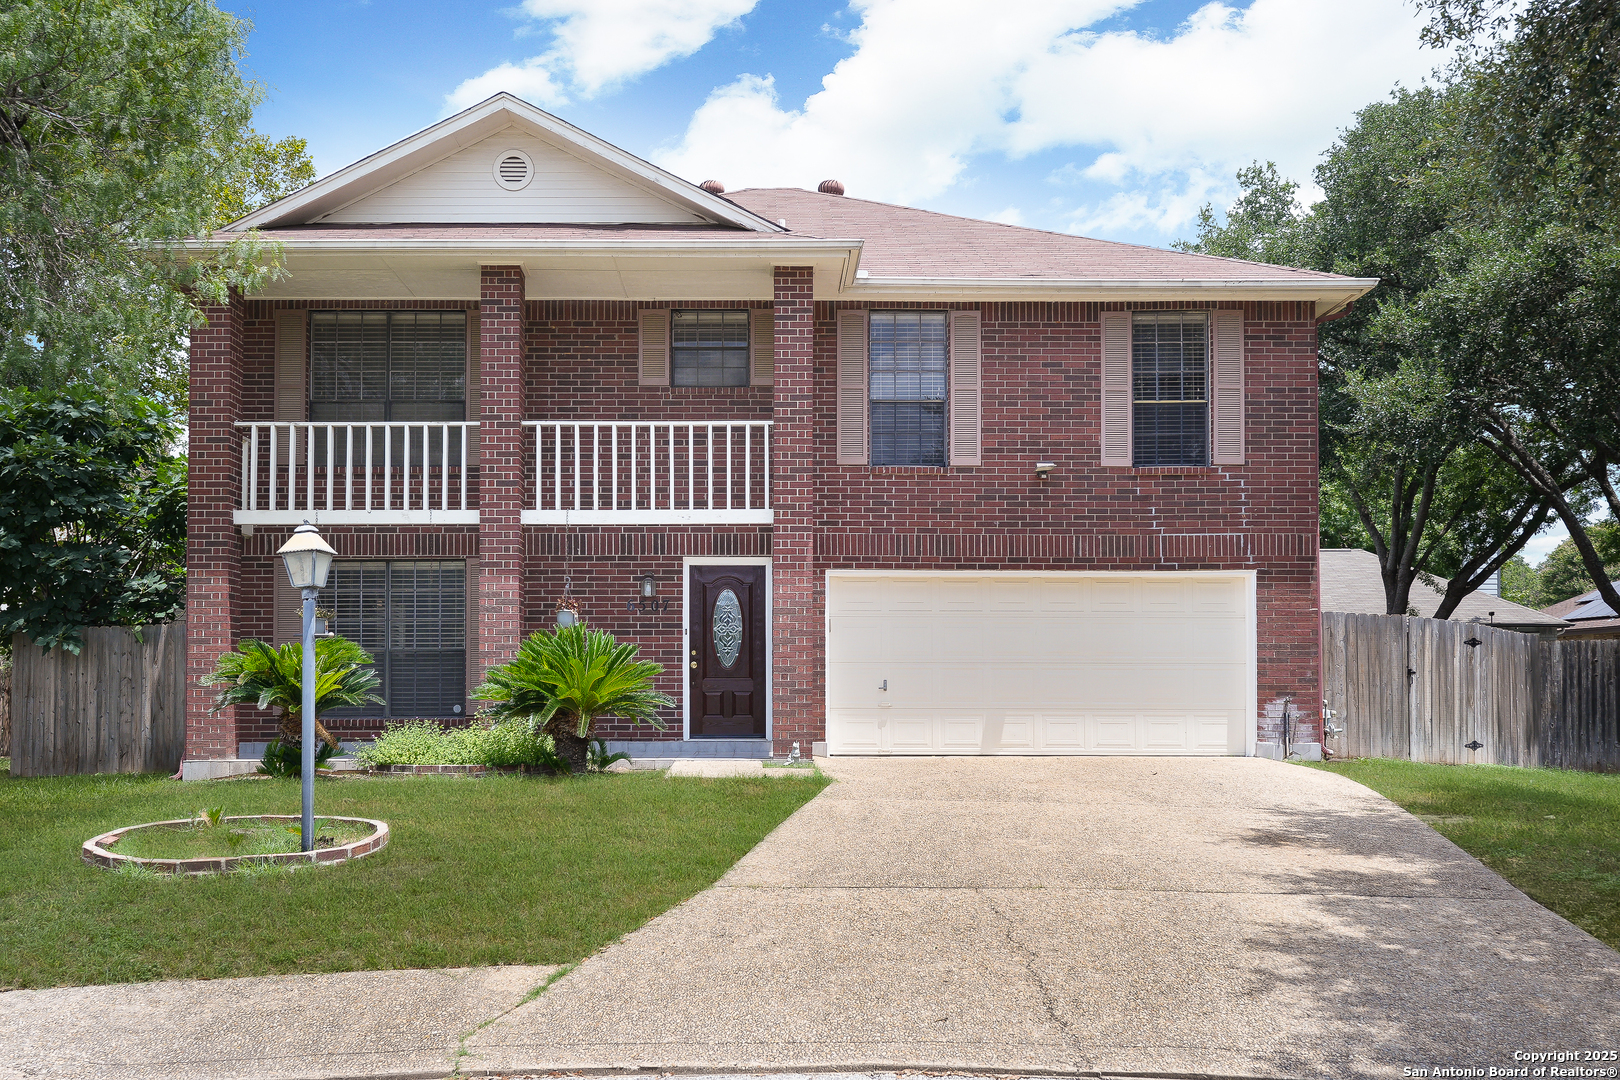
9814 Broad Forest St, San Antonio, TX 78250
$-278
Cash flow
-5.4%
Cash-on-Cash Return
5.0%
Cap rate
0.9%
Rent to Value Ratio
5,878 out of 6,167 properties for sale in San Antonio, TX
Limited Results Shown
Create a free account, or log in to reveal all property listings and enjoy the complete experience.
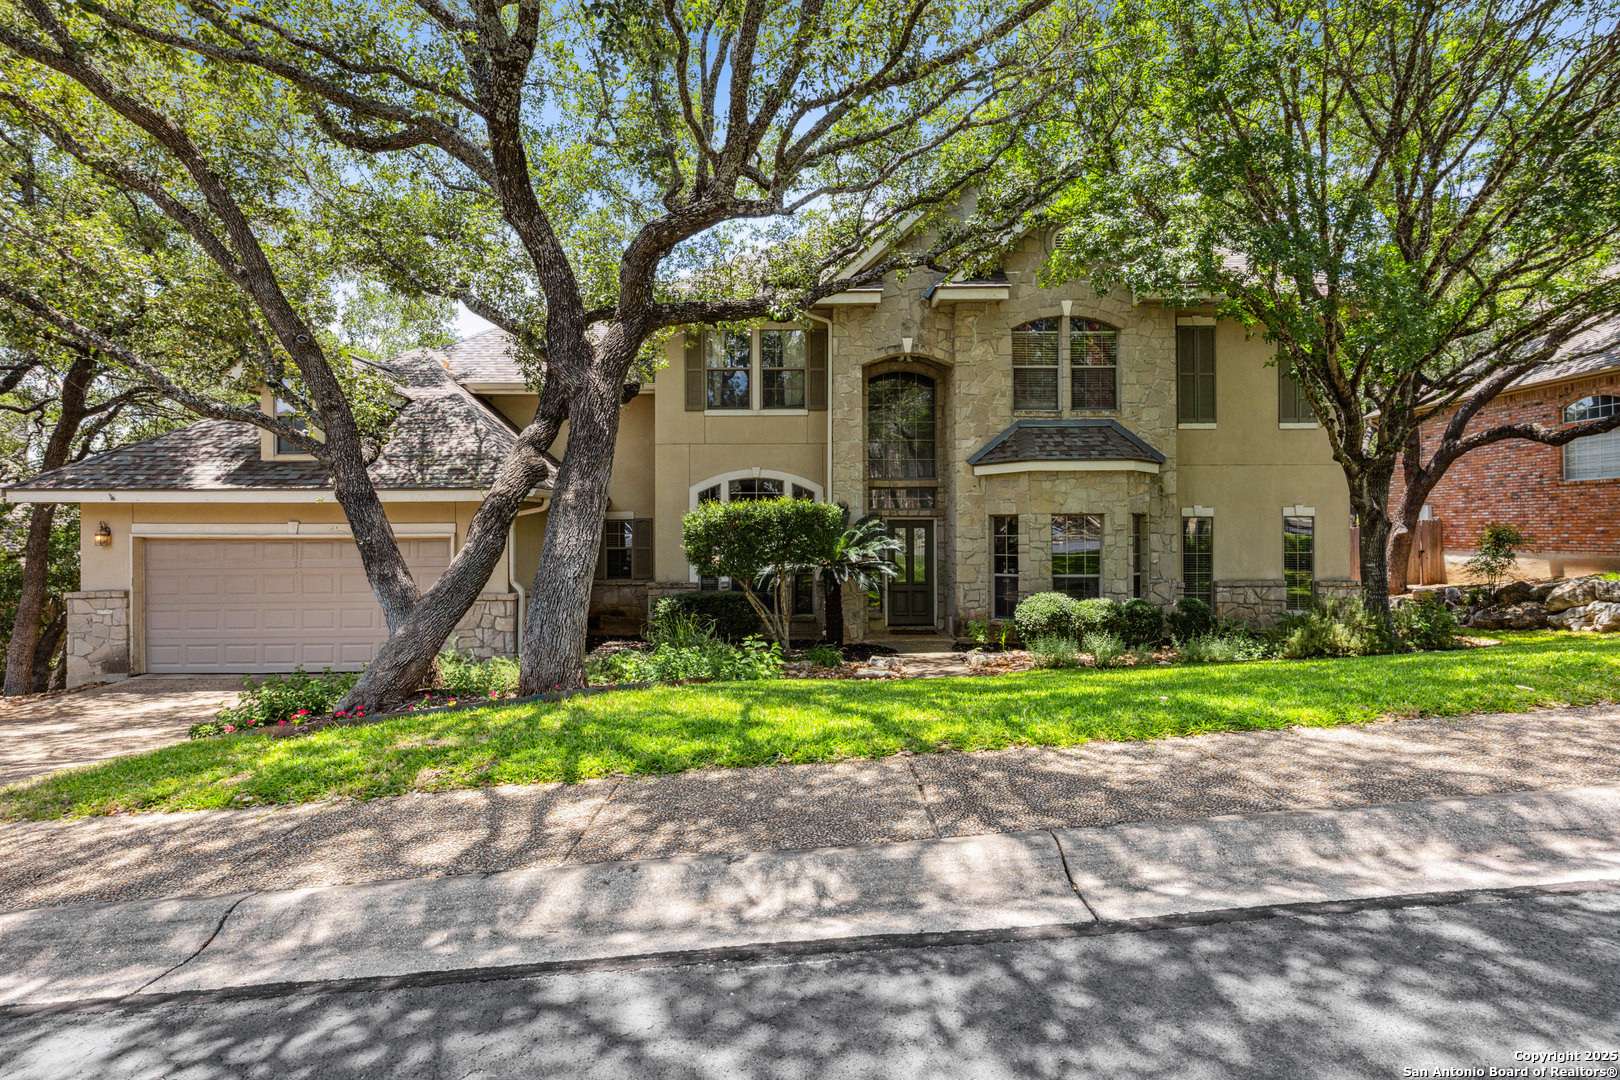
Active
$548,000
3
bds
|
3
ba
|
2,852
sqft
|
built
2013
8126 Powderhorn Run, San Antonio, TX 78255
$-1,818
Cash flow
-17.3%
Cash-on-Cash Return
2.3%
Cap rate
0.5%
Rent to Value Ratio
Active
$269,900
3
bds
|
3
ba
|
1,600
sqft
|
built
1983
9814 Broad Forest St, San Antonio, TX 78250
$-278
Cash flow
-5.4%
Cash-on-Cash Return
5.0%
Cap rate
0.9%
Rent to Value Ratio
Active
$274,900
5
bds
|
3
ba
|
2,647
sqft
|
built
1984
9235 Lasswell, San Antonio, TX 78211
$-581
Cash flow
-11.0%
Cash-on-Cash Return
3.7%
Cap rate
0.8%
Rent to Value Ratio
Active
$500,000
3
bds
|
3
ba
|
2,110
sqft
|
built
2020
8619 Glass Gem Dr, San Antonio, TX 78249
$-1,611
Cash flow
-16.8%
Cash-on-Cash Return
2.4%
Cap rate
0.6%
Rent to Value Ratio
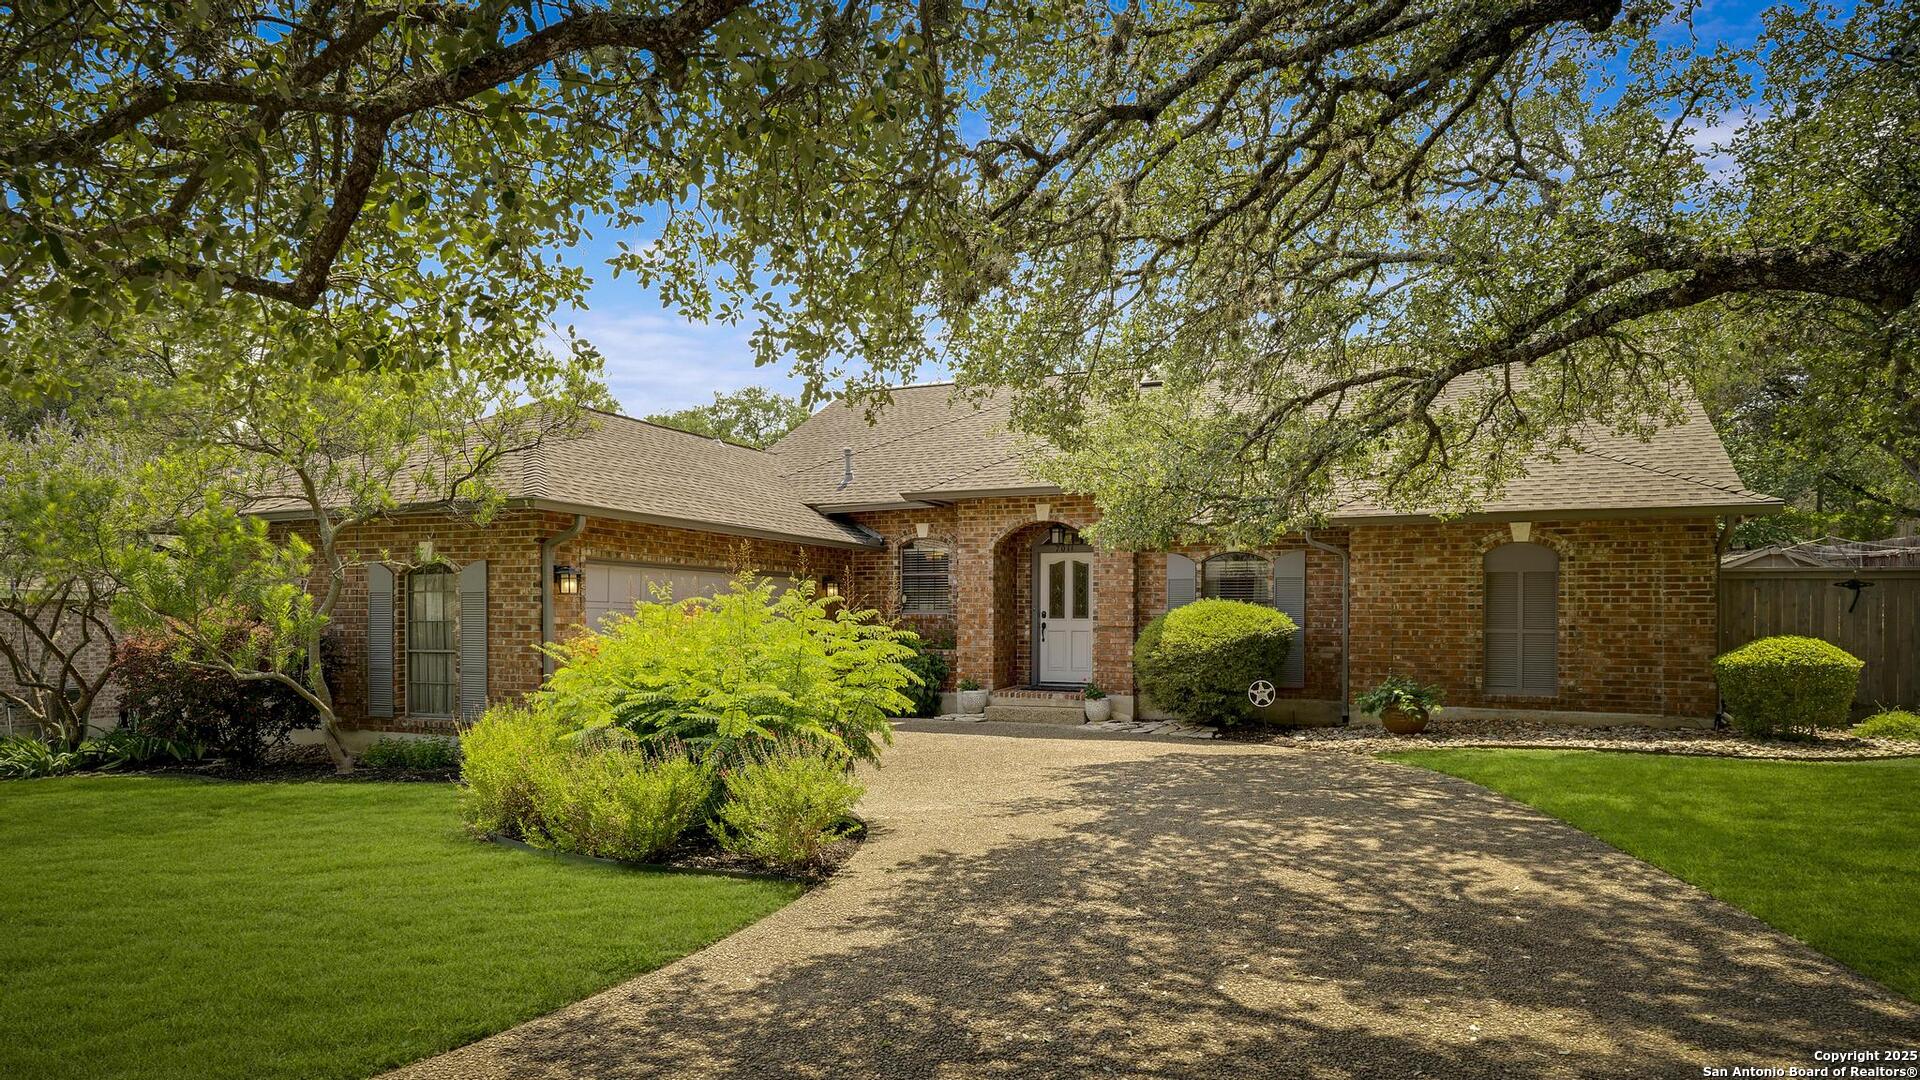
Active under contract
$475,000
4
bds
|
3
ba
|
2,934
sqft
|
built
1986
8427 Chesham, San Antonio, TX 78254
$-1,766
Cash flow
-19.4%
Cash-on-Cash Return
1.8%
Cap rate
0.4%
Rent to Value Ratio
Active
$275,000
3
bds
|
2
ba
|
1,467
sqft
|
built
1980
14414 Ledgewood St, San Antonio, TX 78233
$-860
Cash flow
-16.3%
Cash-on-Cash Return
2.5%
Cap rate
0.6%
Rent to Value Ratio
Active
$315,000
3
bds
|
3
ba
|
1,481
sqft
|
built
1984
2154 Pecan Hollow Dr, San Antonio, TX 78232
$-879
Cash flow
-14.6%
Cash-on-Cash Return
2.9%
Cap rate
0.6%
Rent to Value Ratio
Active
$309,000
4
bds
|
2
ba
|
1,703
sqft
|
built
2020
13118 Stretto Note, San Antonio, TX 78252
$-784
Cash flow
-13.2%
Cash-on-Cash Return
3.2%
Cap rate
0.6%
Rent to Value Ratio
Active
$424,000
4
bds
|
3
ba
|
2,544
sqft
|
built
2022
12933 Lilly Pass, San Antonio, TX 78254
$-1,078
Cash flow
-13.3%
Cash-on-Cash Return
3.2%
Cap rate
0.6%
Rent to Value Ratio
Active
$995,000
3
bds
|
3
ba
|
2,588
sqft
|
built
1989
43 Longsford, San Antonio, TX 78209
$-4,204
Cash flow
-22.0%
Cash-on-Cash Return
1.2%
Cap rate
0.4%
Rent to Value Ratio
Active
$200,000
3
bds
|
3
ba
|
1,645
sqft
|
built
1986
5955 Catalina Sunrise Dr, San Antonio, TX 78244
$-354
Cash flow
-9.2%
Cash-on-Cash Return
4.2%
Cap rate
0.8%
Rent to Value Ratio
Active
$773,599
3
bds
|
4
ba
|
3,021
sqft
|
built
2022
23407 Grande Vis, San Antonio, TX 78261
$-3,269
Cash flow
-22.0%
Cash-on-Cash Return
1.2%
Cap rate
0.5%
Rent to Value Ratio
Active
$270,000
3
bds
|
2
ba
|
2,313
sqft
|
built
2004
4122 Chinkapin Oak, San Antonio, TX 78223
$-565
Cash flow
-10.9%
Cash-on-Cash Return
3.8%
Cap rate
0.7%
Rent to Value Ratio
Active
$314,999
4
bds
|
3
ba
|
2,857
sqft
|
built
2000
506 Terra Cotta, San Antonio, TX 78253
$-747
Cash flow
-12.4%
Cash-on-Cash Return
3.4%
Cap rate
0.6%
Rent to Value Ratio
Active
$389,900
4
bds
|
4
ba
|
3,013
sqft
|
built
2004
12542 Skyline Mesa, San Antonio, TX 78253
$-1,034
Cash flow
-13.8%
Cash-on-Cash Return
3.1%
Cap rate
0.6%
Rent to Value Ratio
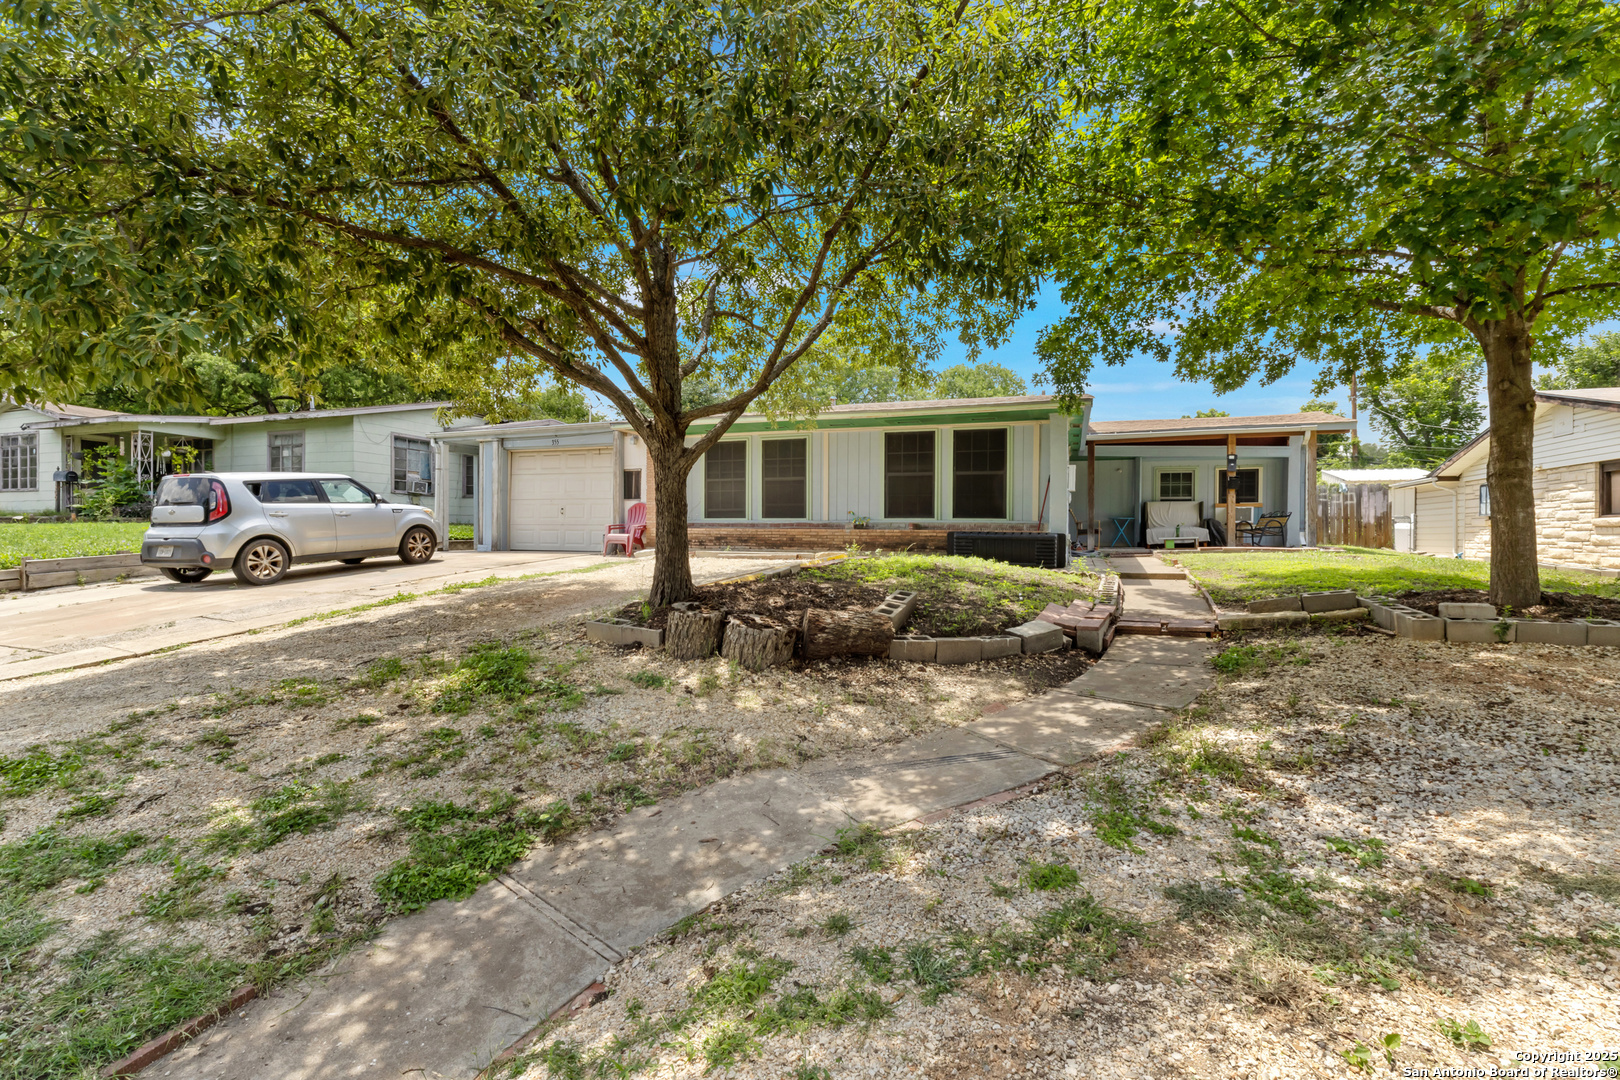
Active
$190,000
4
bds
|
1
ba
|
1,152
sqft
|
built
1973
243 Smallwood Dr, San Antonio, TX 78210
$-285
Cash flow
-7.8%
Cash-on-Cash Return
4.5%
Cap rate
0.7%
Rent to Value Ratio
Active
$430,000
4
bds
|
3
ba
|
3,635
sqft
|
built
2006
4807 Bending Grv, San Antonio, TX 78259
$-1,056
Cash flow
-12.8%
Cash-on-Cash Return
3.3%
Cap rate
0.7%
Rent to Value Ratio
Active
$319,900
3
bds
|
3
ba
|
2,390
sqft
|
built
2005
11023 Falling Water, San Antonio, TX 78249
$-906
Cash flow
-14.8%
Cash-on-Cash Return
2.9%
Cap rate
0.6%
Rent to Value Ratio
Active
$195,000
3
bds
|
1
ba
|
1,208
sqft
|
built
1990
5701 Alnwick St, San Antonio, TX 78228
$-387
Cash flow
-10.4%
Cash-on-Cash Return
3.9%
Cap rate
0.7%
Rent to Value Ratio

Active
$205,000
3
bds
|
2
ba
|
1,025
sqft
|
built
1959
343 Goodhue Ave, San Antonio, TX 78218
$-340
Cash flow
-8.7%
Cash-on-Cash Return
4.3%
Cap rate
0.8%
Rent to Value Ratio

Active
$700,000
7
bds
|
0
ba
|
5,679
sqft
|
built
2012
3050 Cross Trail Rd, San Antonio, TX 78264
$-3,169
Cash flow
-23.6%
Cash-on-Cash Return
0.9%
Cap rate
0.4%
Rent to Value Ratio
Active
$625,000
4
bds
|
4
ba
|
3,531
sqft
|
built
1998
18319 Apache Springs Dr, San Antonio, TX 78259
$-2,448
Cash flow
-20.4%
Cash-on-Cash Return
1.6%
Cap rate
0.5%
Rent to Value Ratio
Active
$524,890
3
bds
|
2
ba
|
2,159
sqft
|
built
1987
7011 Washita Way, San Antonio, TX 78256
$-1,697
Cash flow
-16.9%
Cash-on-Cash Return
2.4%
Cap rate
0.5%
Rent to Value Ratio
Active
$240,000
4
bds
|
3
ba
|
1,604
sqft
|
built
1951
355 Altgelt Ave, San Antonio, TX 78201
$-641
Cash flow
-13.9%
Cash-on-Cash Return
3.1%
Cap rate
0.7%
Rent to Value Ratio
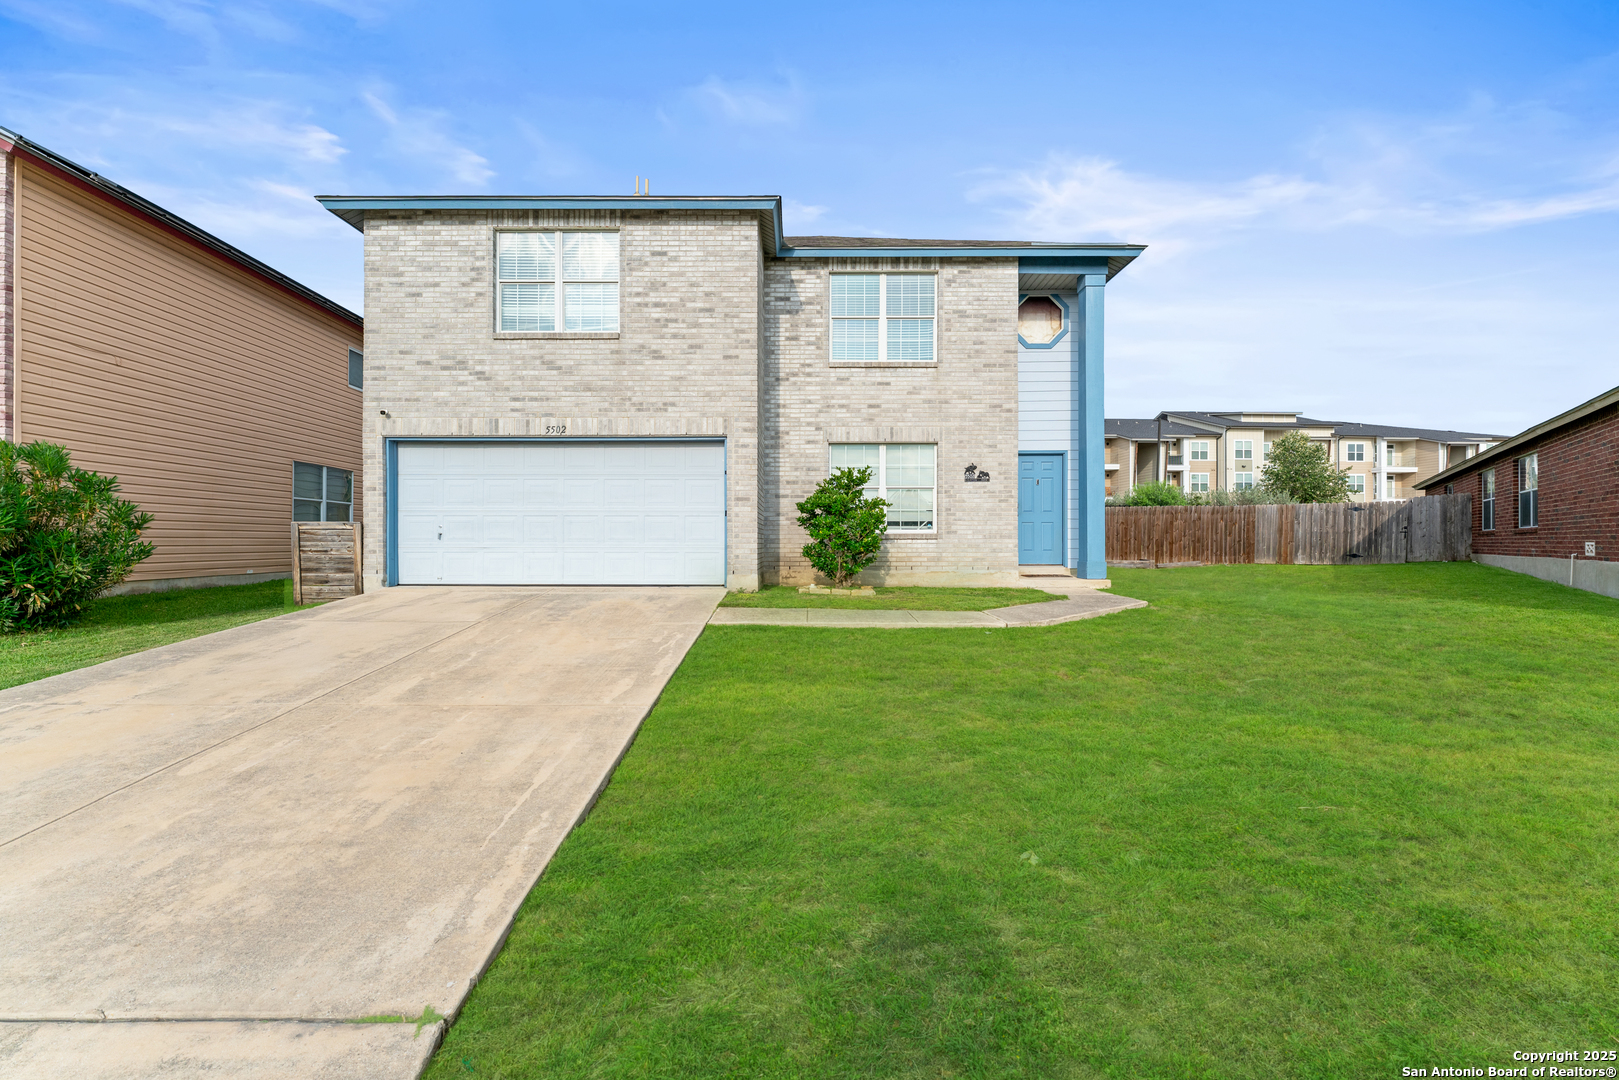
Active
$258,900
3
bds
|
3
ba
|
2,144
sqft
|
built
2003
5502 Burton Farm, San Antonio, TX 78244
$-584
Cash flow
-11.8%
Cash-on-Cash Return
3.6%
Cap rate
0.7%
Rent to Value Ratio
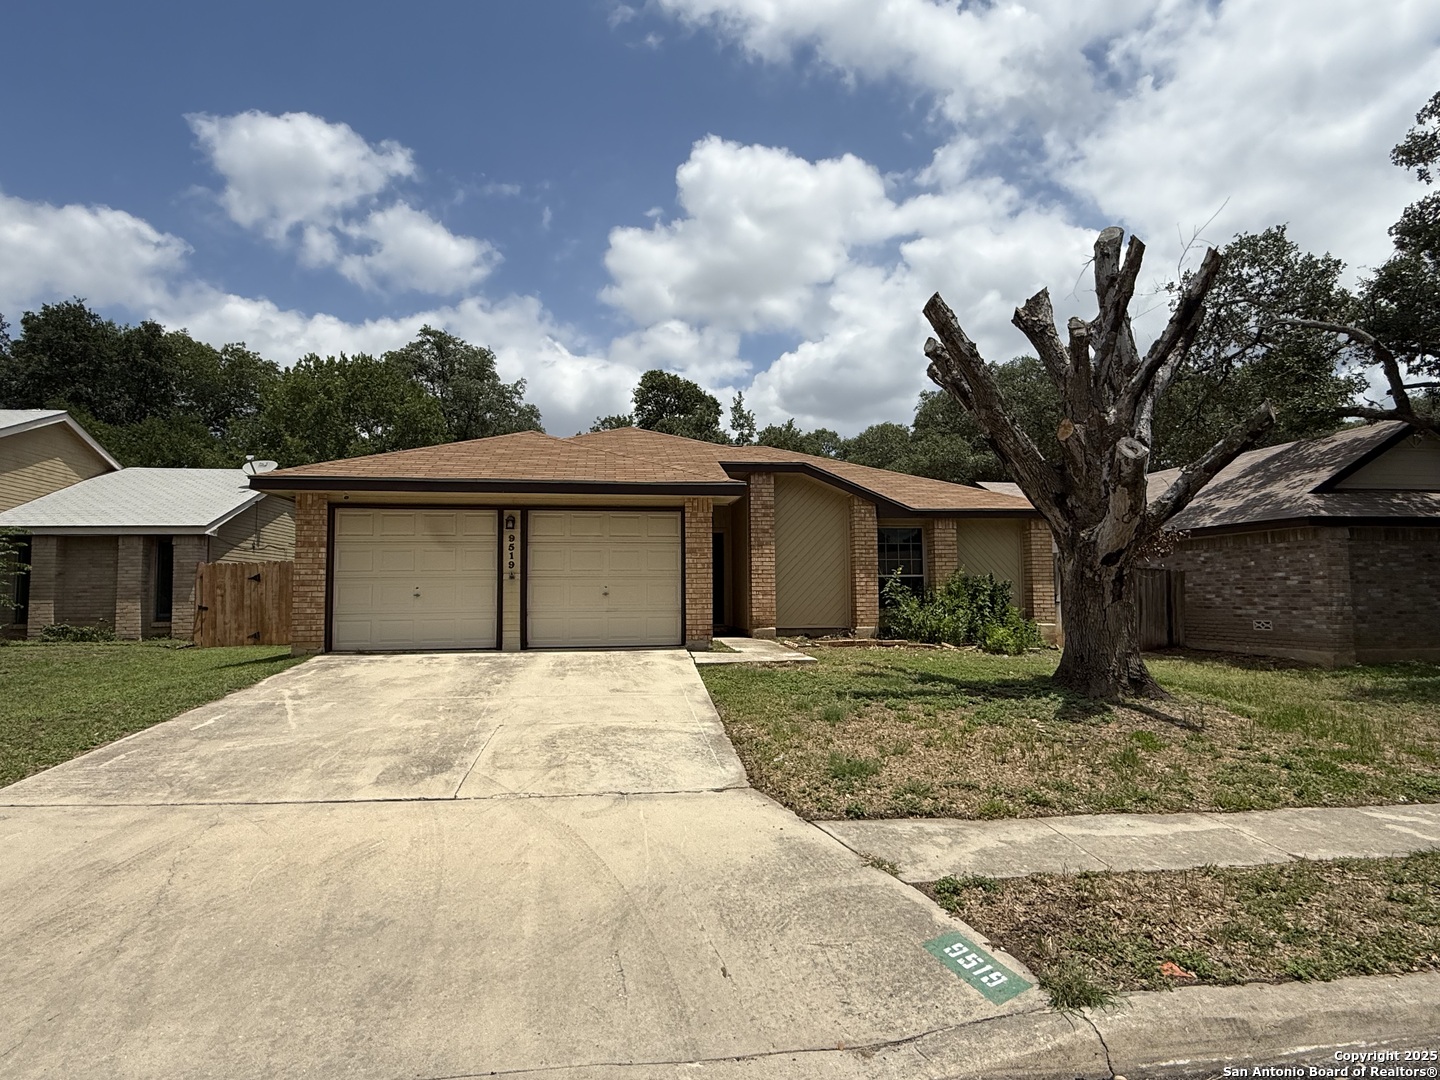
Active
$250,000
3
bds
|
2
ba
|
1,525
sqft
|
built
1983
9519 Brook Grn, San Antonio, TX 78250
$-513
Cash flow
-10.7%
Cash-on-Cash Return
3.8%
Cap rate
0.7%
Rent to Value Ratio
Active
$440,000
4
bds
|
3
ba
|
2,191
sqft
|
built
1998
535 Oracle Dr, San Antonio, TX 78260
$-871
Cash flow
-10.3%
Cash-on-Cash Return
3.9%
Cap rate
0.6%
Rent to Value Ratio
Active
$600,000
4
bds
|
3
ba
|
2,408
sqft
|
built
1979
327 Stonewood Dr, San Antonio, TX 78216
$-2,198
Cash flow
-19.1%
Cash-on-Cash Return
1.9%
Cap rate
0.5%
Rent to Value Ratio
Active
$467,500
4
bds
|
4
ba
|
3,156
sqft
|
built
1997
12216 Farview Ln, San Antonio, TX 78216
$-1,449
Cash flow
-16.2%
Cash-on-Cash Return
2.6%
Cap rate
0.6%
Rent to Value Ratio
Active
$530,000
4
bds
|
4
ba
|
3,100
sqft
|
built
2019
1959 Pillard Smt, San Antonio, TX 78245
$-1,586
Cash flow
-15.6%
Cash-on-Cash Return
2.7%
Cap rate
0.5%
Rent to Value Ratio
Active
$165,000
2
bds
|
1
ba
|
1,032
sqft
|
built
1951
345 Shelburn Dr, San Antonio, TX 78220
$-223
Cash flow
-7.1%
Cash-on-Cash Return
4.7%
Cap rate
0.8%
Rent to Value Ratio
Active
$305,000
3
bds
|
2
ba
|
1,429
sqft
|
built
2003
3934 Privet Pl, San Antonio, TX 78259
$-934
Cash flow
-16.0%
Cash-on-Cash Return
2.6%
Cap rate
0.6%
Rent to Value Ratio
Active
$775,000
3
bds
|
3
ba
|
1,786
sqft
|
built
2017
543 Leigh St, San Antonio, TX 78210
$-2,446
Cash flow
-16.5%
Cash-on-Cash Return
2.5%
Cap rate
0.5%
Rent to Value Ratio
Active
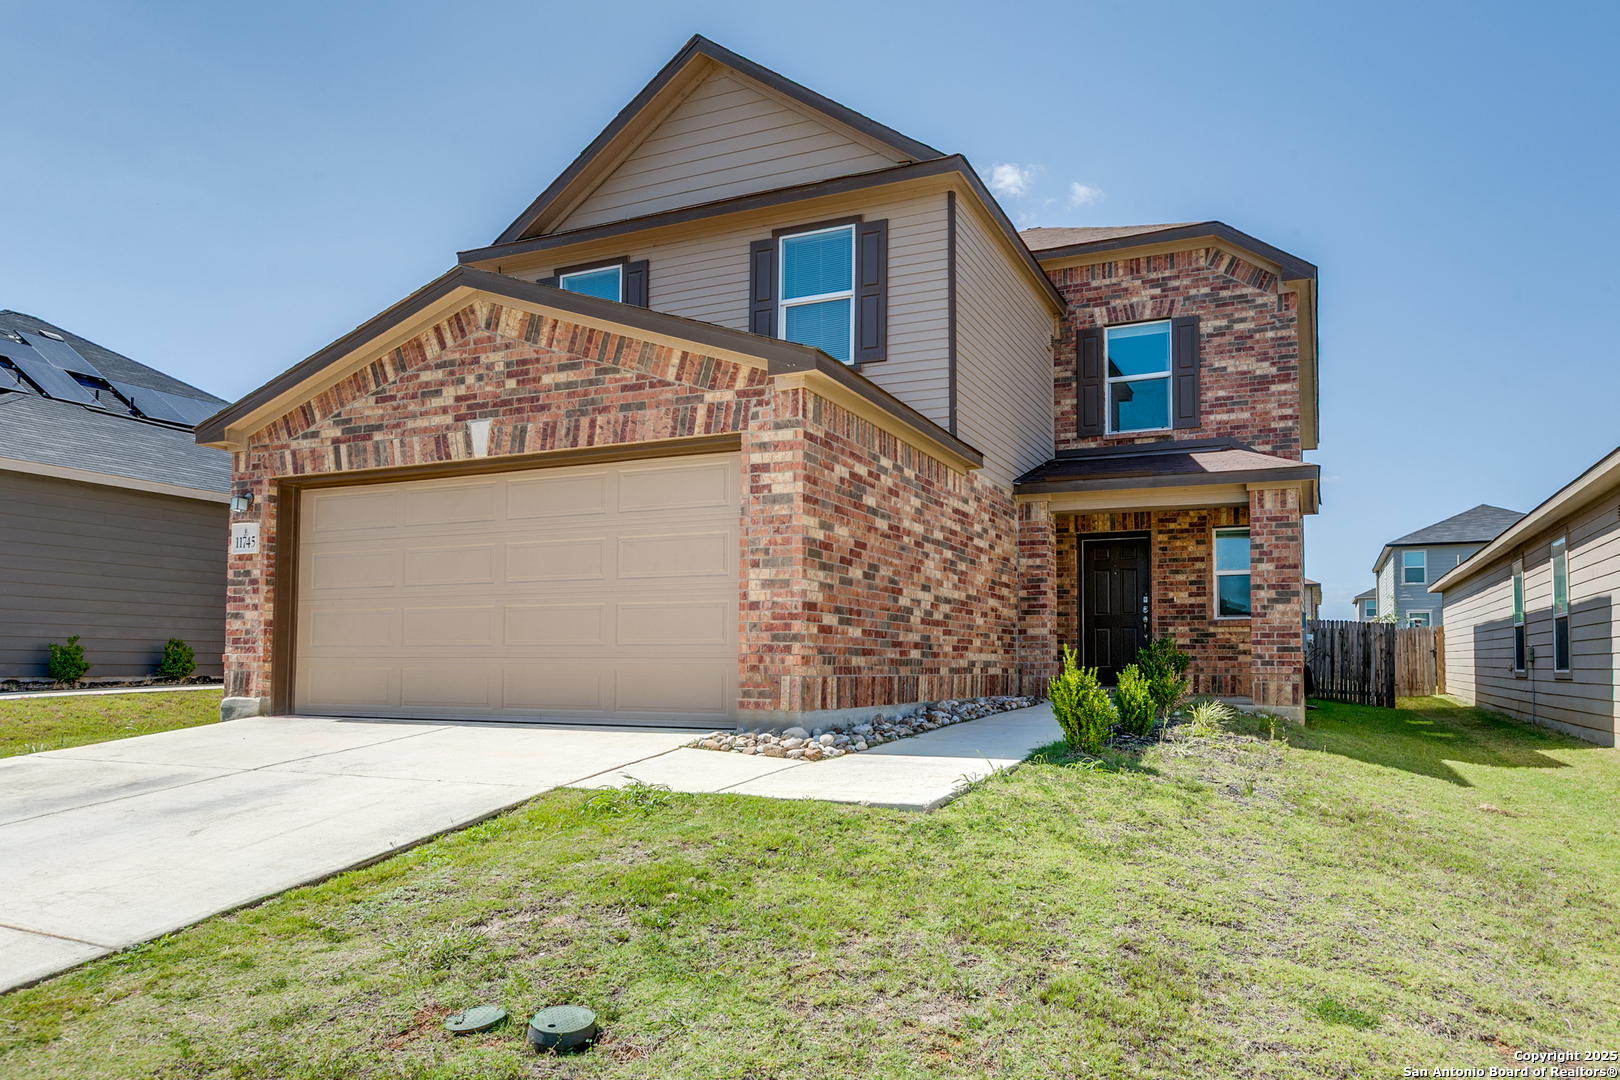
$340,000
4
bds
|
3
ba
|
2,244
sqft
|
built
2022
11745 Red Pheasant, San Antonio, TX 78245
$-1,008
Cash flow
-15.5%
Cash-on-Cash Return
2.7%
Cap rate
0.6%
Rent to Value Ratio
Active
$175,000
2
bds
|
2
ba
|
950
sqft
|
built
1985
8642 Fredericksburg Rd, San Antonio, TX 78240
$-656
Cash flow
-19.6%
Cash-on-Cash Return
1.8%
Cap rate
0.8%
Rent to Value Ratio
Active
$299,000
3
bds
|
3
ba
|
1,812
sqft
|
built
1989
7354 Clipper Oak Dr, San Antonio, TX 78249
$-886
Cash flow
-15.5%
Cash-on-Cash Return
2.7%
Cap rate
0.6%
Rent to Value Ratio
Active
$352,000
5
bds
|
3
ba
|
2,964
sqft
|
built
2005
6714 Carlsbad Rio, San Antonio, TX 78233
$-992
Cash flow
-14.7%
Cash-on-Cash Return
2.9%
Cap rate
0.6%
Rent to Value Ratio
Active under contract
$398,000
3
bds
|
2
ba
|
1,942
sqft
|
built
1994
5311 Auburn Way, San Antonio, TX 78249
$-1,384
Cash flow
-18.1%
Cash-on-Cash Return
2.1%
Cap rate
0.5%
Rent to Value Ratio
Active
$320,000
2
bds
|
2
ba
|
1,299
sqft
|
built
2006
7342 Oak Manor Dr, San Antonio, TX 78229
$-1,491
Cash flow
-24.3%
Cash-on-Cash Return
0.7%
Cap rate
0.5%
Rent to Value Ratio
Active under contract
$350,000
3
bds
|
3
ba
|
2,754
sqft
|
built
1991
6507 Lochglen, San Antonio, TX 78240
$-807
Cash flow
-12.0%
Cash-on-Cash Return
3.5%
Cap rate
0.7%
Rent to Value Ratio