San Antonio, TX Investment Properties for Sale
Browse homes for sale and investment properties in San Antonio, TX. Refine your search by price, property type, or more.
Best cash flowing properties in San Antonio, TX
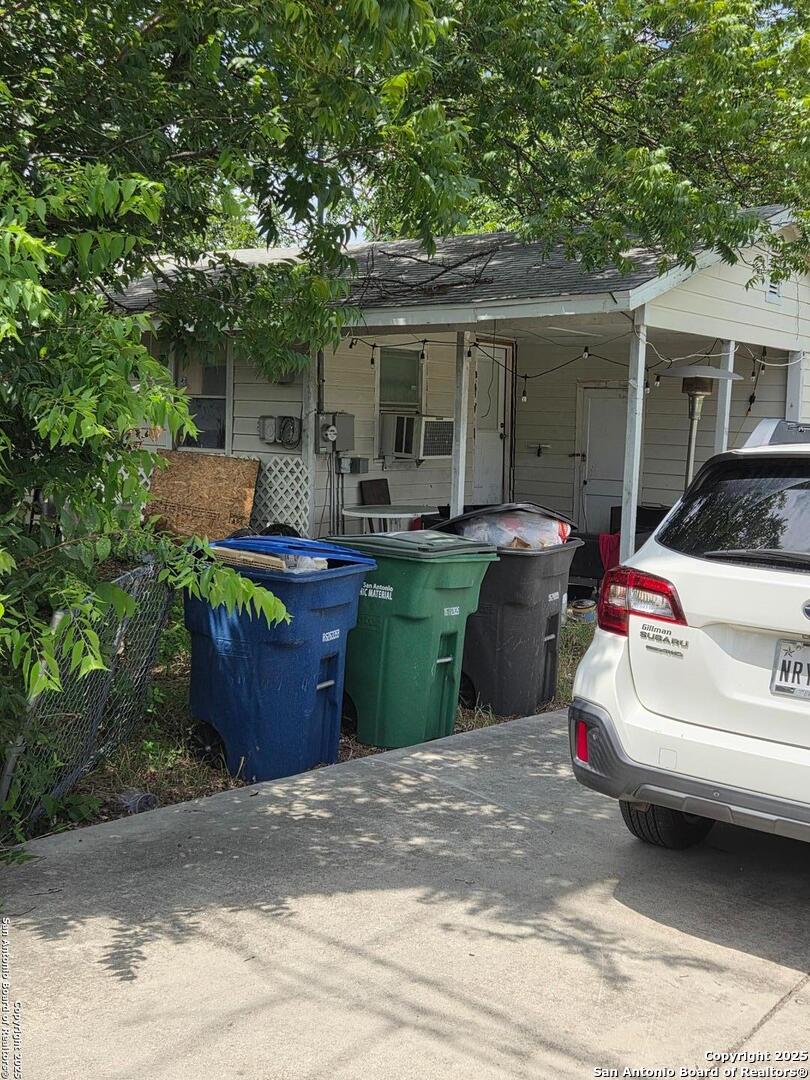
Pending
$95,000
3
bds
|
1
ba
|
912
sqft
|
built
1962
12823 Bell Dr, San Antonio, TX 78217
$283
Cash flow
15.5%
Cash-on-Cash Return
9.3%
Cap rate
1.5%
Rent to Value Ratio
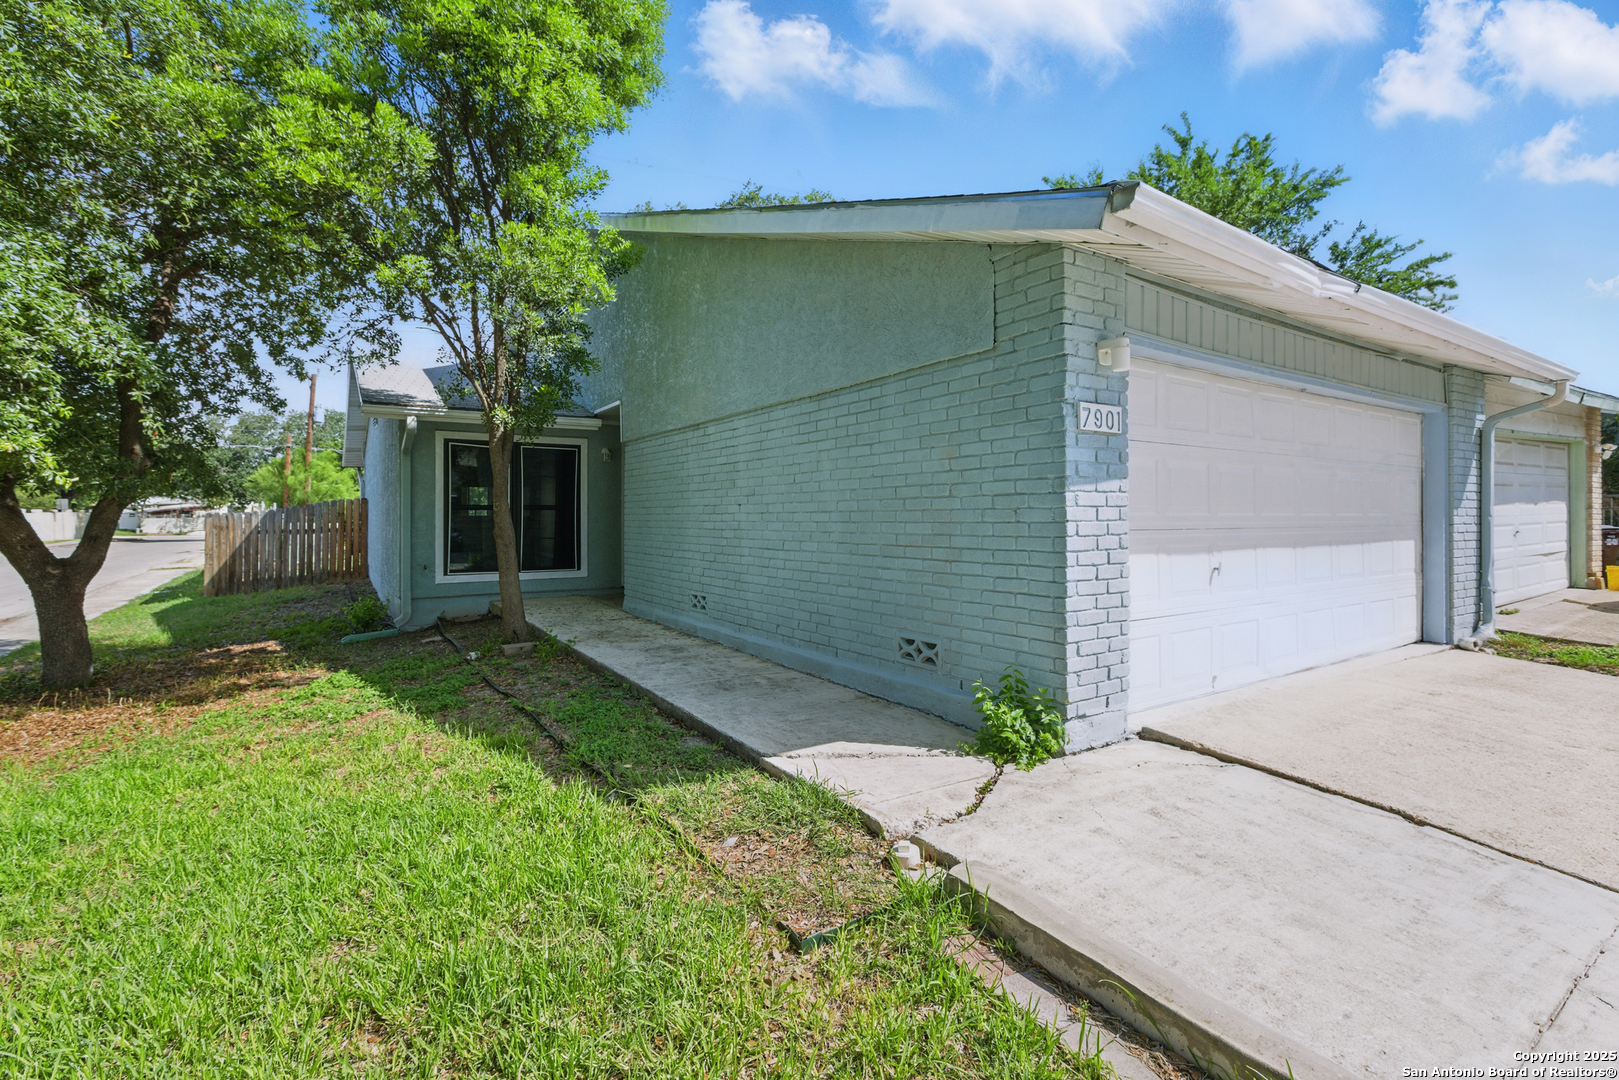
Active
$125,000
2
bds
|
2
ba
|
986
sqft
|
built
1981
7901 Broadwick, San Antonio, TX 78239
$115
Cash flow
4.8%
Cash-on-Cash Return
6.8%
Cap rate
1.0%
Rent to Value Ratio
5,861 out of 6,149 properties for sale in San Antonio, TX
Limited Results Shown
Create a free account, or log in to reveal all property listings and enjoy the complete experience.
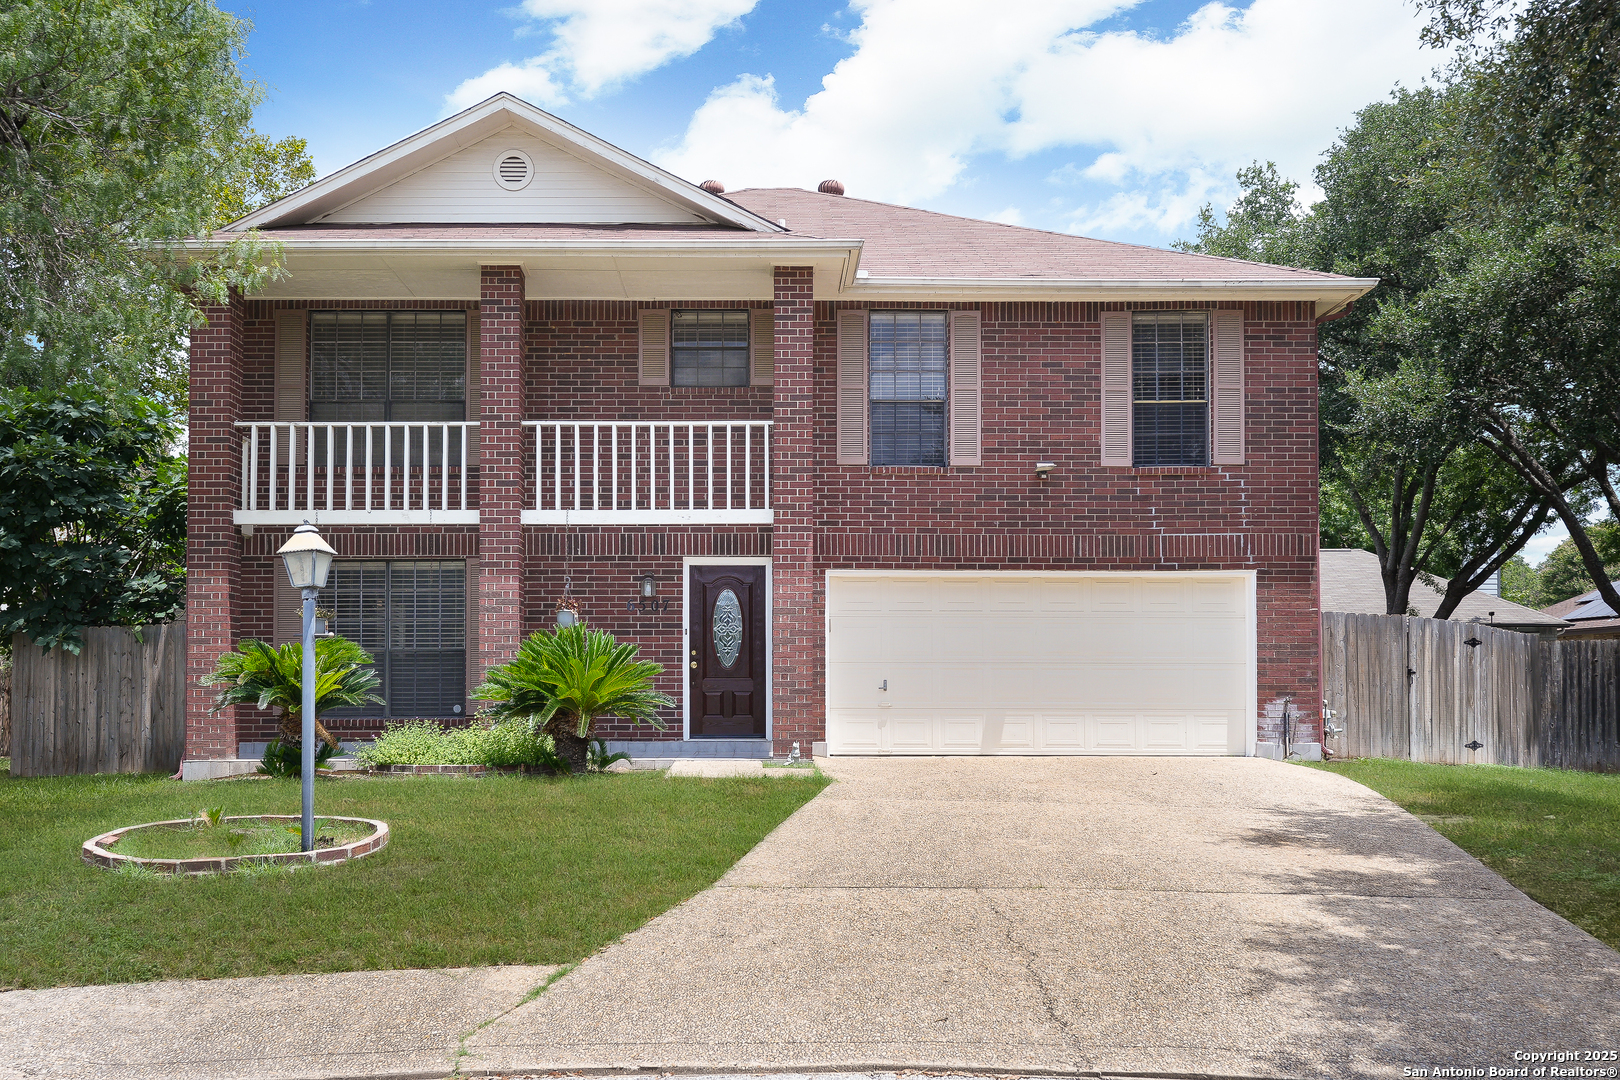
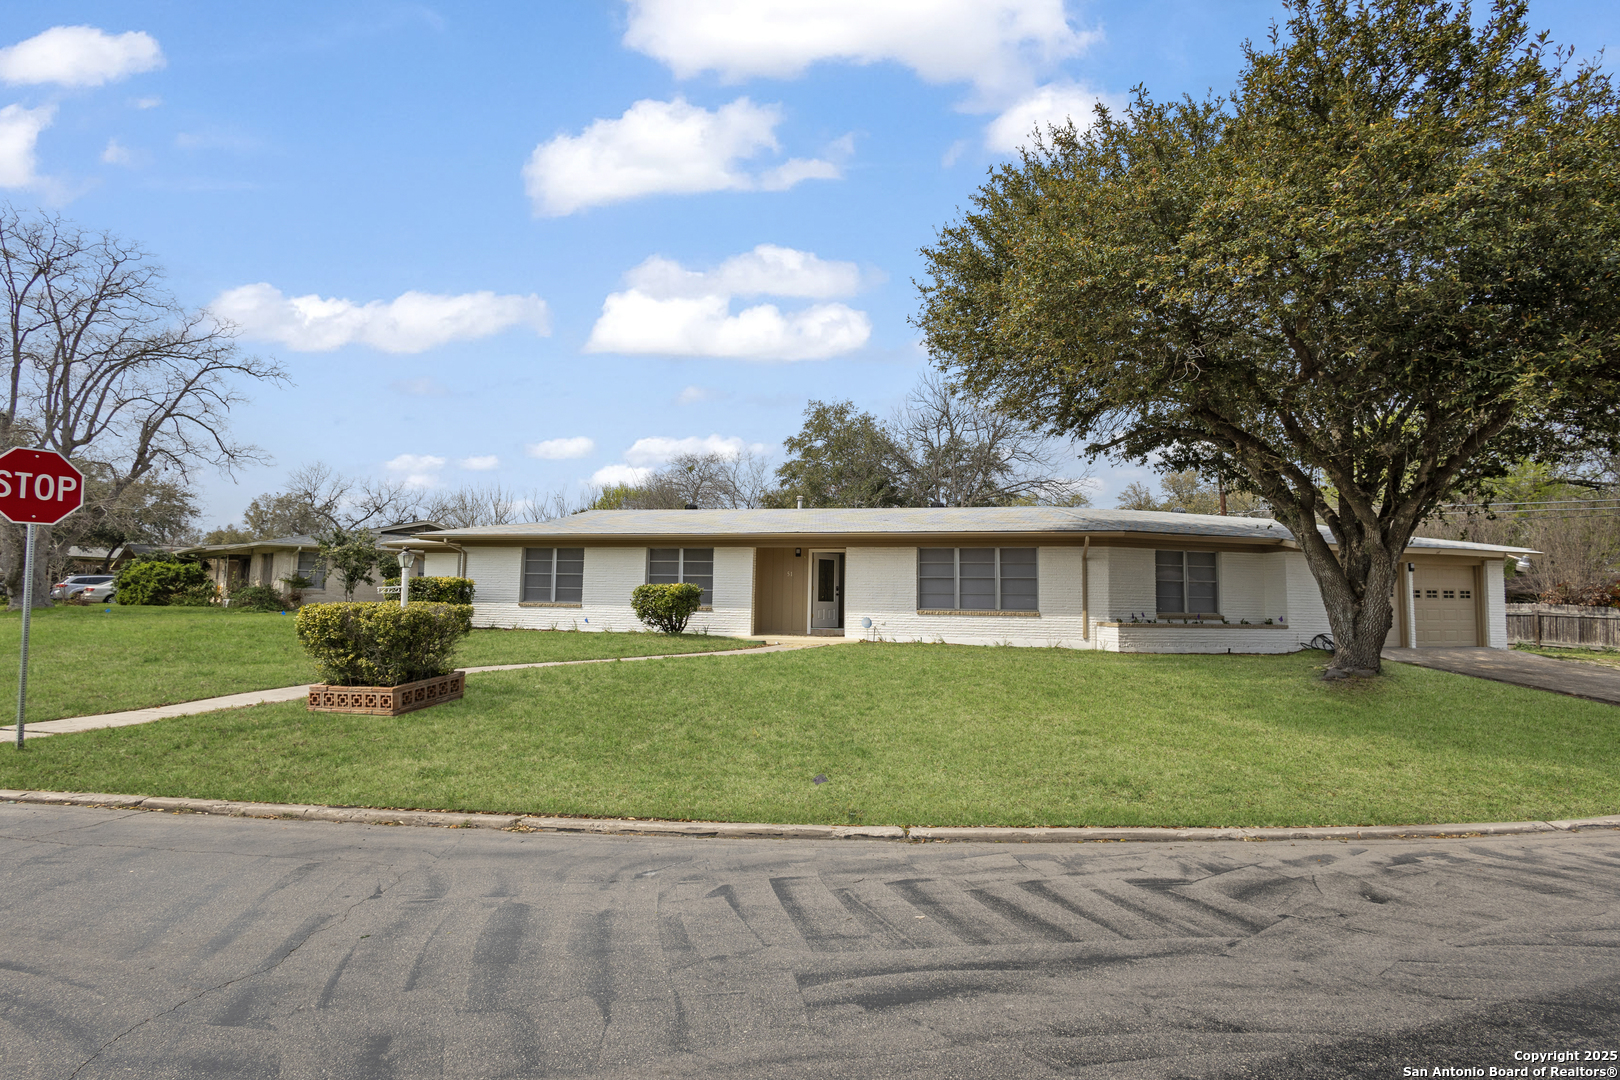
Active under contract
$350,000
3
bds
|
3
ba
|
2,754
sqft
|
built
1991
6507 Lochglen, San Antonio, TX 78240
$-630
Cash flow
-9.4%
Cash-on-Cash Return
3.5%
Cap rate
0.7%
Rent to Value Ratio
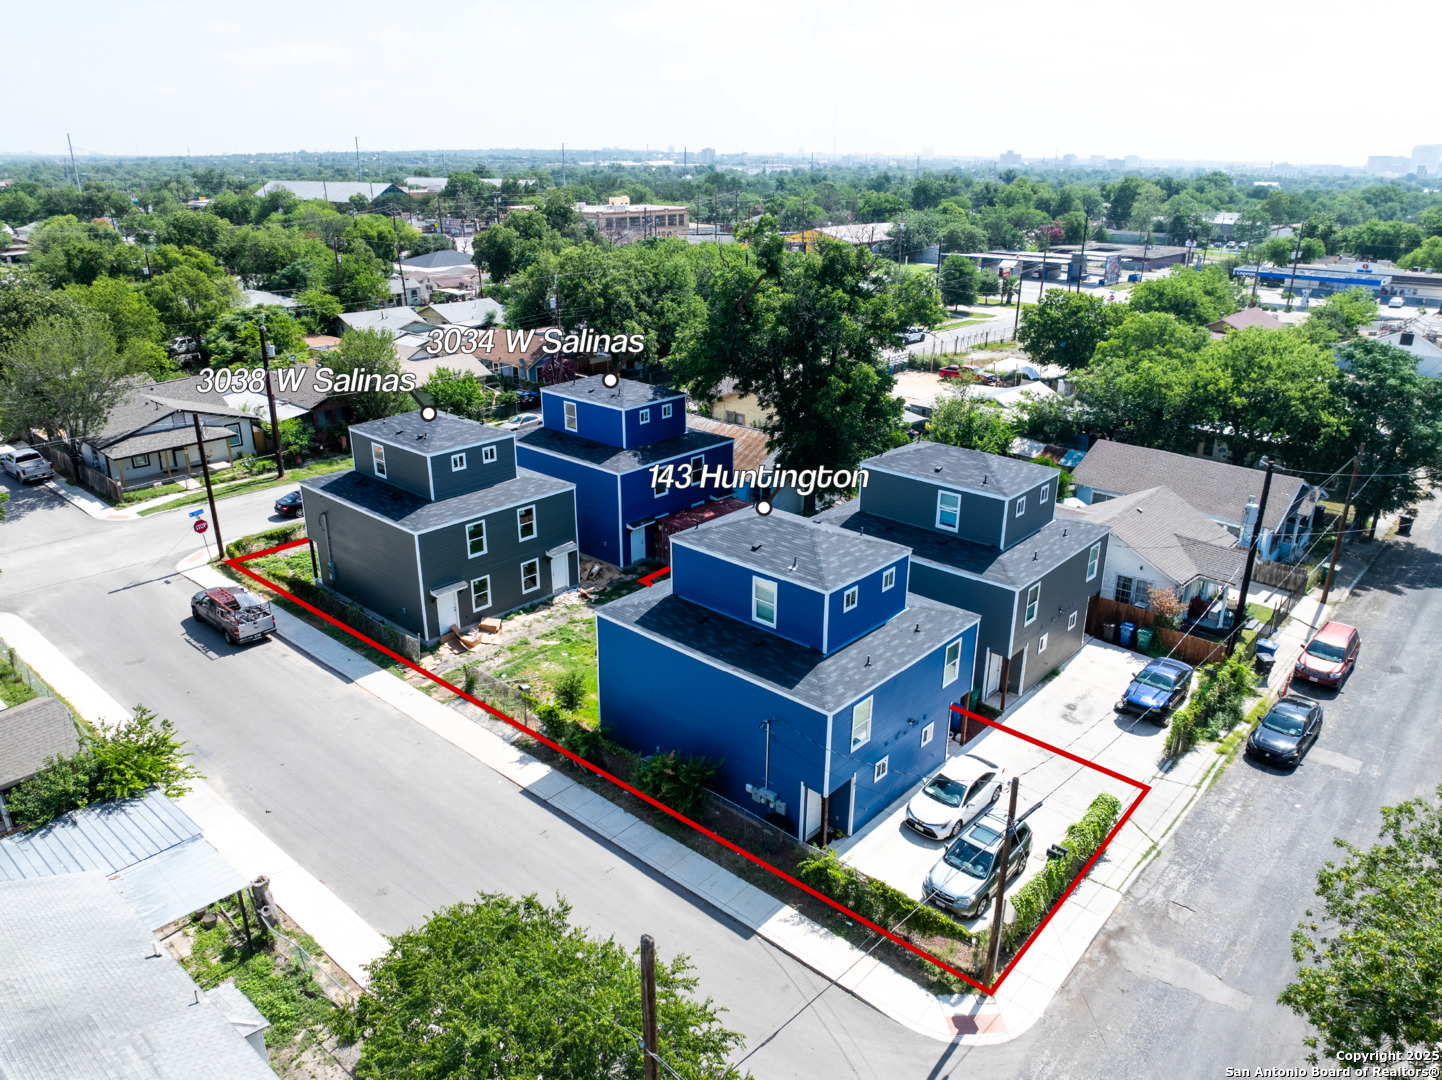
Active
$390,000
6
bds
|
0
ba
|
4,596
sqft
|
built
2023
3034 W Salinas St, San Antonio, TX 78207
$-994
Cash flow
-13.3%
Cash-on-Cash Return
2.6%
Cap rate
0.4%
Rent to Value Ratio
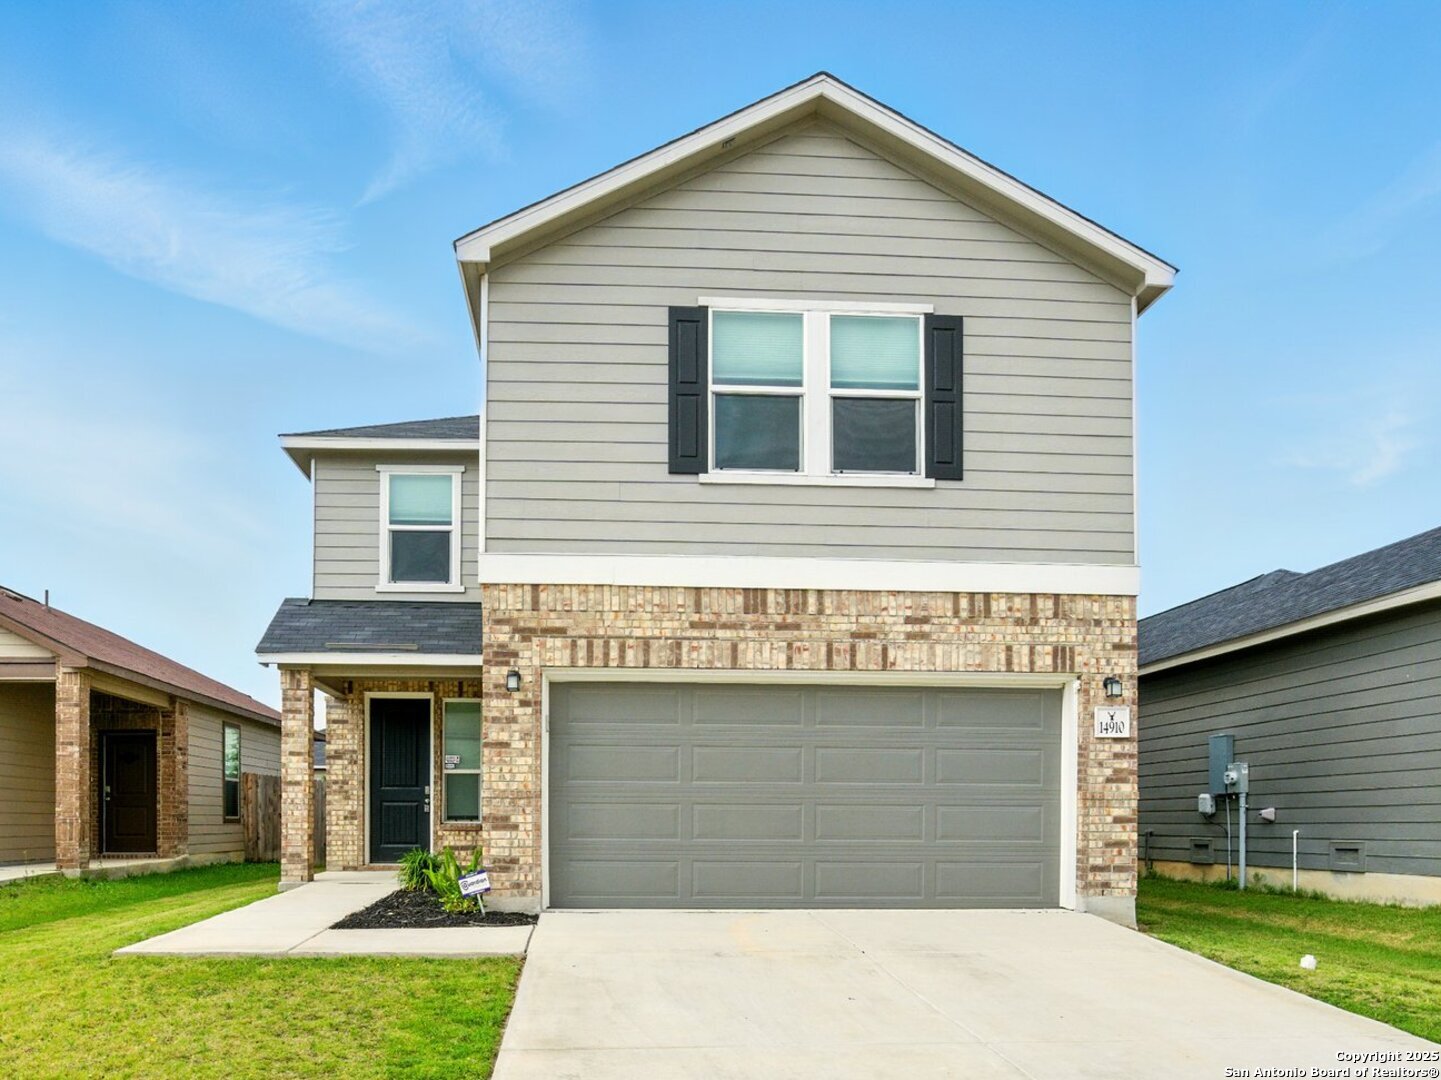
Active
$263,000
3
bds
|
3
ba
|
1,753
sqft
|
built
2022
14910 Coral Snake Way, San Antonio, TX 78253
$-359
Cash flow
-7.1%
Cash-on-Cash Return
4.0%
Cap rate
0.8%
Rent to Value Ratio
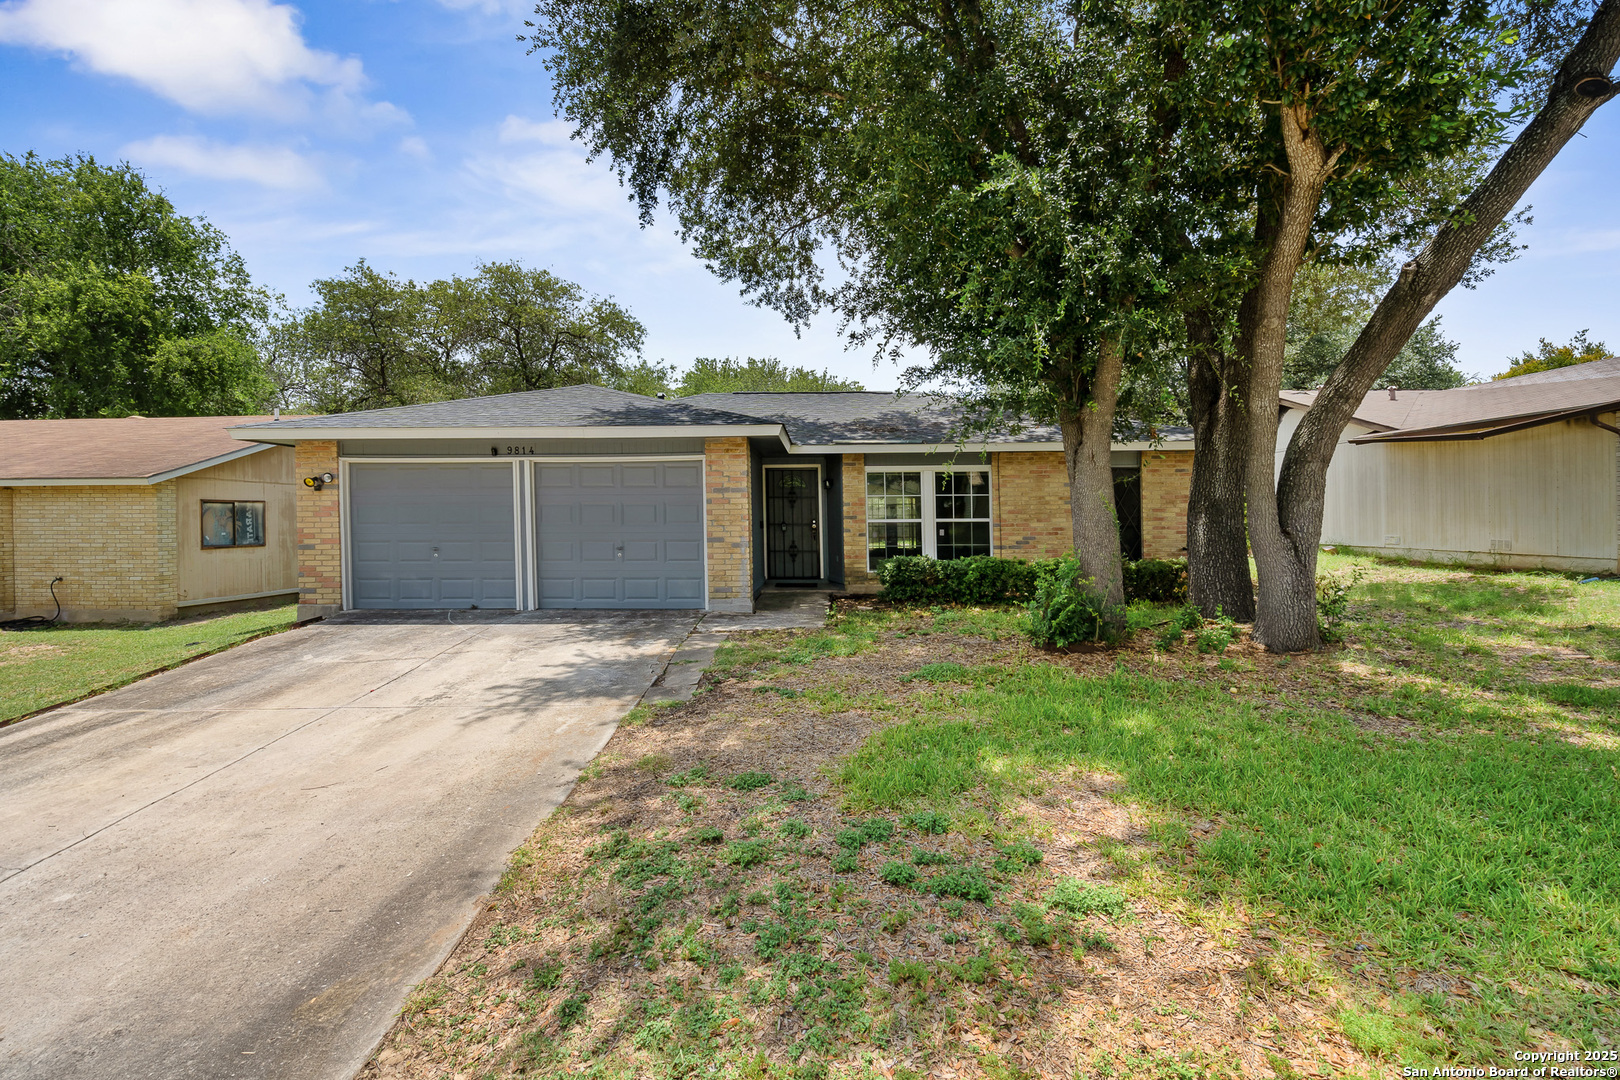
Active
$199,000
2
bds
|
2
ba
|
1,247
sqft
|
built
1981
9814 Mill River Sq, San Antonio, TX 78245
$-39,603
Cash flow
-1038.3%
Cash-on-Cash Return
-233.1%
Cap rate
0.8%
Rent to Value Ratio
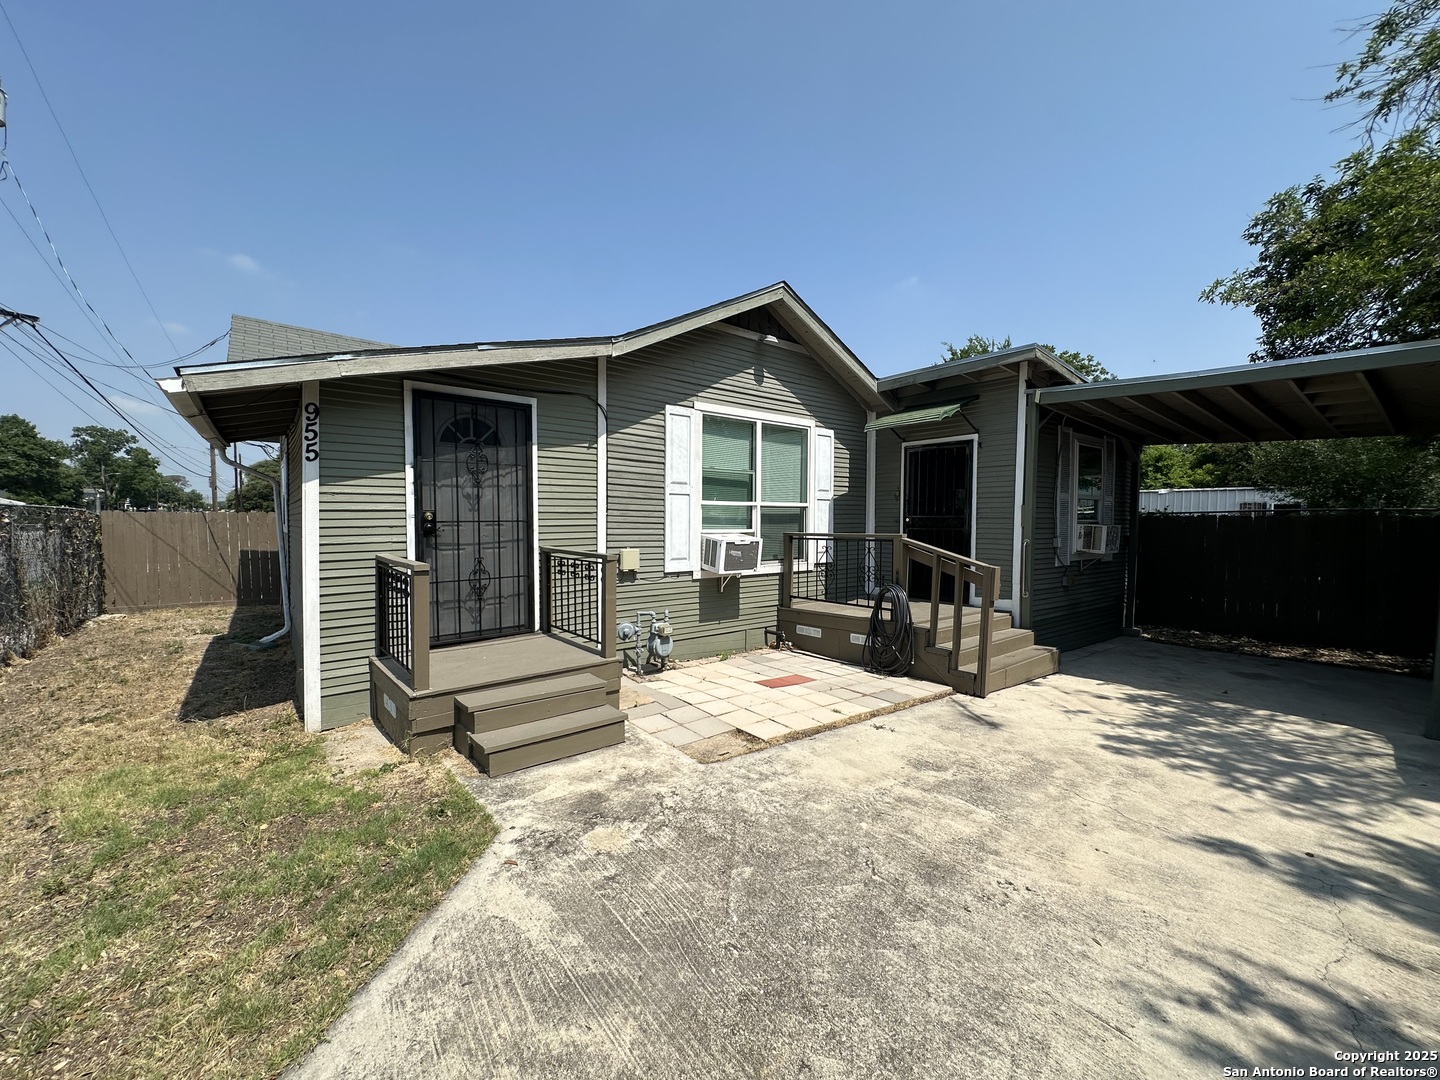
Active
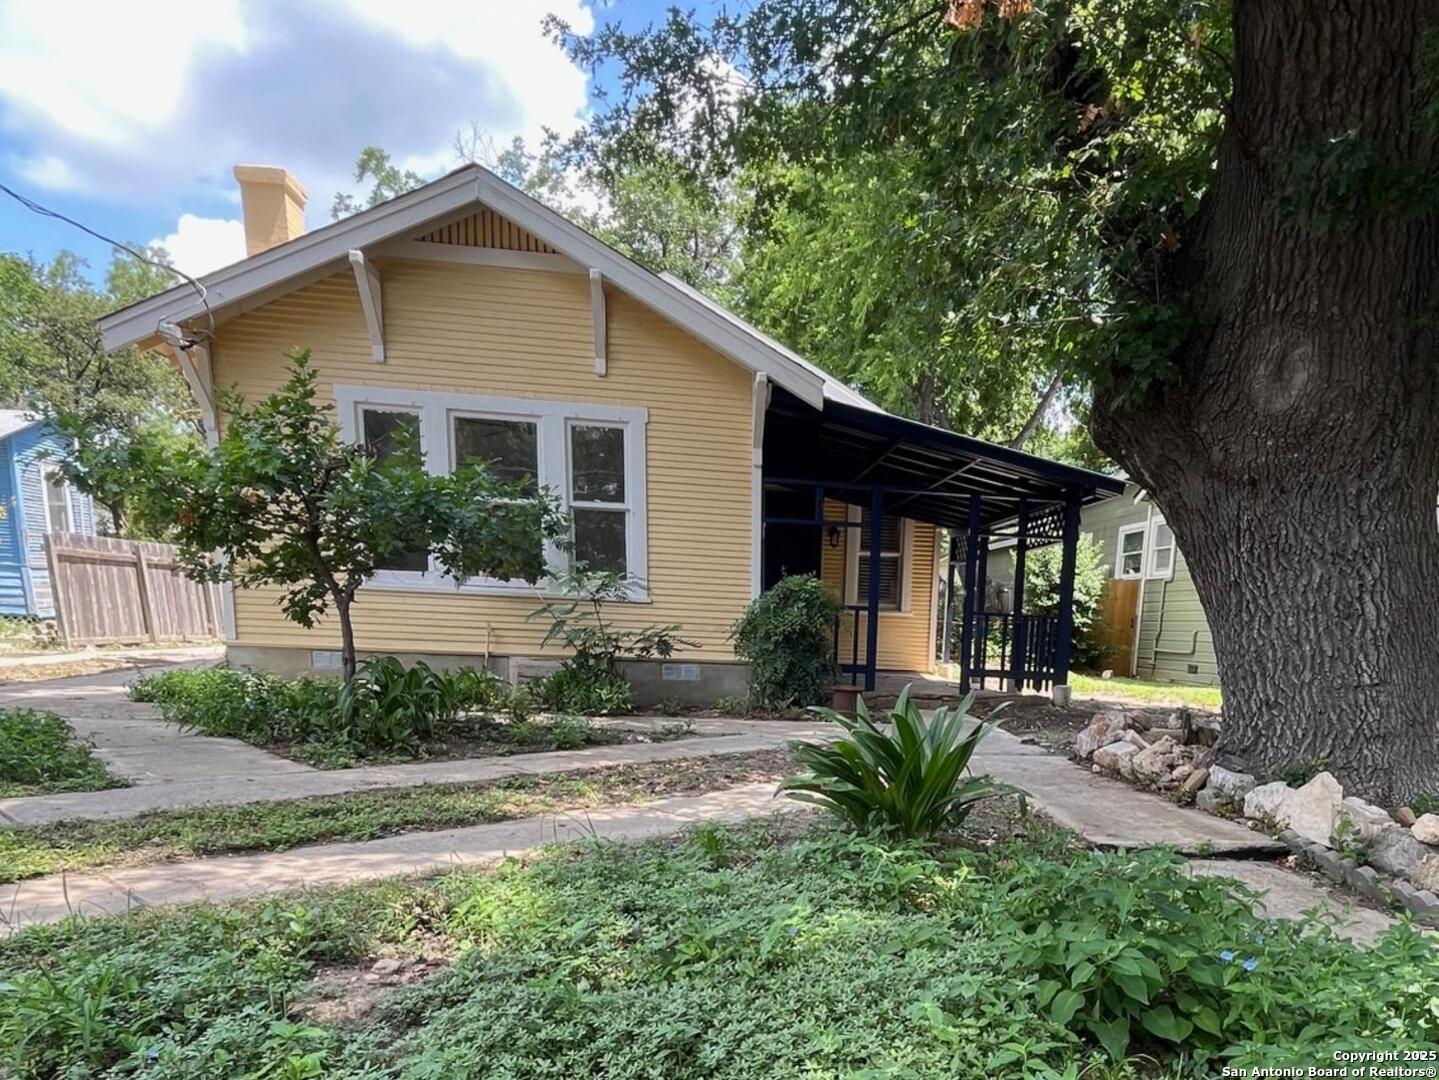
$169,000
2
bds
|
1
ba
|
800
sqft
|
built
1926
955 Steves Ave, San Antonio, TX 78210
$-25
Cash flow
-0.8%
Cash-on-Cash Return
5.5%
Cap rate
0.8%
Rent to Value Ratio
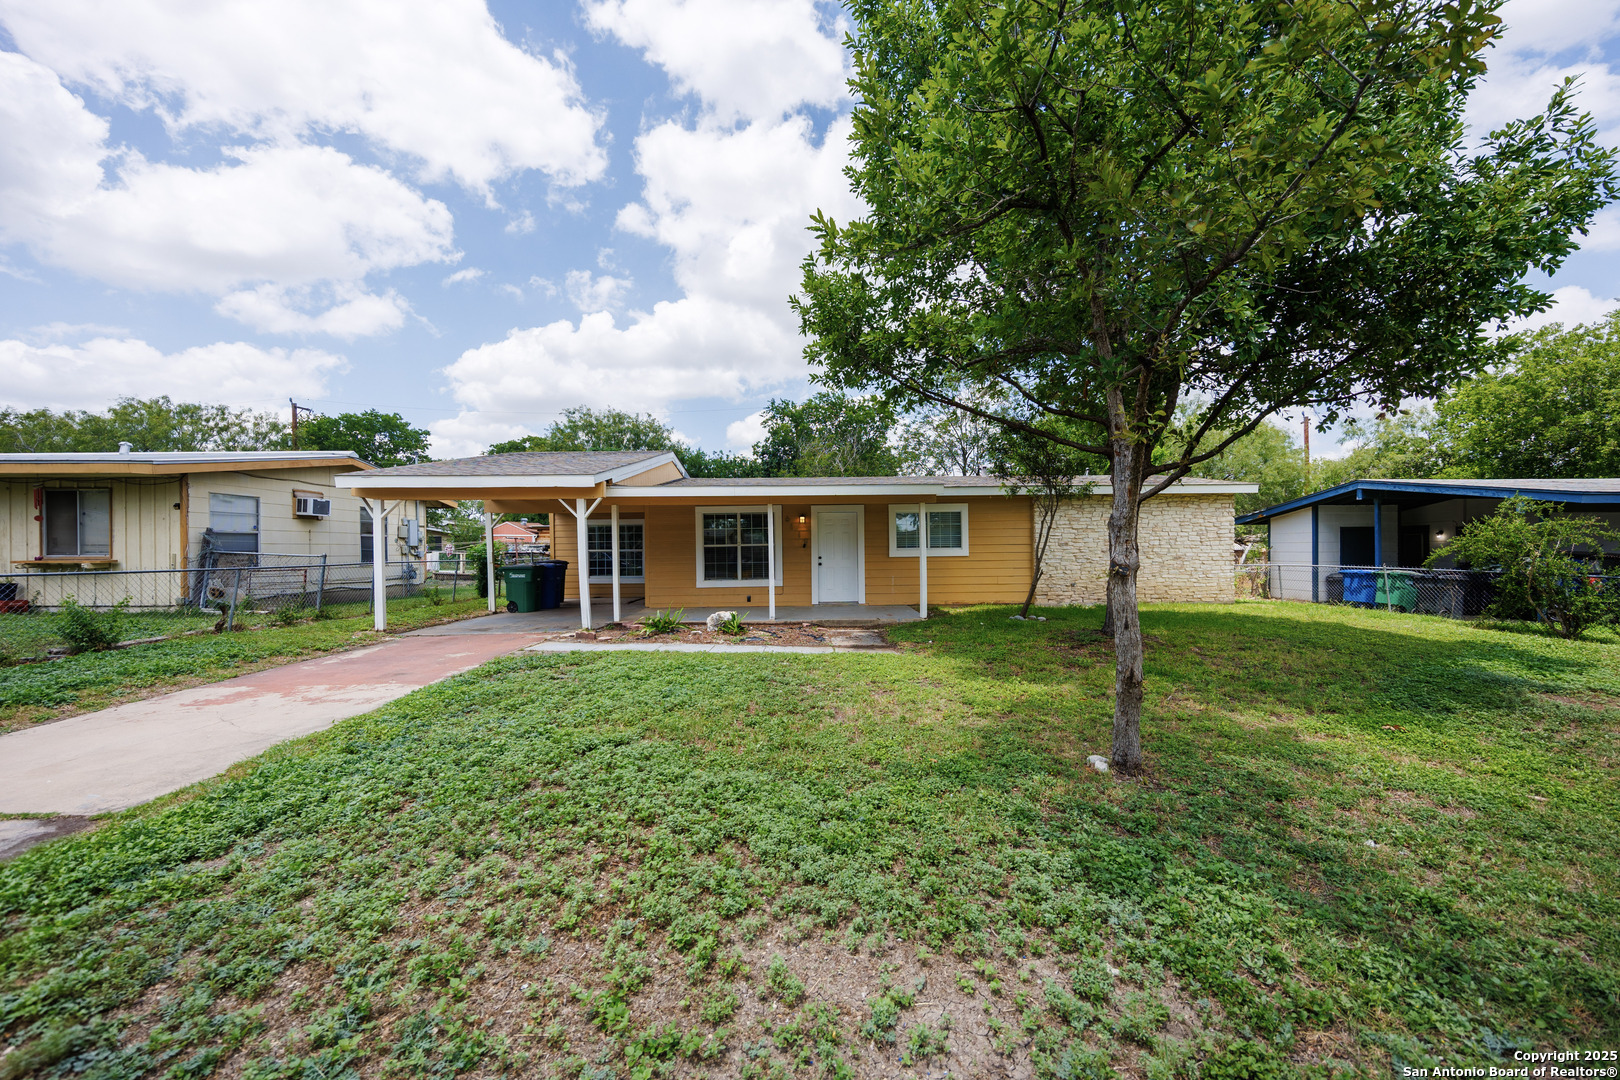
Active
$179,700
3
bds
|
2
ba
|
1,222
sqft
|
built
1966
6119 Deer Valley Dr, San Antonio, TX 78242
$-130
Cash flow
-3.8%
Cash-on-Cash Return
4.8%
Cap rate
0.9%
Rent to Value Ratio

Active
$527,000
3
bds
|
2
ba
|
1,833
sqft
|
built
1998
23007 S Breeze St, San Antonio, TX 78258
$-1,187
Cash flow
-11.8%
Cash-on-Cash Return
3.0%
Cap rate
0.5%
Rent to Value Ratio
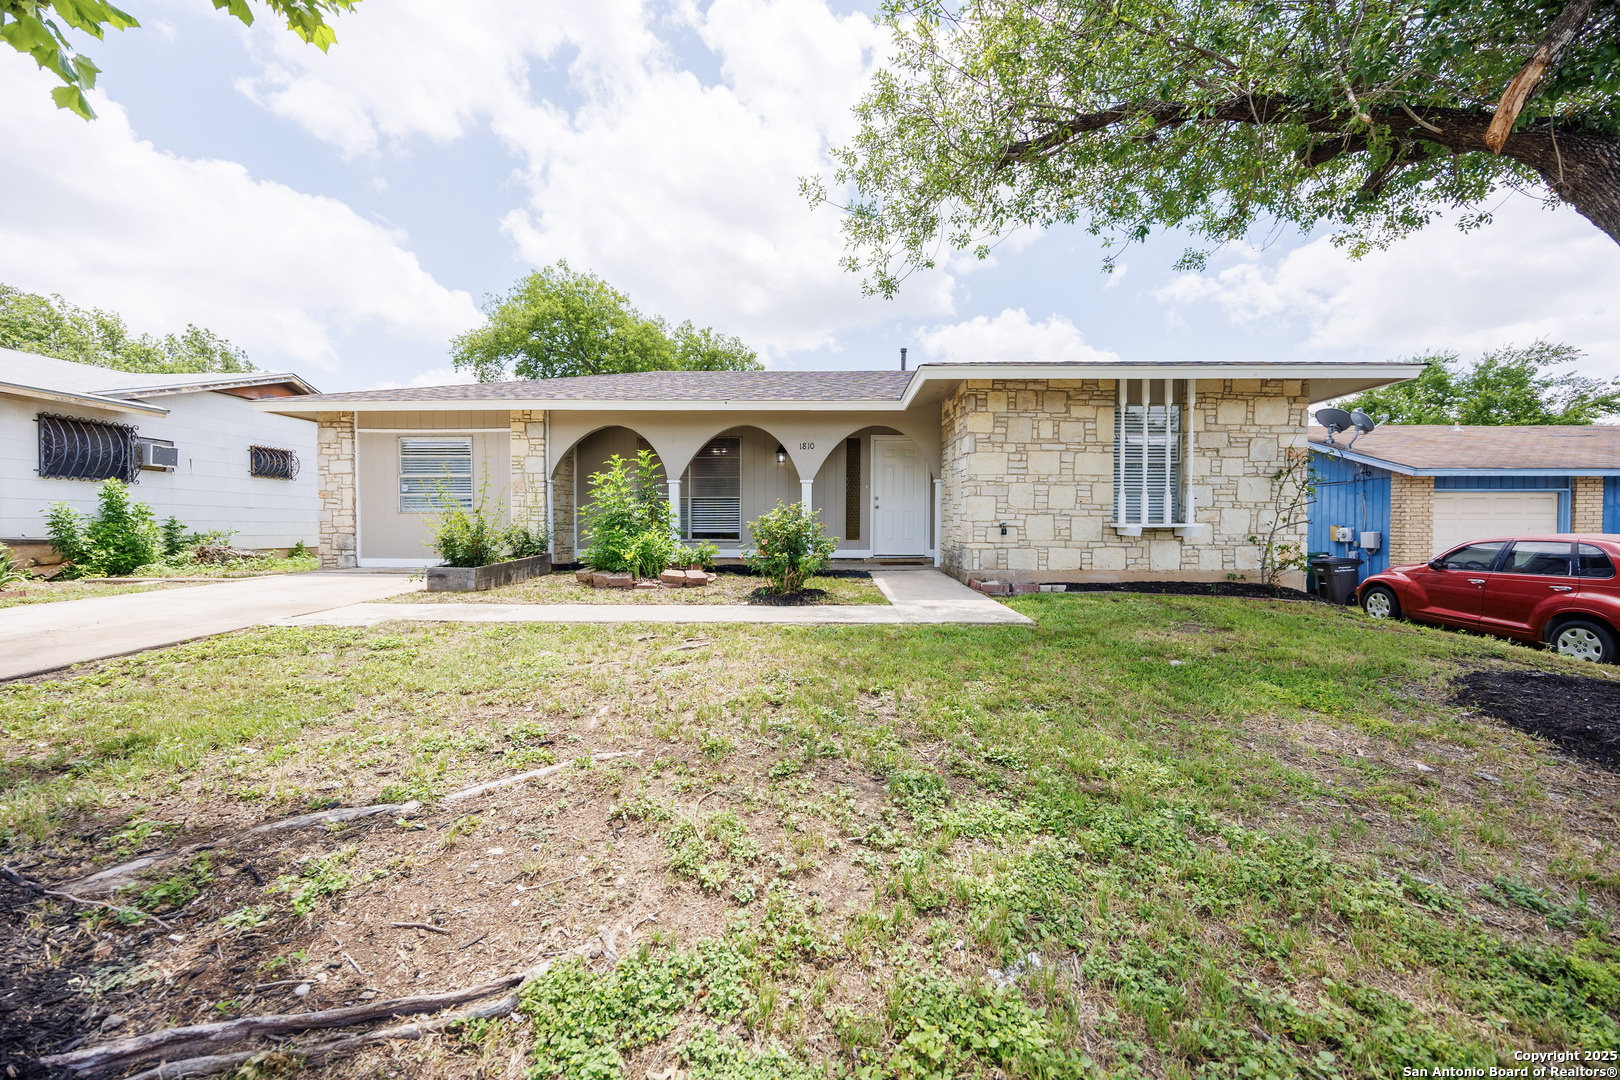
Active
$209,700
5
bds
|
2
ba
|
1,575
sqft
|
built
1970
1810 Laven Dr, San Antonio, TX 78228
$-341
Cash flow
-8.5%
Cash-on-Cash Return
3.7%
Cap rate
0.7%
Rent to Value Ratio
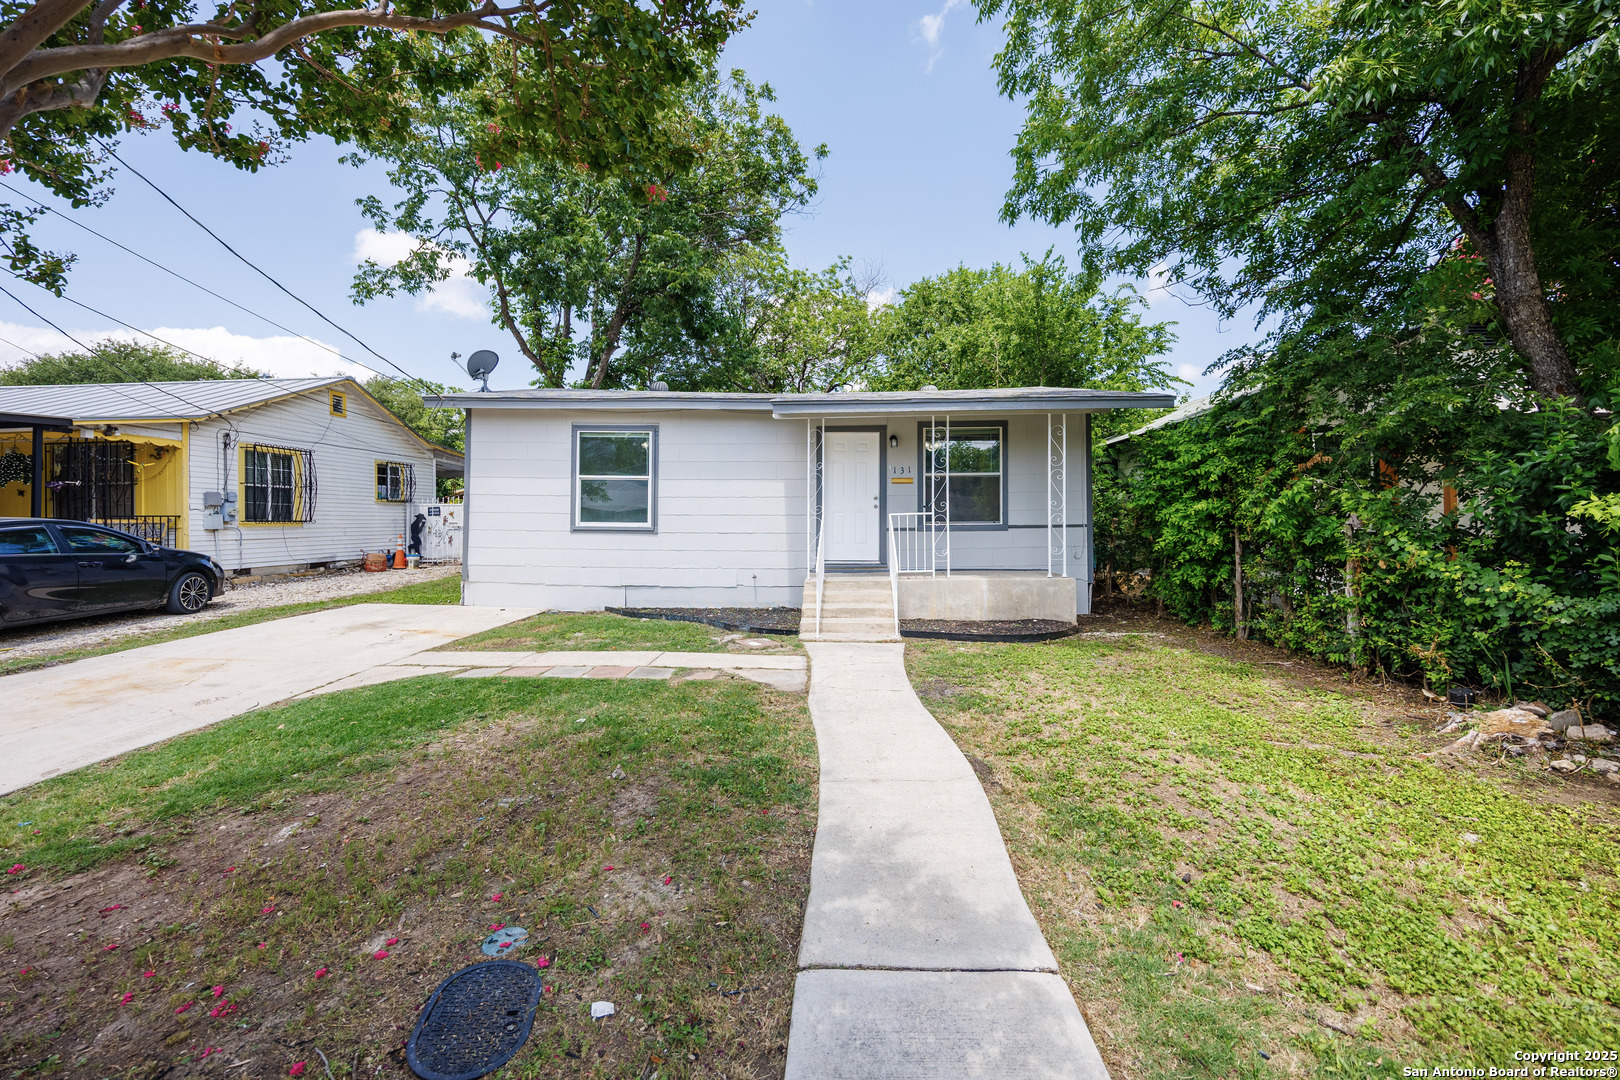
Active
$159,700
3
bds
|
1
ba
|
1,029
sqft
|
built
1950
131 Neff, San Antonio, TX 78207
$-231
Cash flow
-7.5%
Cash-on-Cash Return
3.9%
Cap rate
0.7%
Rent to Value Ratio
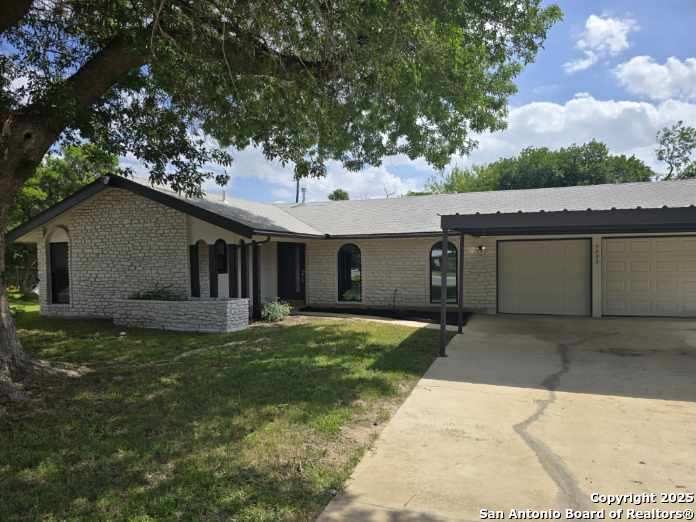
Active
$289,990
3
bds
|
2
ba
|
1,446
sqft
|
built
1966
9503 Reece Dr, San Antonio, TX 78216
$-580
Cash flow
-10.4%
Cash-on-Cash Return
3.3%
Cap rate
0.7%
Rent to Value Ratio
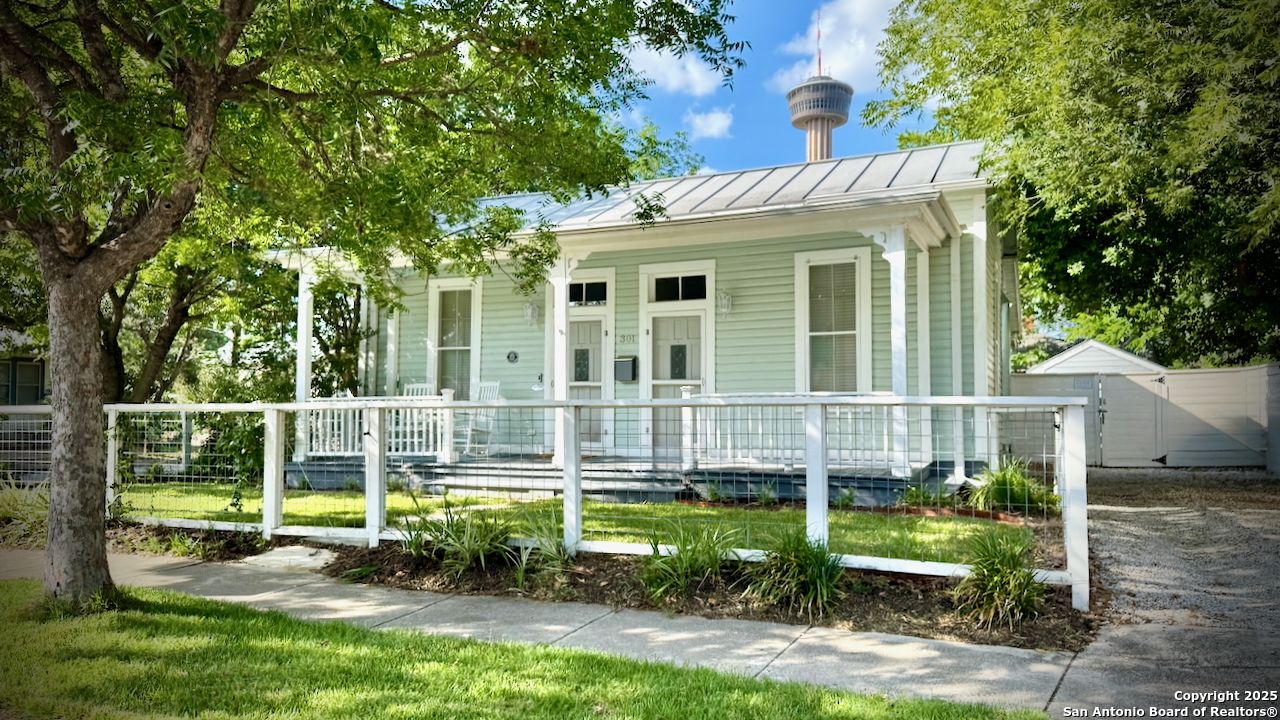
Active
$520,000
2
bds
|
1
ba
|
960
sqft
|
built
1883
301 Barrera St, San Antonio, TX 78210
$-1,711
Cash flow
-17.2%
Cash-on-Cash Return
1.7%
Cap rate
0.4%
Rent to Value Ratio
Active
$289,900
3
bds
|
2
ba
|
1,504
sqft
|
built
1995
9803 Morningfield, San Antonio, TX 78250
$-703
Cash flow
-12.7%
Cash-on-Cash Return
2.8%
Cap rate
0.6%
Rent to Value Ratio
Active
$219,999
3
bds
|
2
ba
|
1,509
sqft
|
built
1985
13106 Feather Point Dr, San Antonio, TX 78233
$-393
Cash flow
-9.3%
Cash-on-Cash Return
3.5%
Cap rate
0.7%
Rent to Value Ratio
Active
$190,000
3
bds
|
2
ba
|
1,402
sqft
|
built
1919
310 Mary St, San Antonio, TX 78214
$-32
Cash flow
-0.9%
Cash-on-Cash Return
5.5%
Cap rate
0.9%
Rent to Value Ratio
Active
$425,000
4
bds
|
3
ba
|
3,388
sqft
|
built
1950
4931 Driskill St, San Antonio, TX 78228
$-1,100
Cash flow
-13.5%
Cash-on-Cash Return
2.6%
Cap rate
0.6%
Rent to Value Ratio
Active
$250,000
3
bds
|
1
ba
|
1,236
sqft
|
built
1925
1137 W Magnolia Ave, San Antonio, TX 78201
$-613
Cash flow
-12.8%
Cash-on-Cash Return
2.7%
Cap rate
0.6%
Rent to Value Ratio
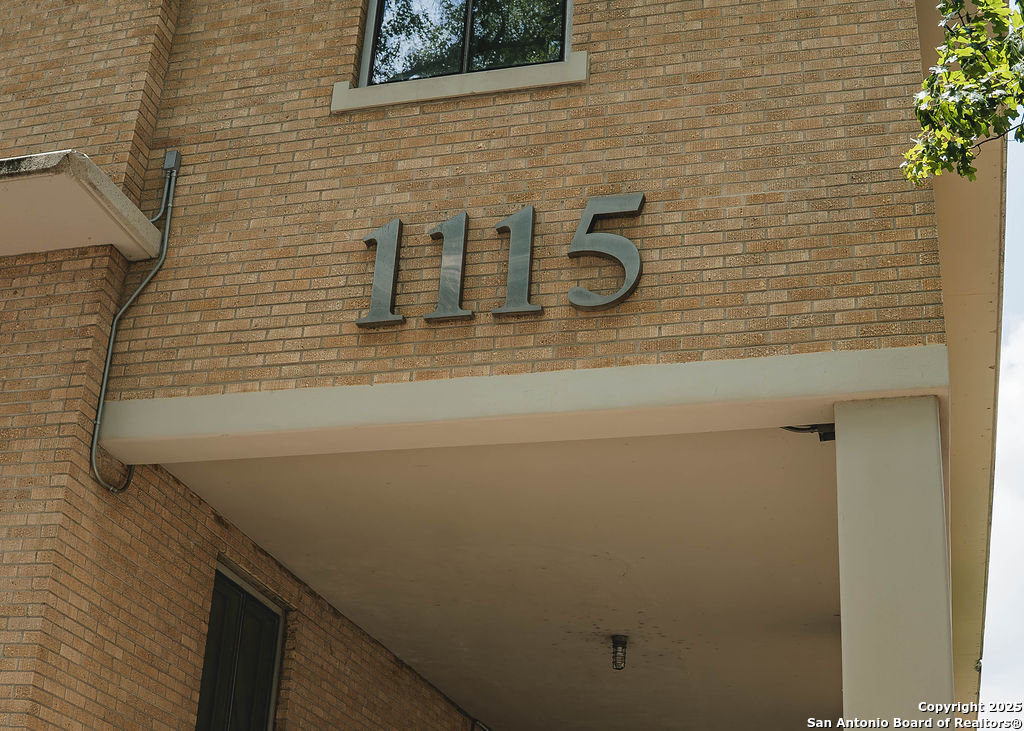
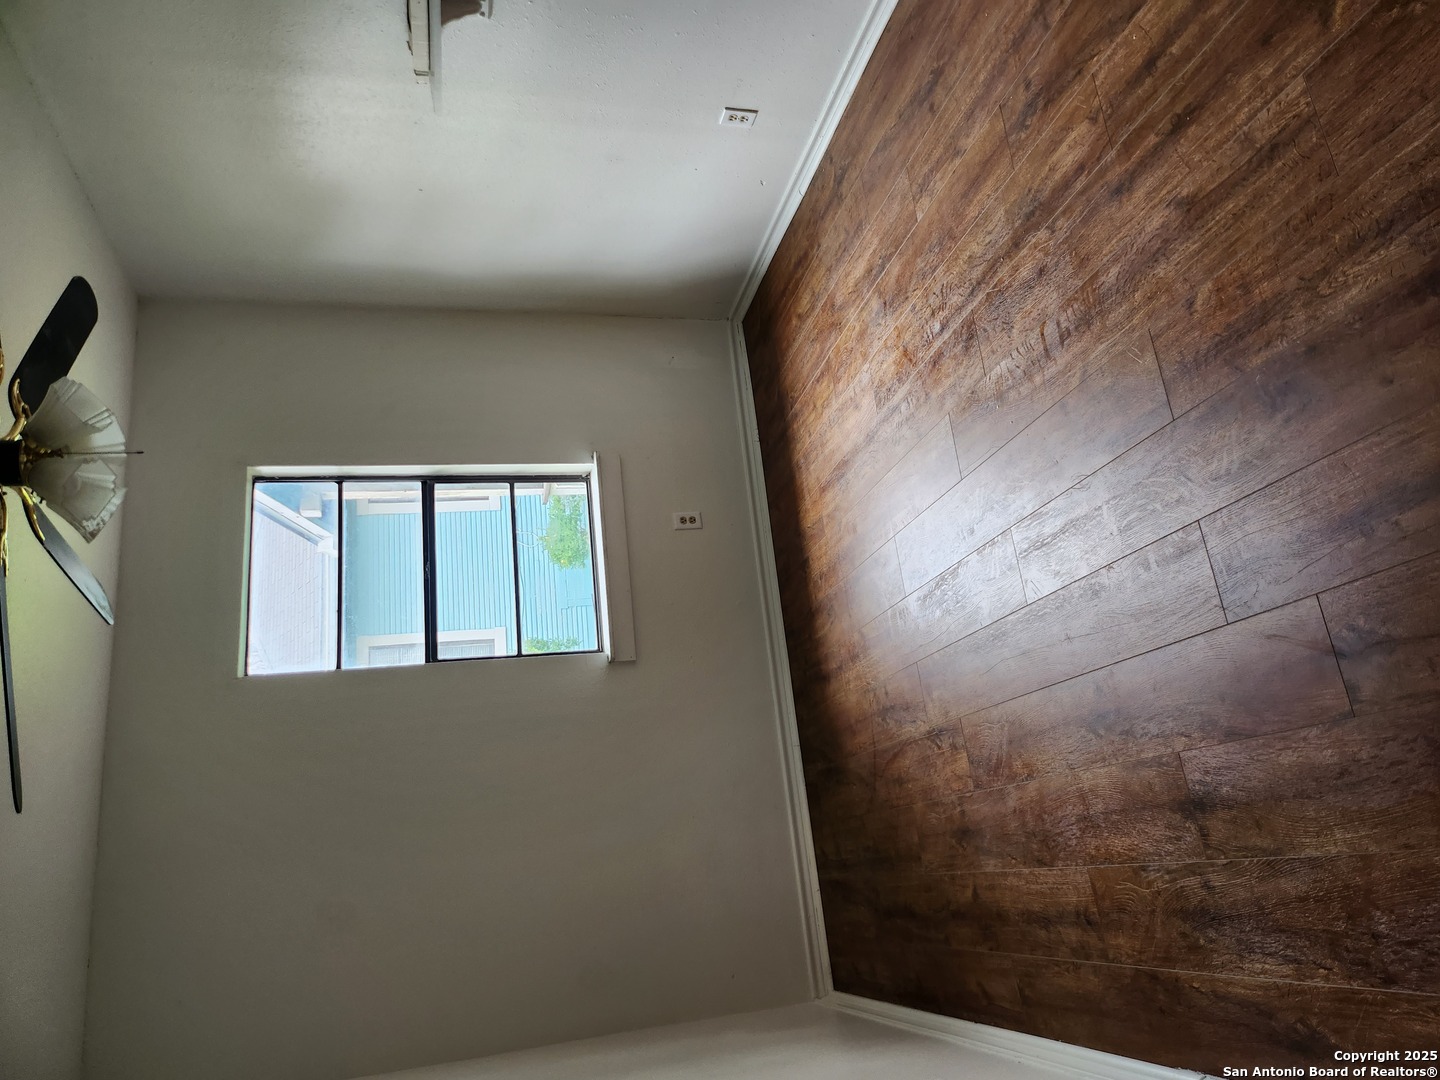
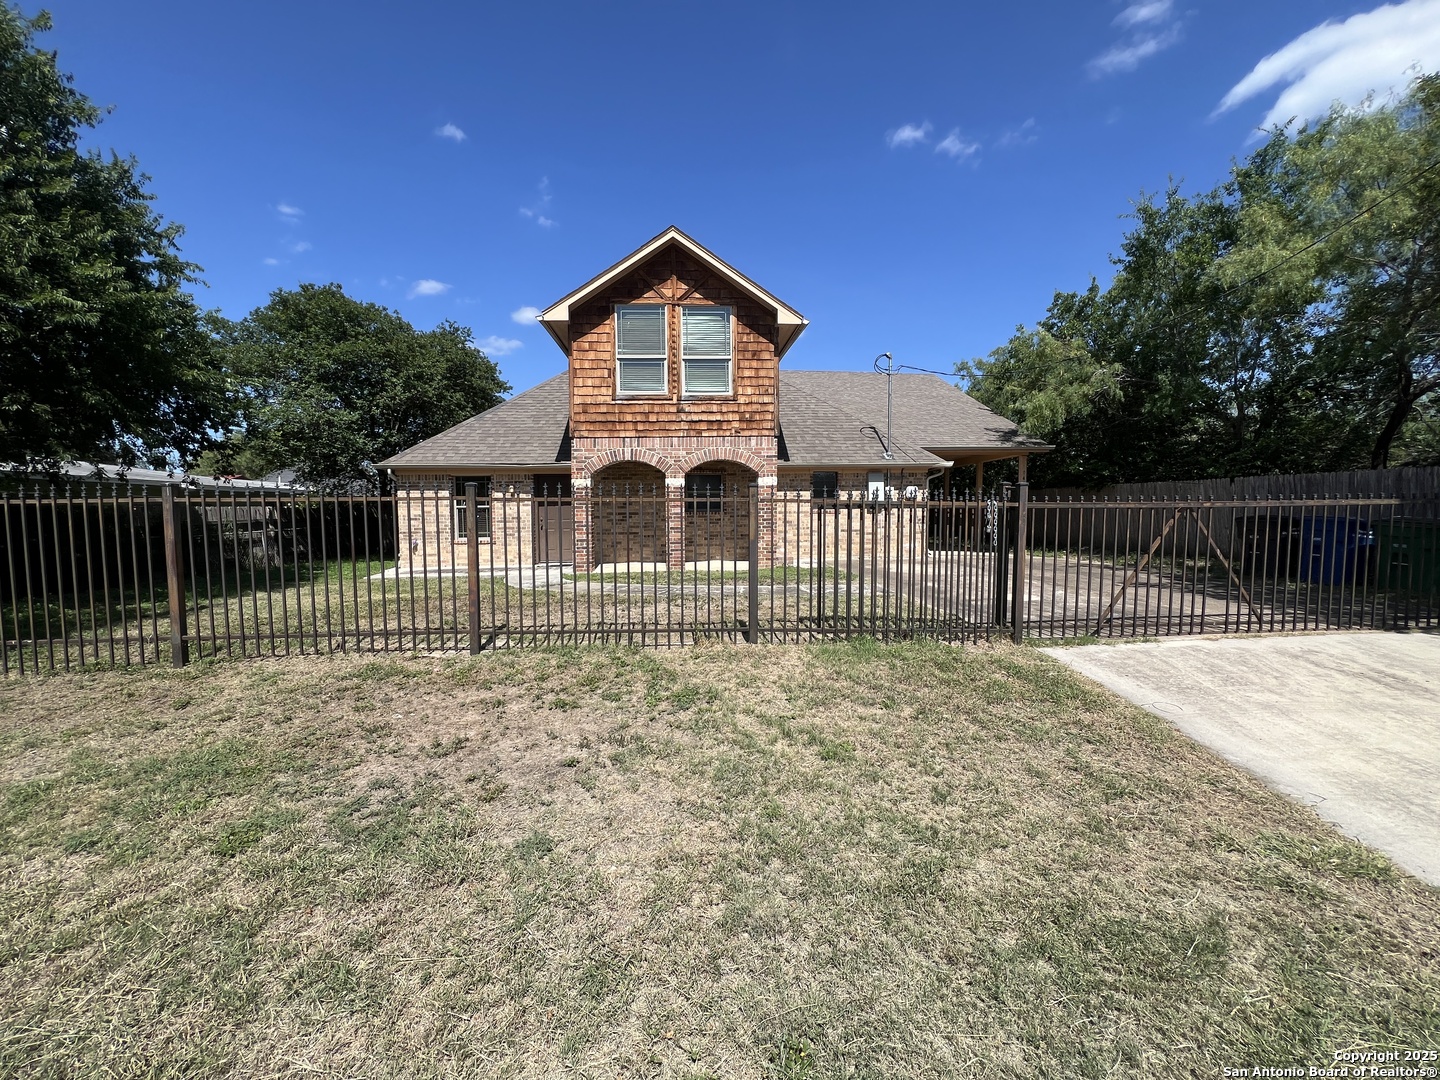
Active
$298,500
1
bds
|
1
ba
|
773
sqft
|
built
2009
1115 S Alamo St, San Antonio, TX 78210
$-1,261
Cash flow
-22.0%
Cash-on-Cash Return
0.6%
Cap rate
0.6%
Rent to Value Ratio
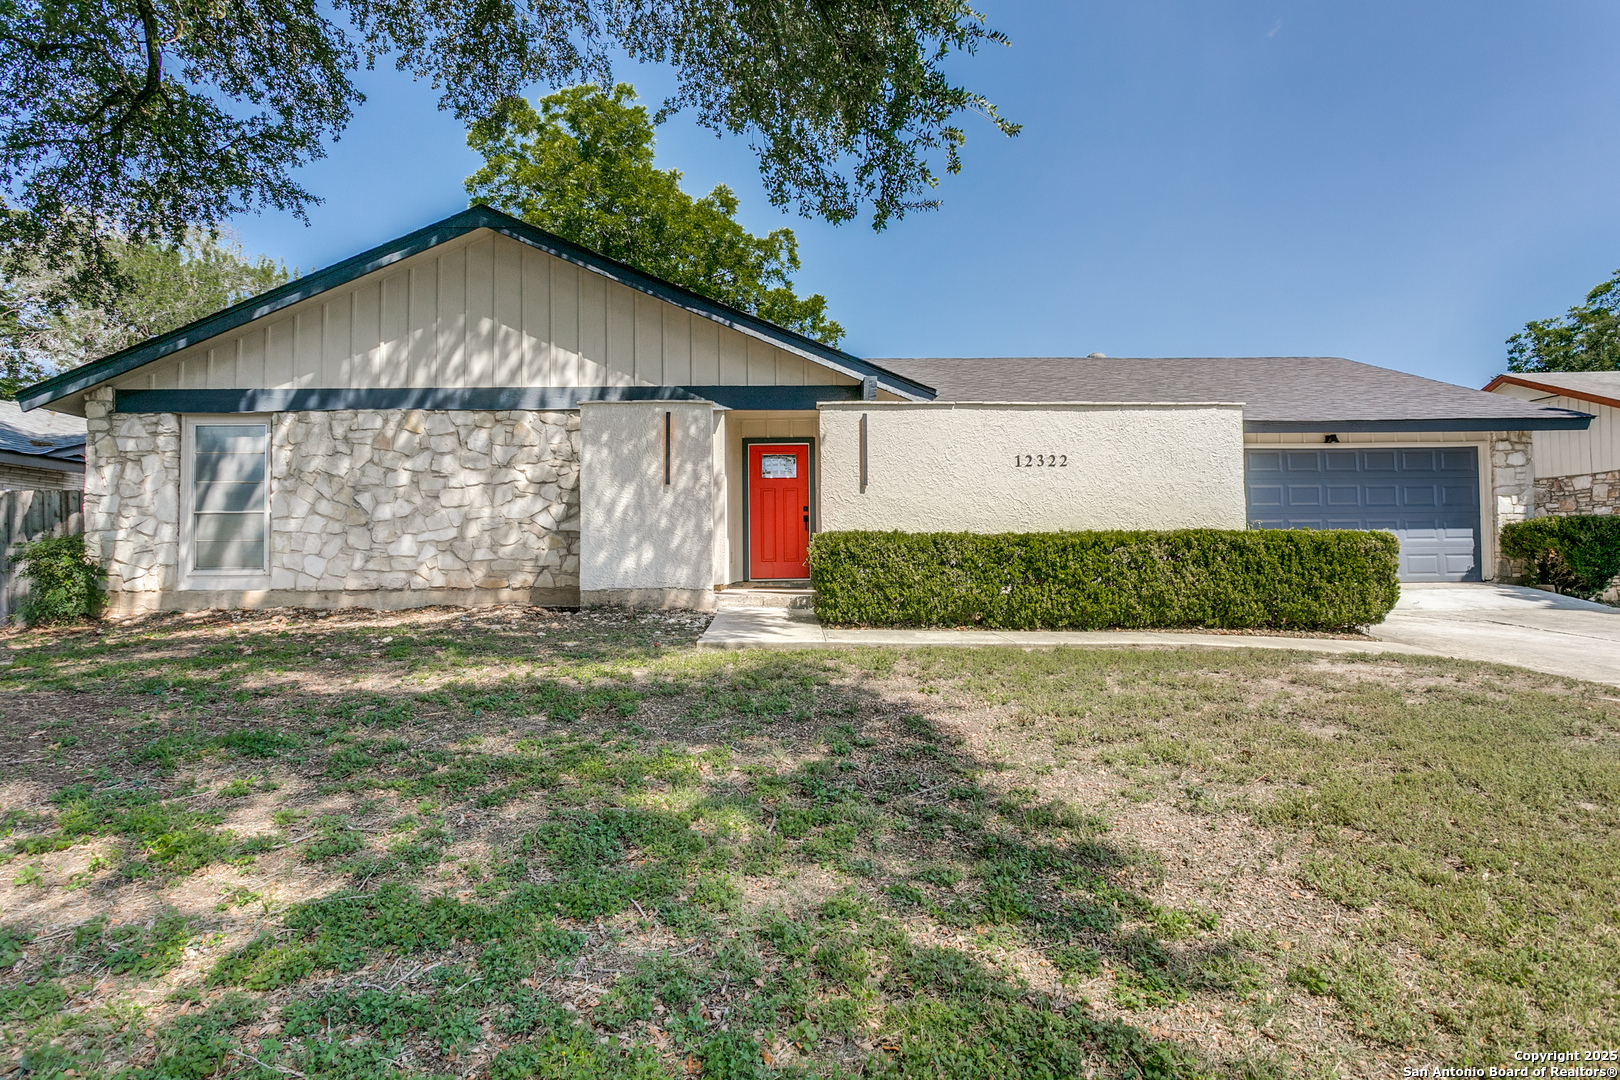
Active
$298,000
4
bds
|
2
ba
|
1,847
sqft
|
built
1973
12322 Independence Ave, San Antonio, TX 78233
$-694
Cash flow
-12.2%
Cash-on-Cash Return
2.9%
Cap rate
0.6%
Rent to Value Ratio
Pending
$95,000
3
bds
|
1
ba
|
912
sqft
|
built
1962
12823 Bell Dr, San Antonio, TX 78217
$283
Cash flow
15.5%
Cash-on-Cash Return
9.3%
Cap rate
1.5%
Rent to Value Ratio
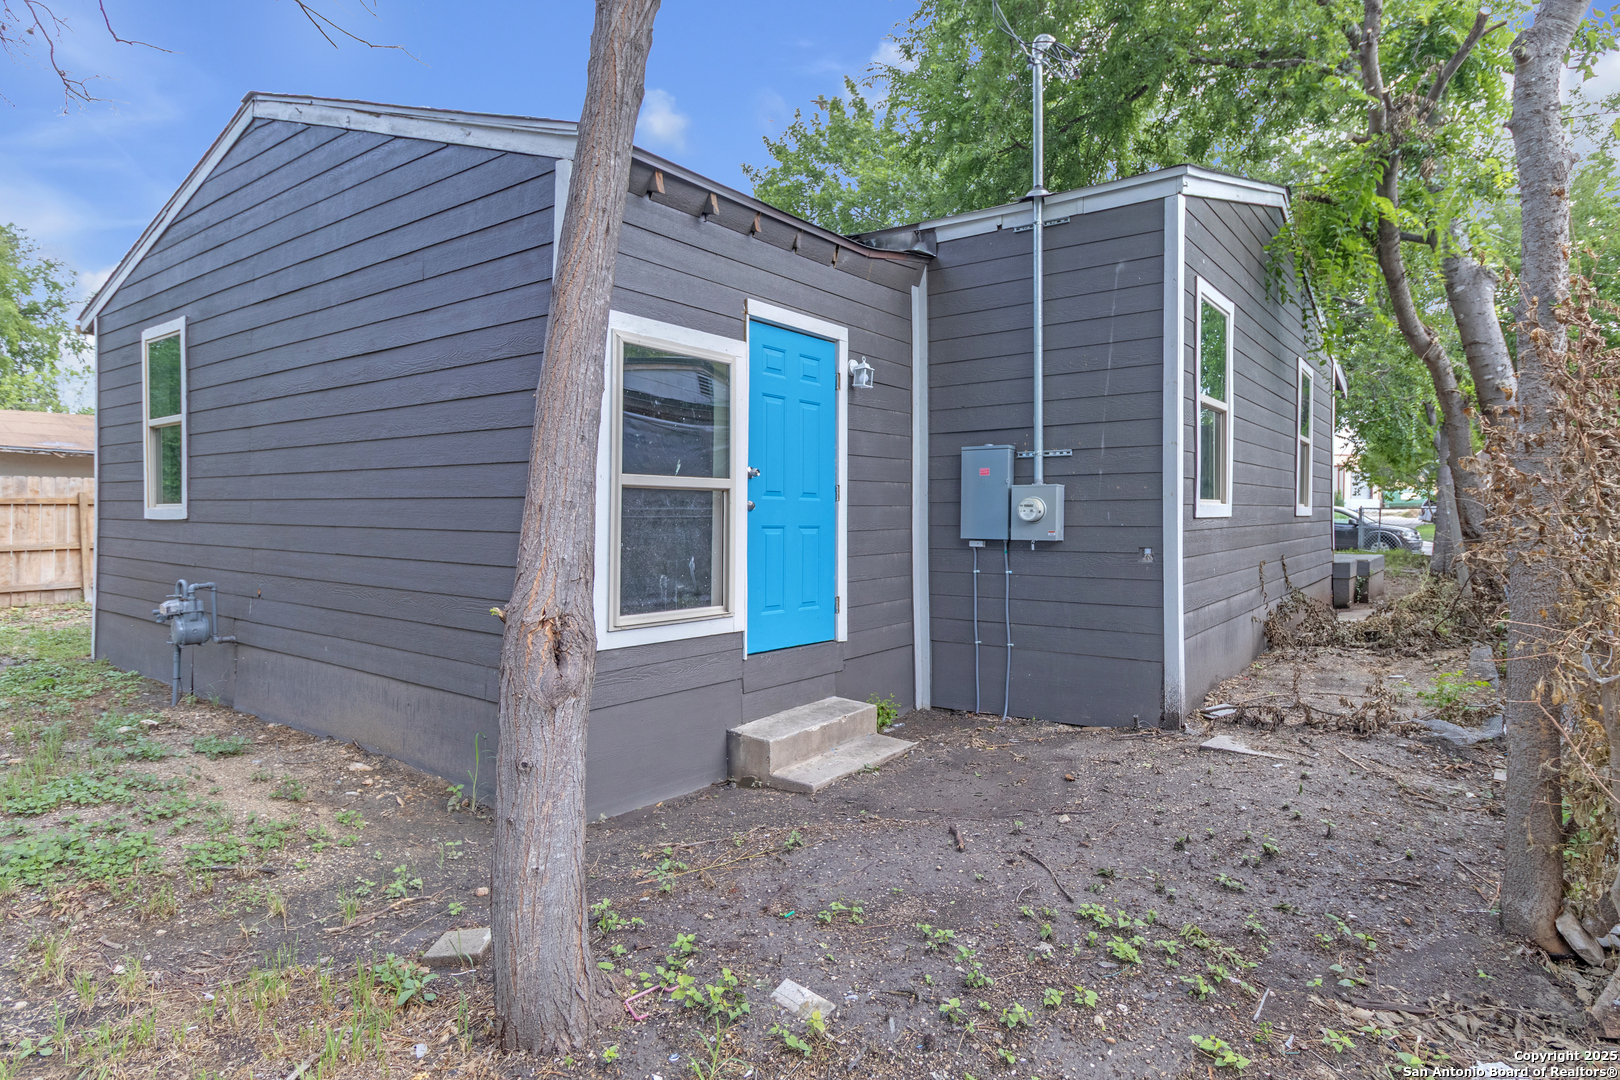
Active
$120,000
3
bds
|
1
ba
|
700
sqft
|
built
1949
2338 Burnet St, San Antonio, TX 78202
$-195
Cash flow
-8.5%
Cash-on-Cash Return
3.7%
Cap rate
0.8%
Rent to Value Ratio
Active
$340,000
3
bds
|
3
ba
|
2,866
sqft
|
built
1999
1110 Tetford, San Antonio, TX 78253
$-790
Cash flow
-12.1%
Cash-on-Cash Return
2.9%
Cap rate
0.6%
Rent to Value Ratio

Active
$169,900
2
bds
|
1
ba
|
980
sqft
|
built
2001
10214 Redfish Cavern, San Antonio, TX 78245
$-104
Cash flow
-3.2%
Cash-on-Cash Return
4.9%
Cap rate
0.8%
Rent to Value Ratio
Active
$299,900
3
bds
|
2
ba
|
1,714
sqft
|
built
1978
6131 Windbrooke St, San Antonio, TX 78249
$-586
Cash flow
-10.2%
Cash-on-Cash Return
3.3%
Cap rate
0.7%
Rent to Value Ratio

Active
$265,000
3
bds
|
2
ba
|
2,187
sqft
|
built
1989
7303 Roveen Trl, San Antonio, TX 78244
$-462
Cash flow
-9.1%
Cash-on-Cash Return
3.6%
Cap rate
0.7%
Rent to Value Ratio
Active
$125,000
2
bds
|
2
ba
|
986
sqft
|
built
1981
7901 Broadwick, San Antonio, TX 78239
$115
Cash flow
4.8%
Cash-on-Cash Return
6.8%
Cap rate
1.0%
Rent to Value Ratio
Active
$550,000
4
bds
|
3
ba
|
2,987
sqft
|
built
2005
20710 Meandering Cir, San Antonio, TX 78258
$-1,554
Cash flow
-14.7%
Cash-on-Cash Return
2.3%
Cap rate
0.5%
Rent to Value Ratio
Active
$182,900
2
bds
|
1
ba
|
1,130
sqft
|
built
1950
6301 W US Highway 90, San Antonio, TX 78227
$-146
Cash flow
-4.2%
Cash-on-Cash Return
4.7%
Cap rate
0.8%
Rent to Value Ratio
Active
$380,000
2
bds
|
2
ba
|
1,144
sqft
|
built
1925
519 E Huisache Ave, San Antonio, TX 78212
$-1,377
Cash flow
-18.9%
Cash-on-Cash Return
1.3%
Cap rate
0.5%
Rent to Value Ratio
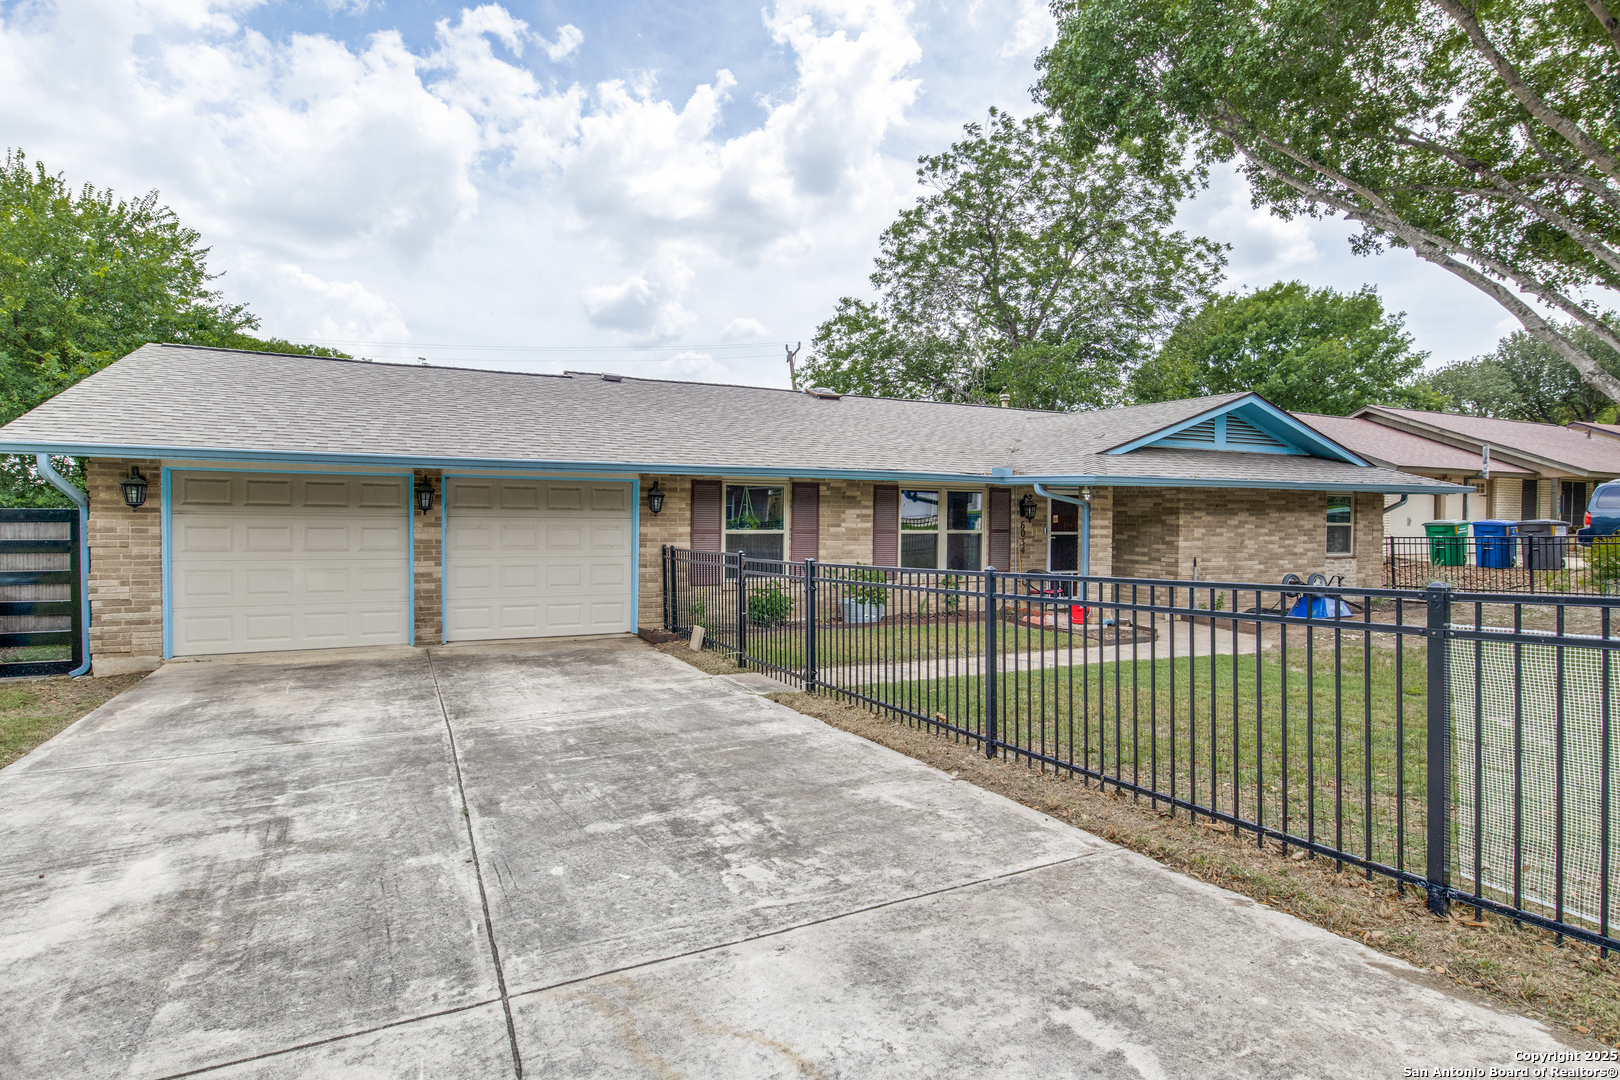
Active
$375,000
3
bds
|
2
ba
|
1,826
sqft
|
built
1973
6034 Royal Crk, San Antonio, TX 78239
$-959
Cash flow
-13.3%
Cash-on-Cash Return
2.6%
Cap rate
0.5%
Rent to Value Ratio
Active
$260,000
3
bds
|
2
ba
|
2,140
sqft
|
built
1960
9410 S Zarzamora St, San Antonio, TX 78224
$-533
Cash flow
-10.7%
Cash-on-Cash Return
3.2%
Cap rate
0.7%
Rent to Value Ratio
Active
$270,000
4
bds
|
2
ba
|
1,802
sqft
|
built
1986
3250 Bear Springs Dr, San Antonio, TX 78245
$-509
Cash flow
-9.8%
Cash-on-Cash Return
3.4%
Cap rate
0.6%
Rent to Value Ratio
Active
$559,000
3
bds
|
3
ba
|
2,317
sqft
|
built
1959
351 Northridge Dr, San Antonio, TX 78209
$-1,115
Cash flow
-10.4%
Cash-on-Cash Return
3.3%
Cap rate
0.6%
Rent to Value Ratio
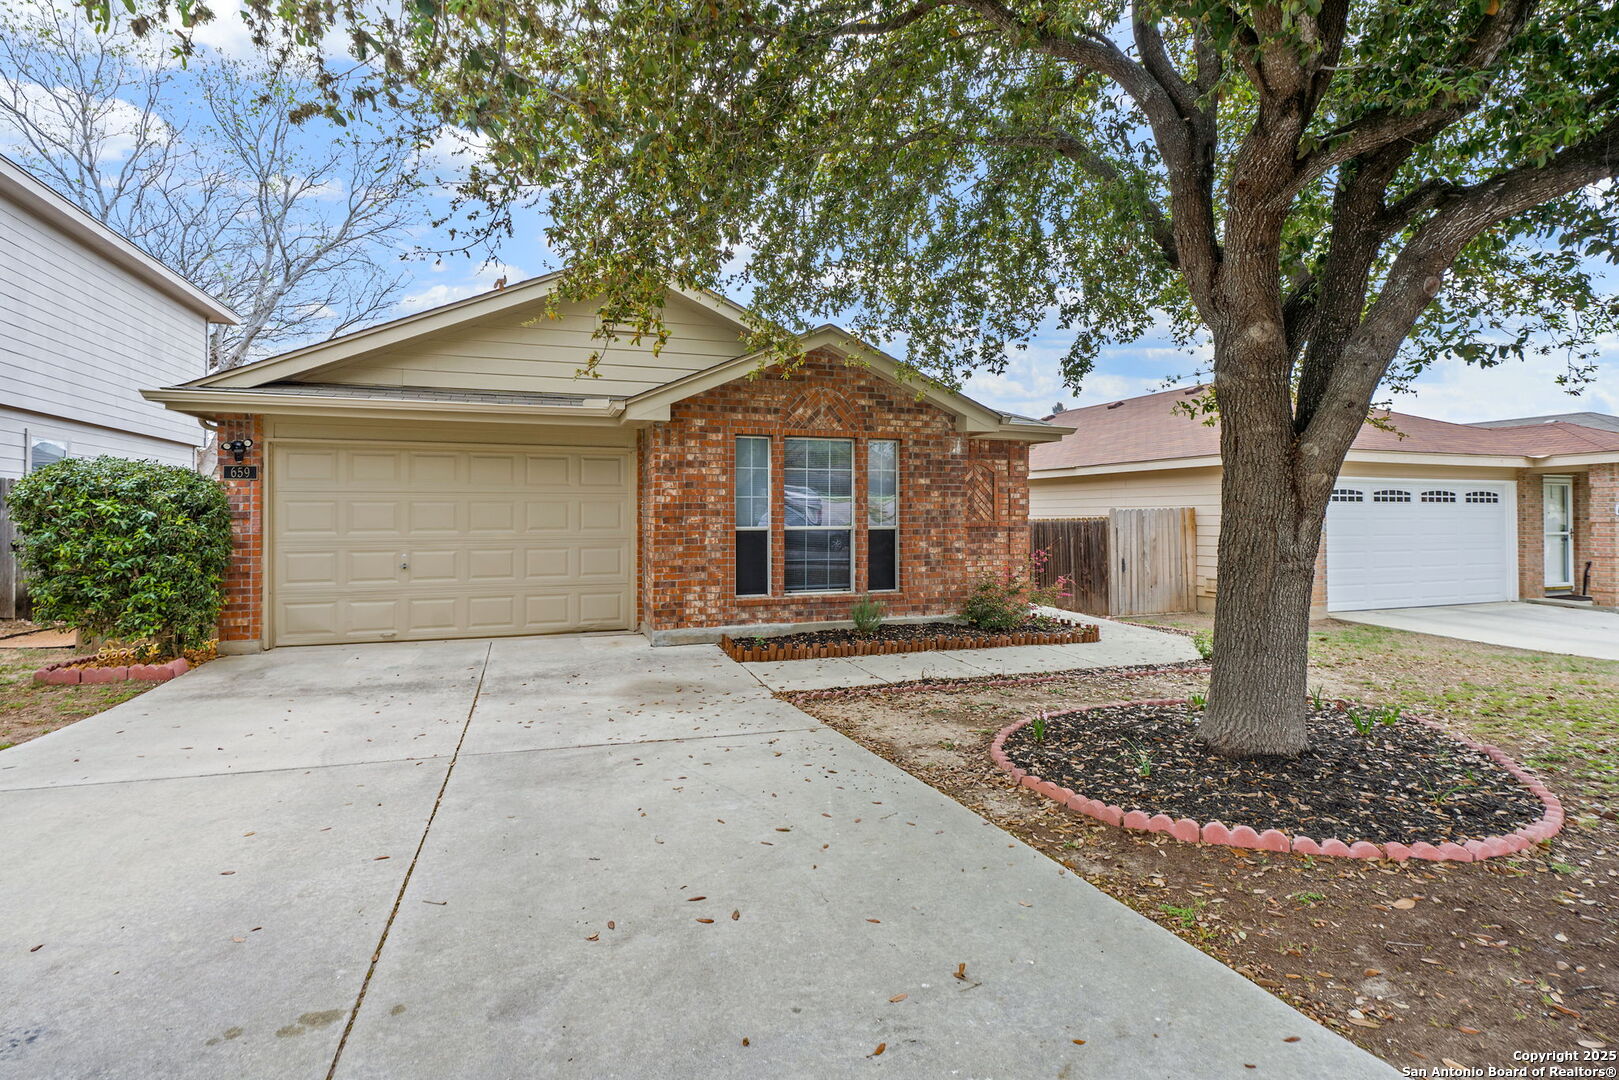
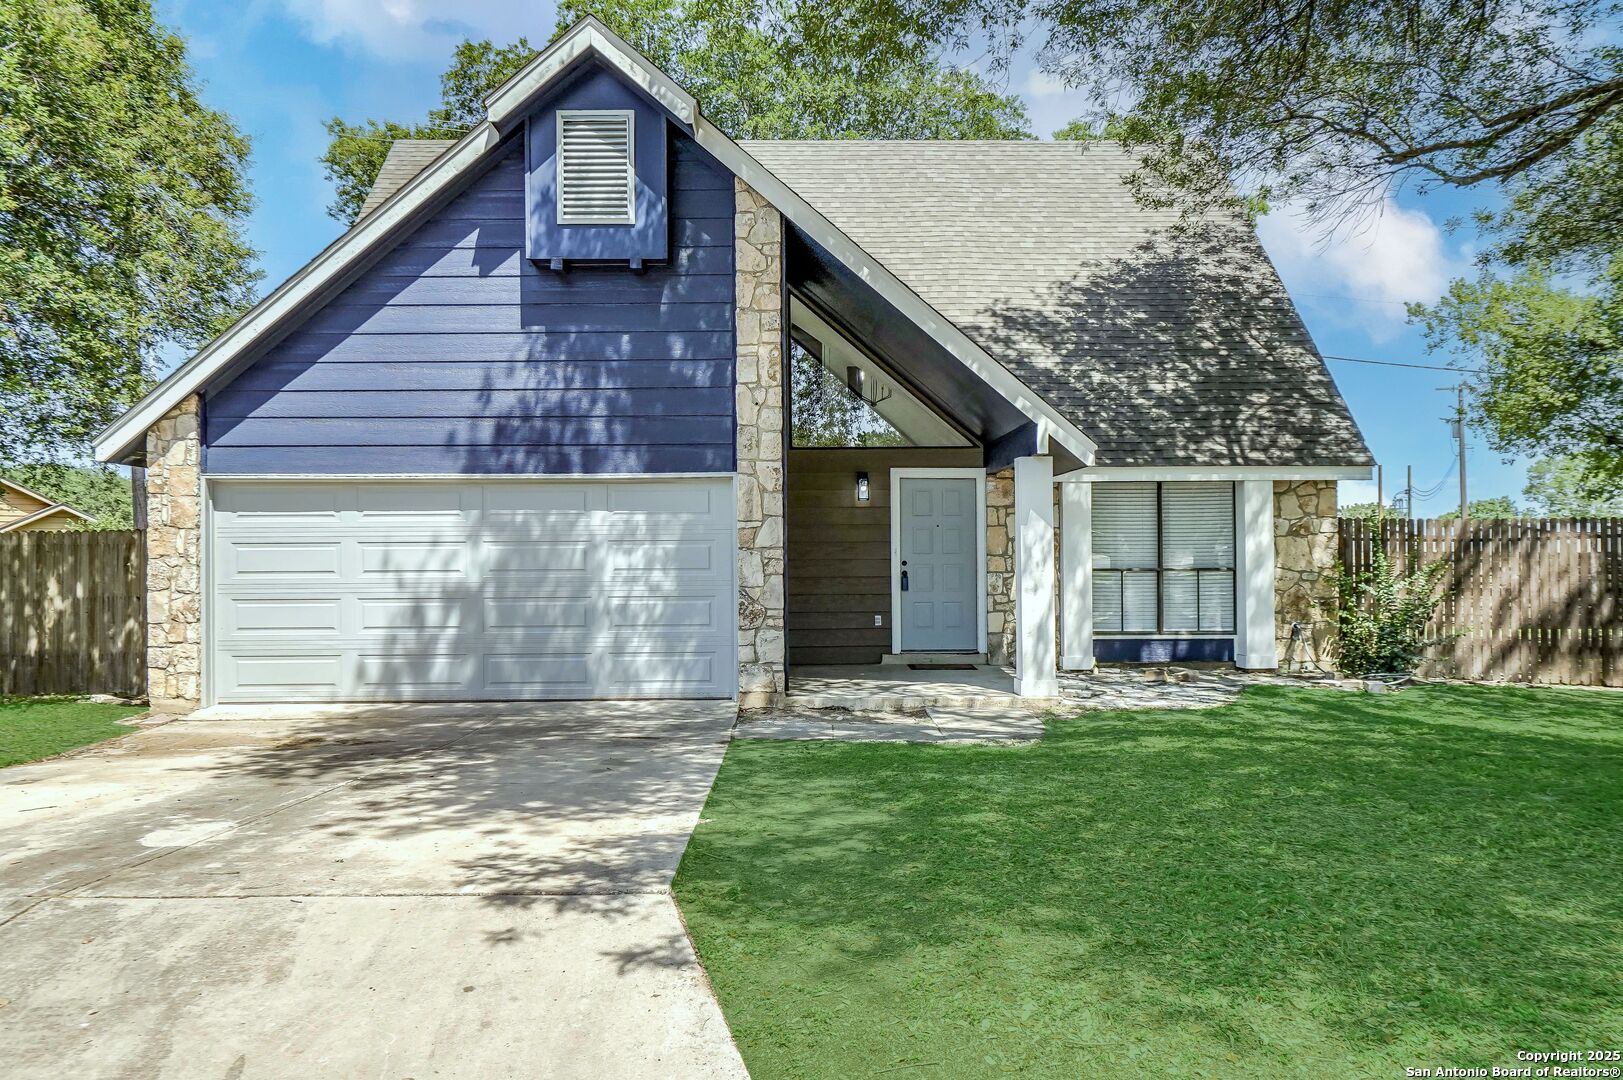
Active
$249,000
3
bds
|
2
ba
|
1,310
sqft
|
built
2004
659 Rattler Blf, San Antonio, TX 78251
$-524
Cash flow
-11.0%
Cash-on-Cash Return
3.2%
Cap rate
0.6%
Rent to Value Ratio
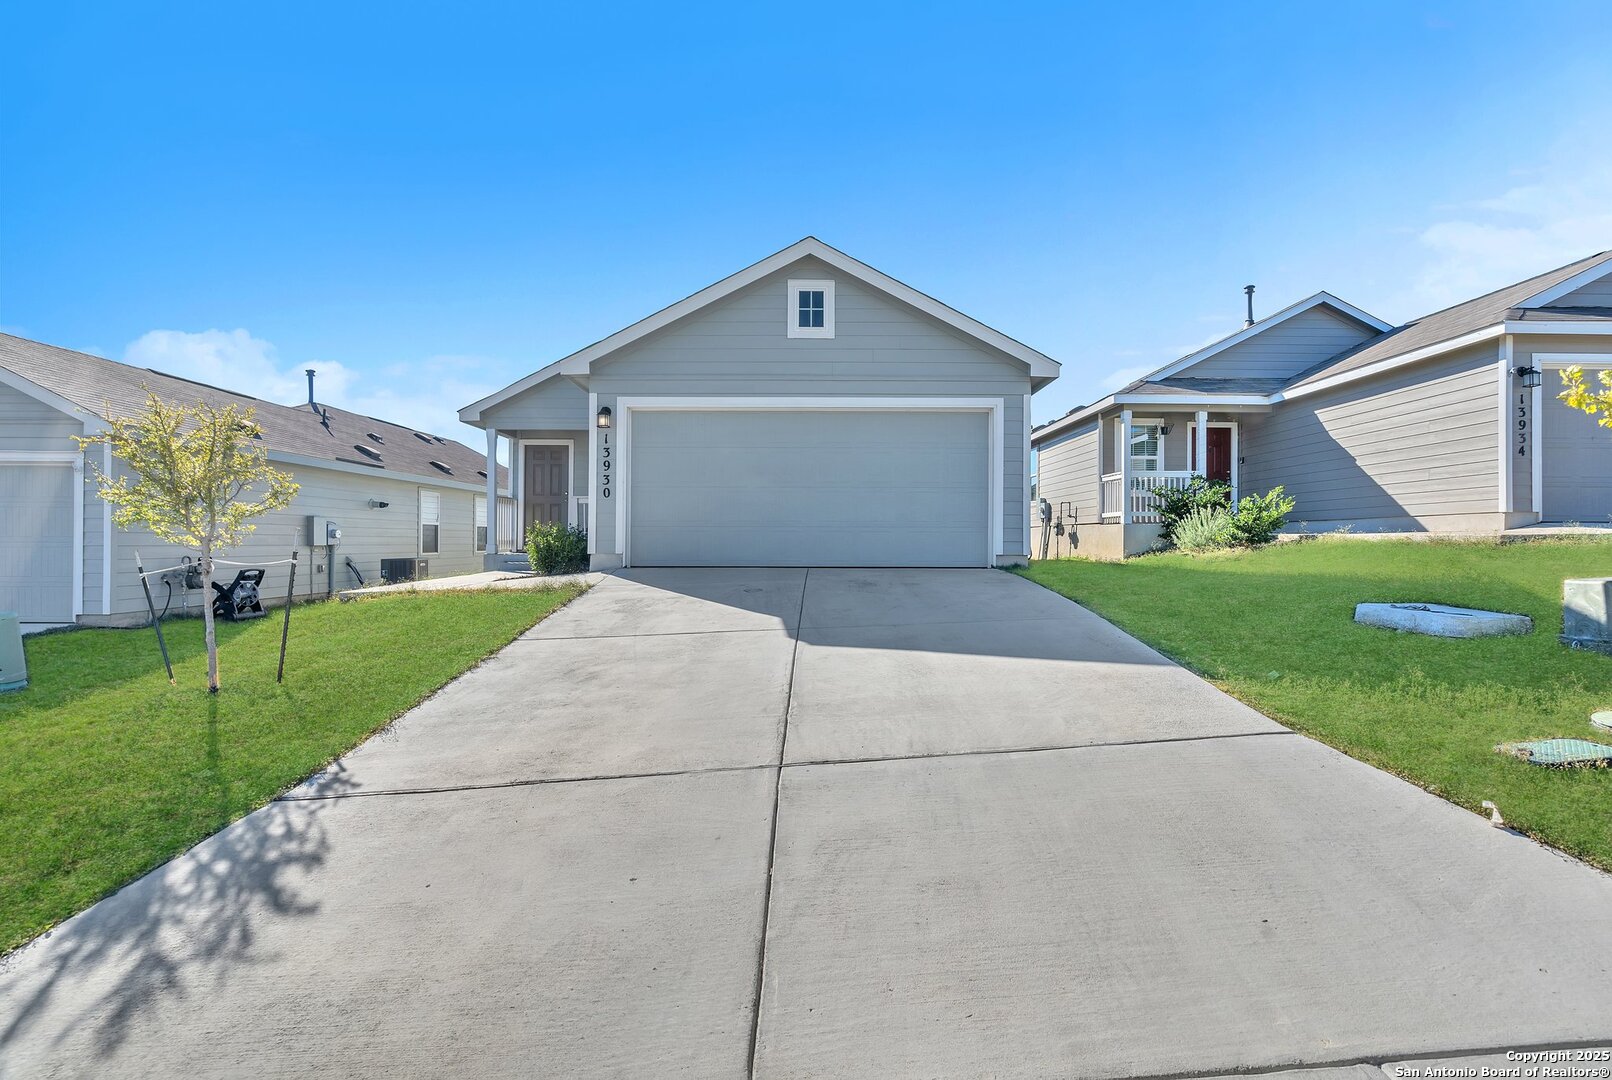
Active
$244,900
4
bds
|
2
ba
|
1,616
sqft
|
built
2021
13930 Silos Mdws, San Antonio, TX 78252
$-394
Cash flow
-8.4%
Cash-on-Cash Return
3.7%
Cap rate
0.7%
Rent to Value Ratio
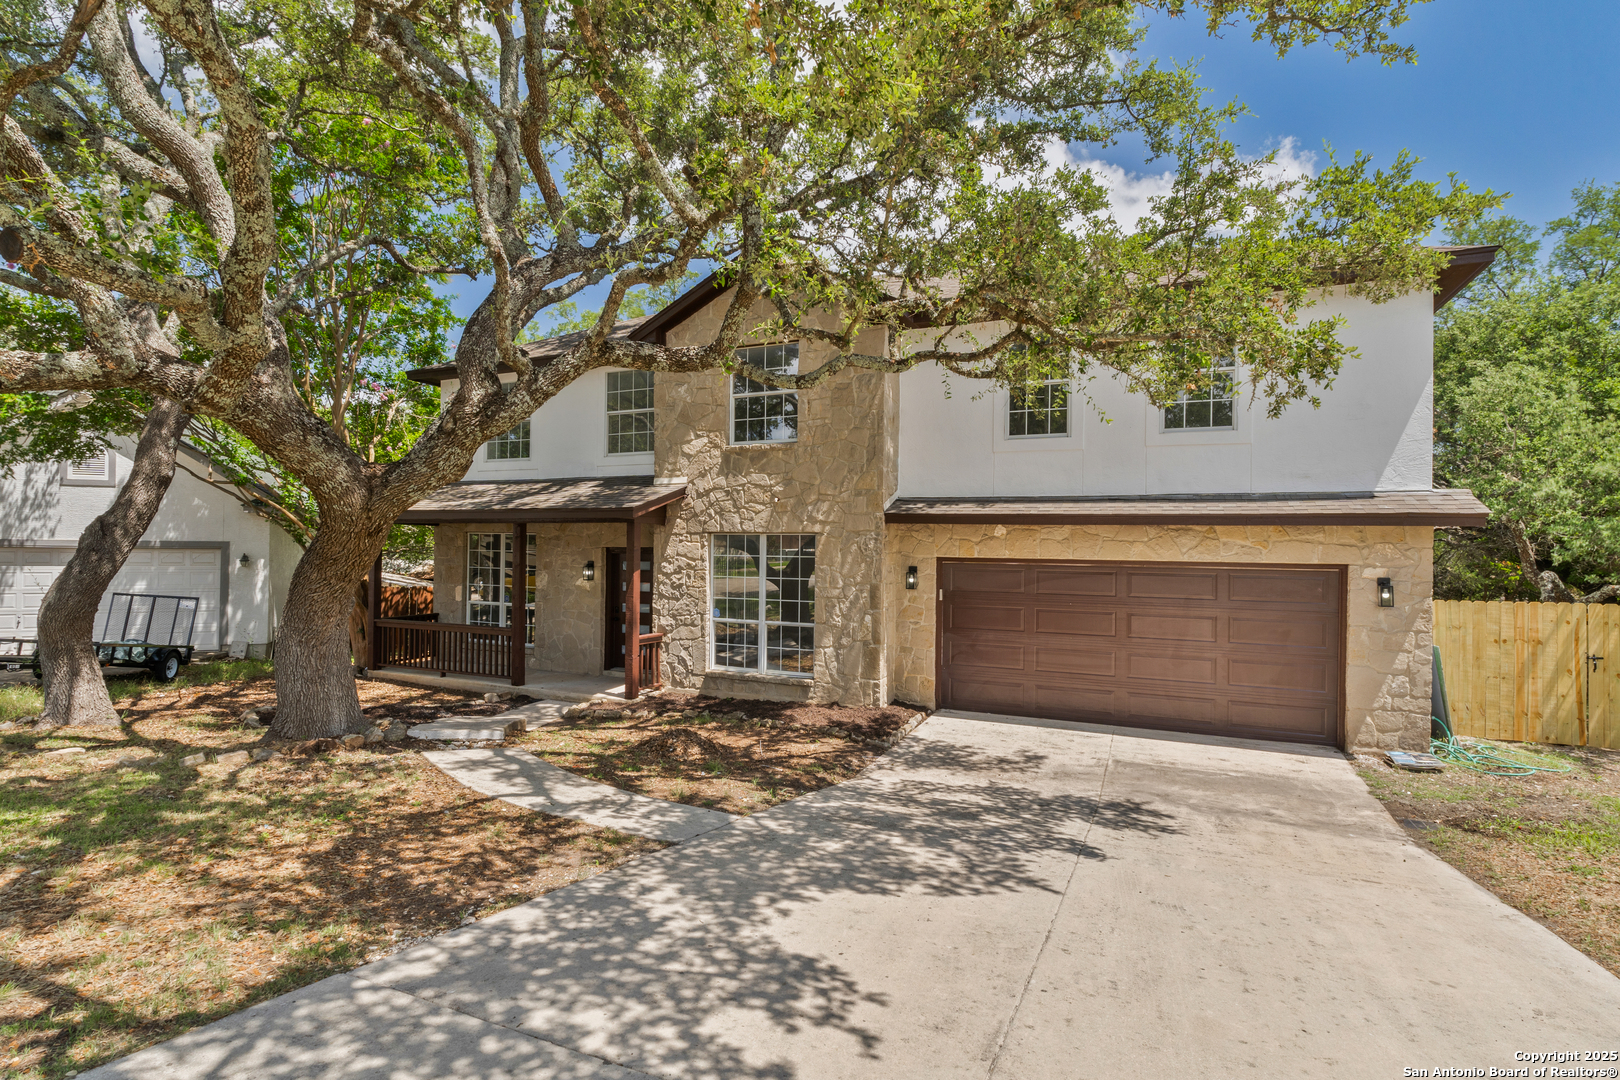
Active
$539,900
4
bds
|
4
ba
|
2,423
sqft
|
built
1996
907 Amigo Ave, San Antonio, TX 78260
$-1,169
Cash flow
-11.3%
Cash-on-Cash Return
3.1%
Cap rate
0.5%
Rent to Value Ratio
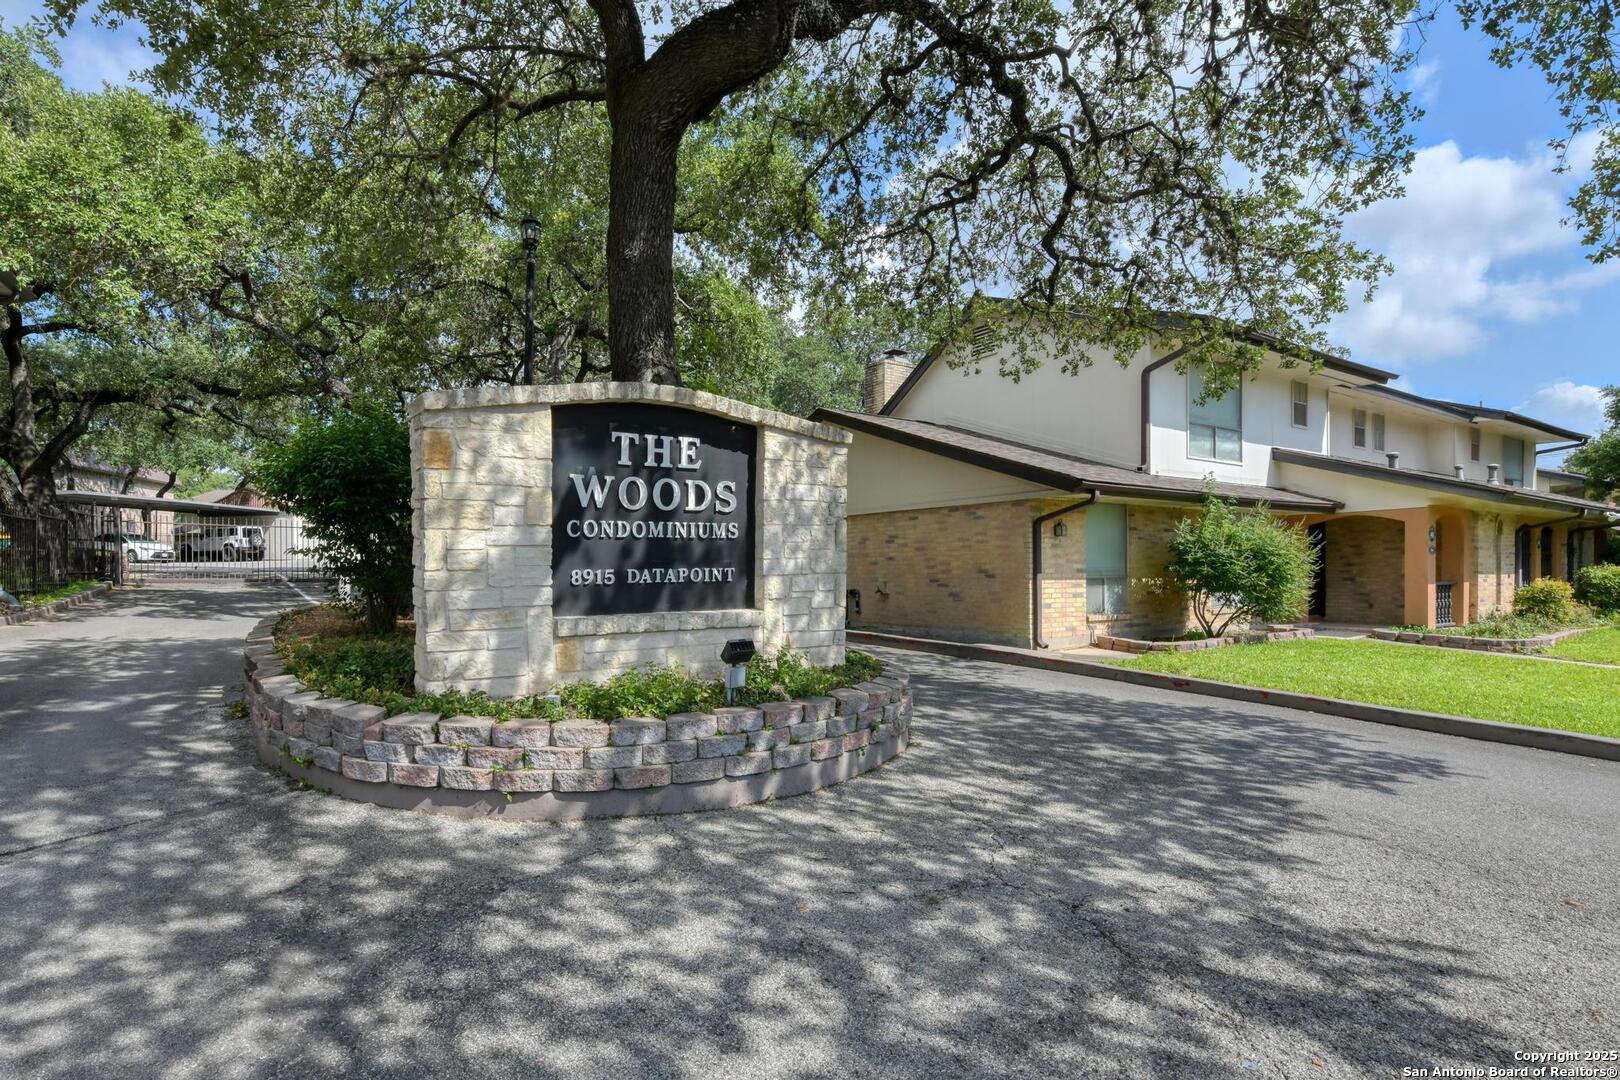
Active
$139,000
2
bds
|
2
ba
|
1,391
sqft
|
built
1973
8915 Datapoint Dr, San Antonio, TX 78229
$-688
Cash flow
-25.8%
Cash-on-Cash Return
-0.3%
Cap rate
1.1%
Rent to Value Ratio
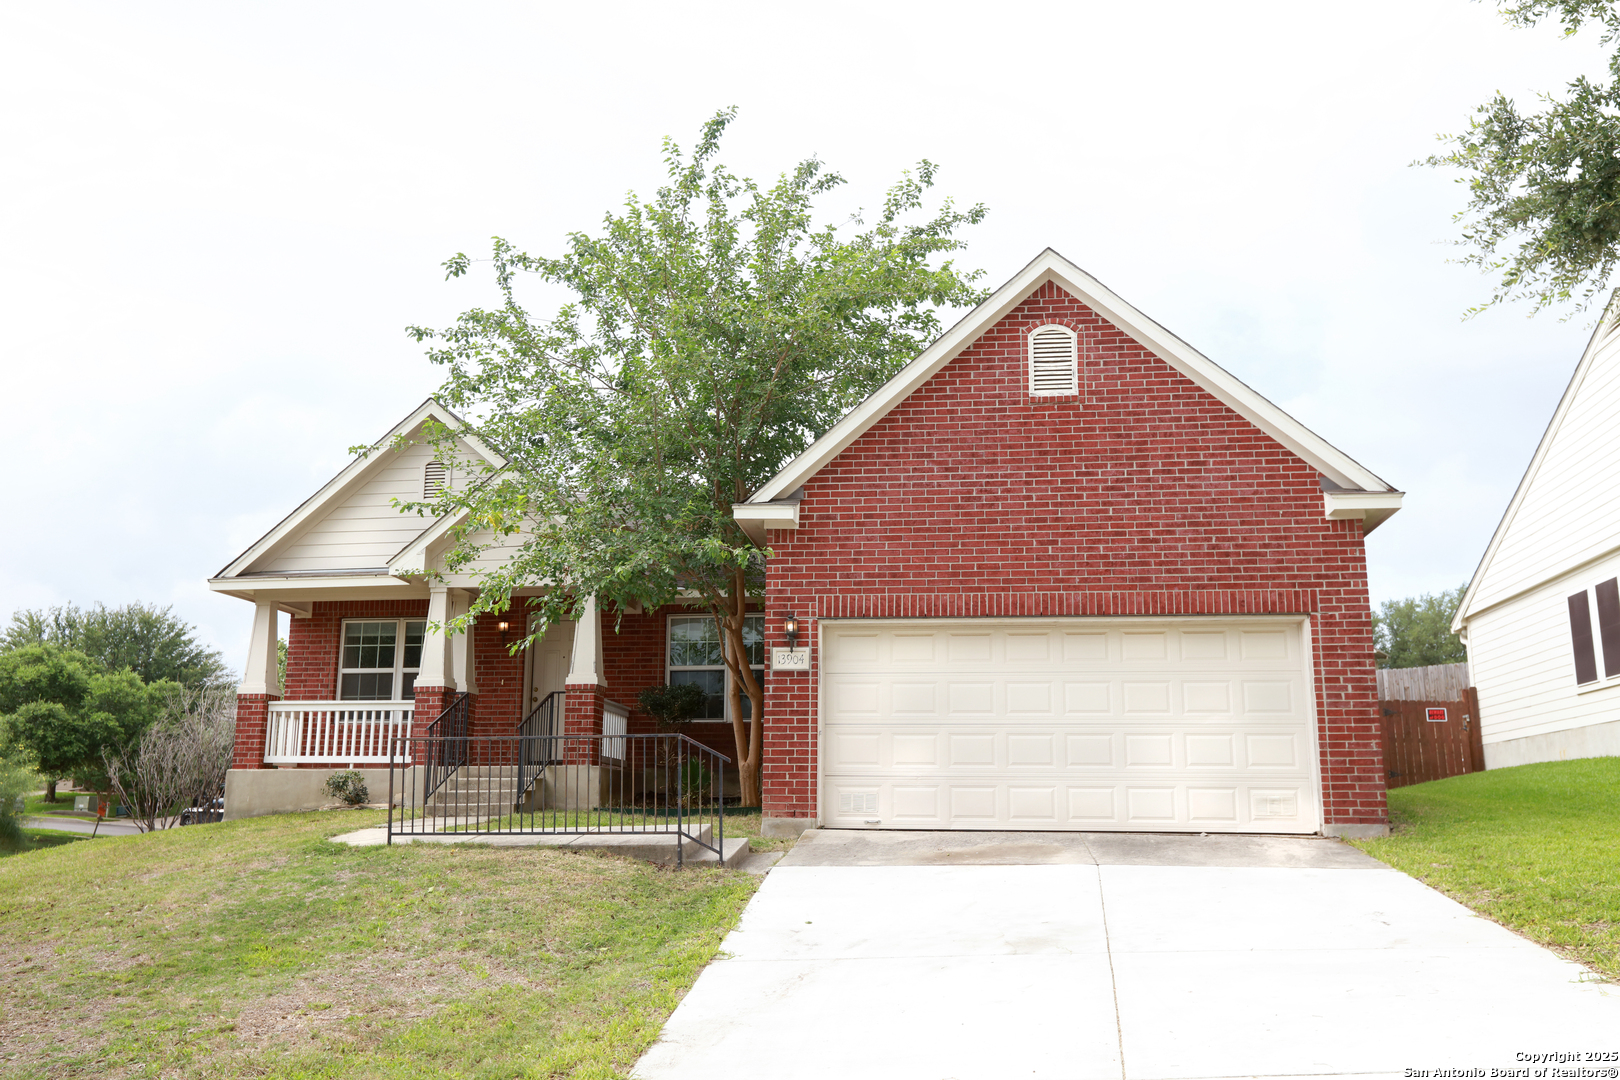
Active
$315,000
4
bds
|
2
ba
|
2,078
sqft
|
built
2005
13904 Bressani Way, San Antonio, TX 78233
$-853
Cash flow
-14.1%
Cash-on-Cash Return
2.4%
Cap rate
0.6%
Rent to Value Ratio
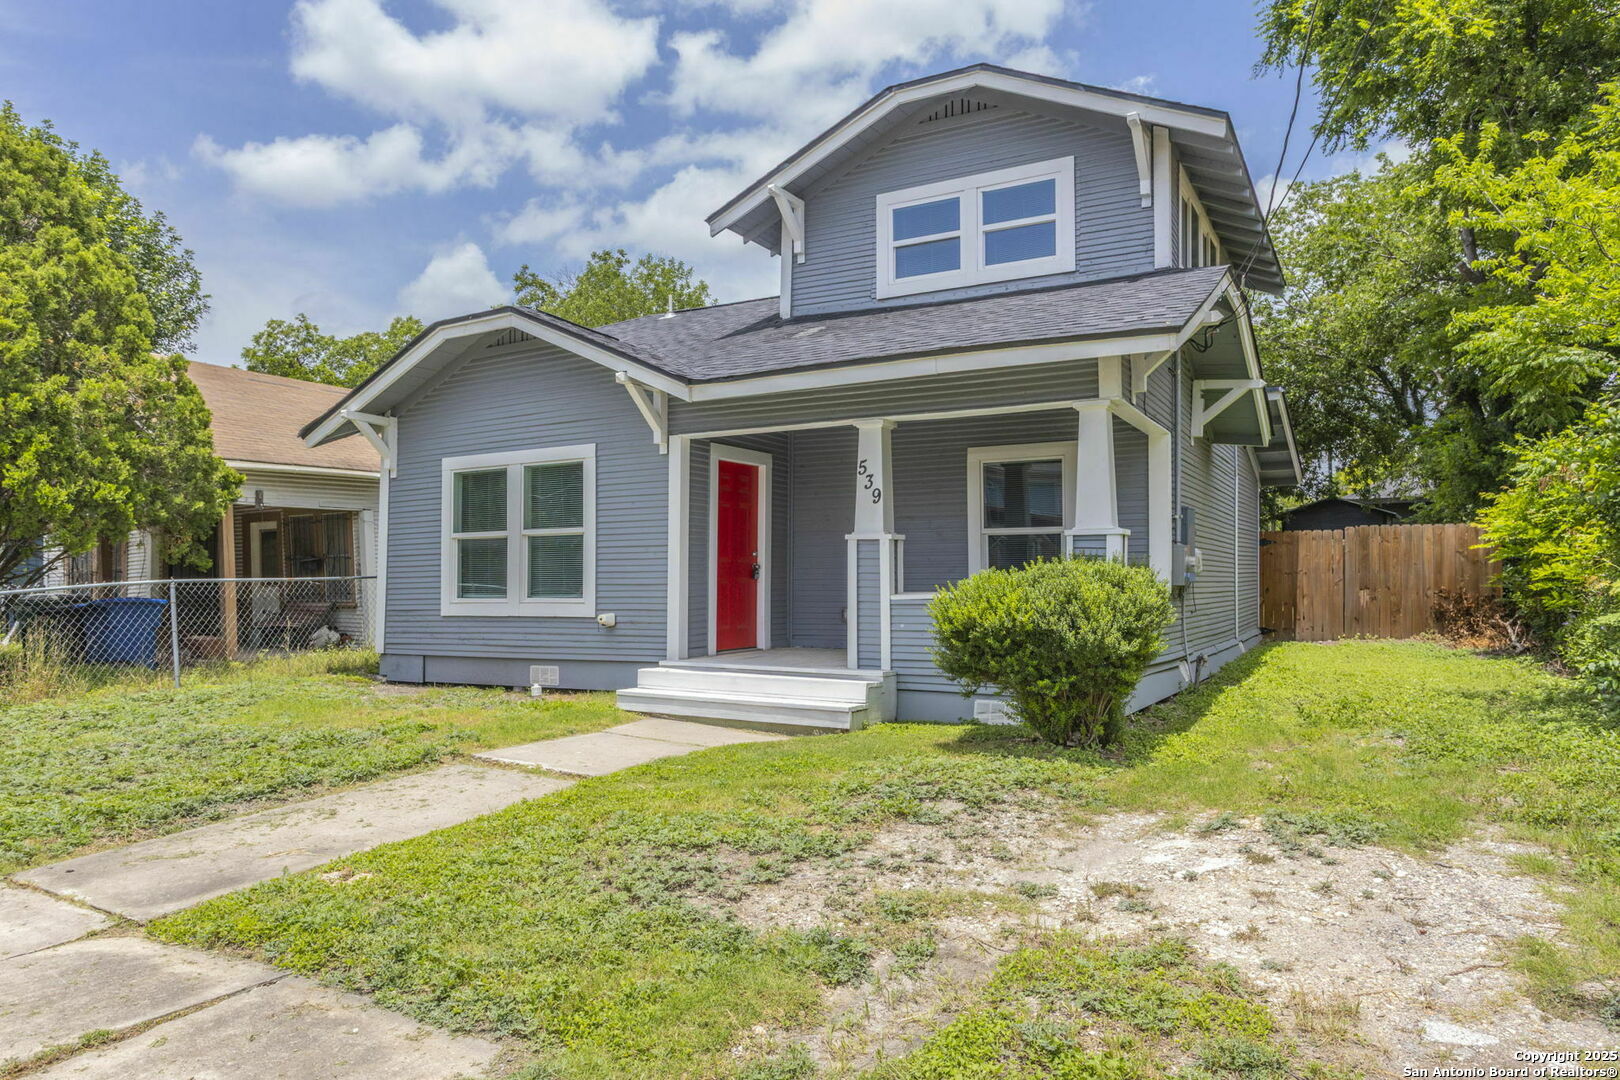
Active
$225,000
2
bds
|
2
ba
|
1,131
sqft
|
built
1904
539 Hicks Ave, San Antonio, TX 78210
$-227
Cash flow
-5.3%
Cash-on-Cash Return
4.5%
Cap rate
0.7%
Rent to Value Ratio
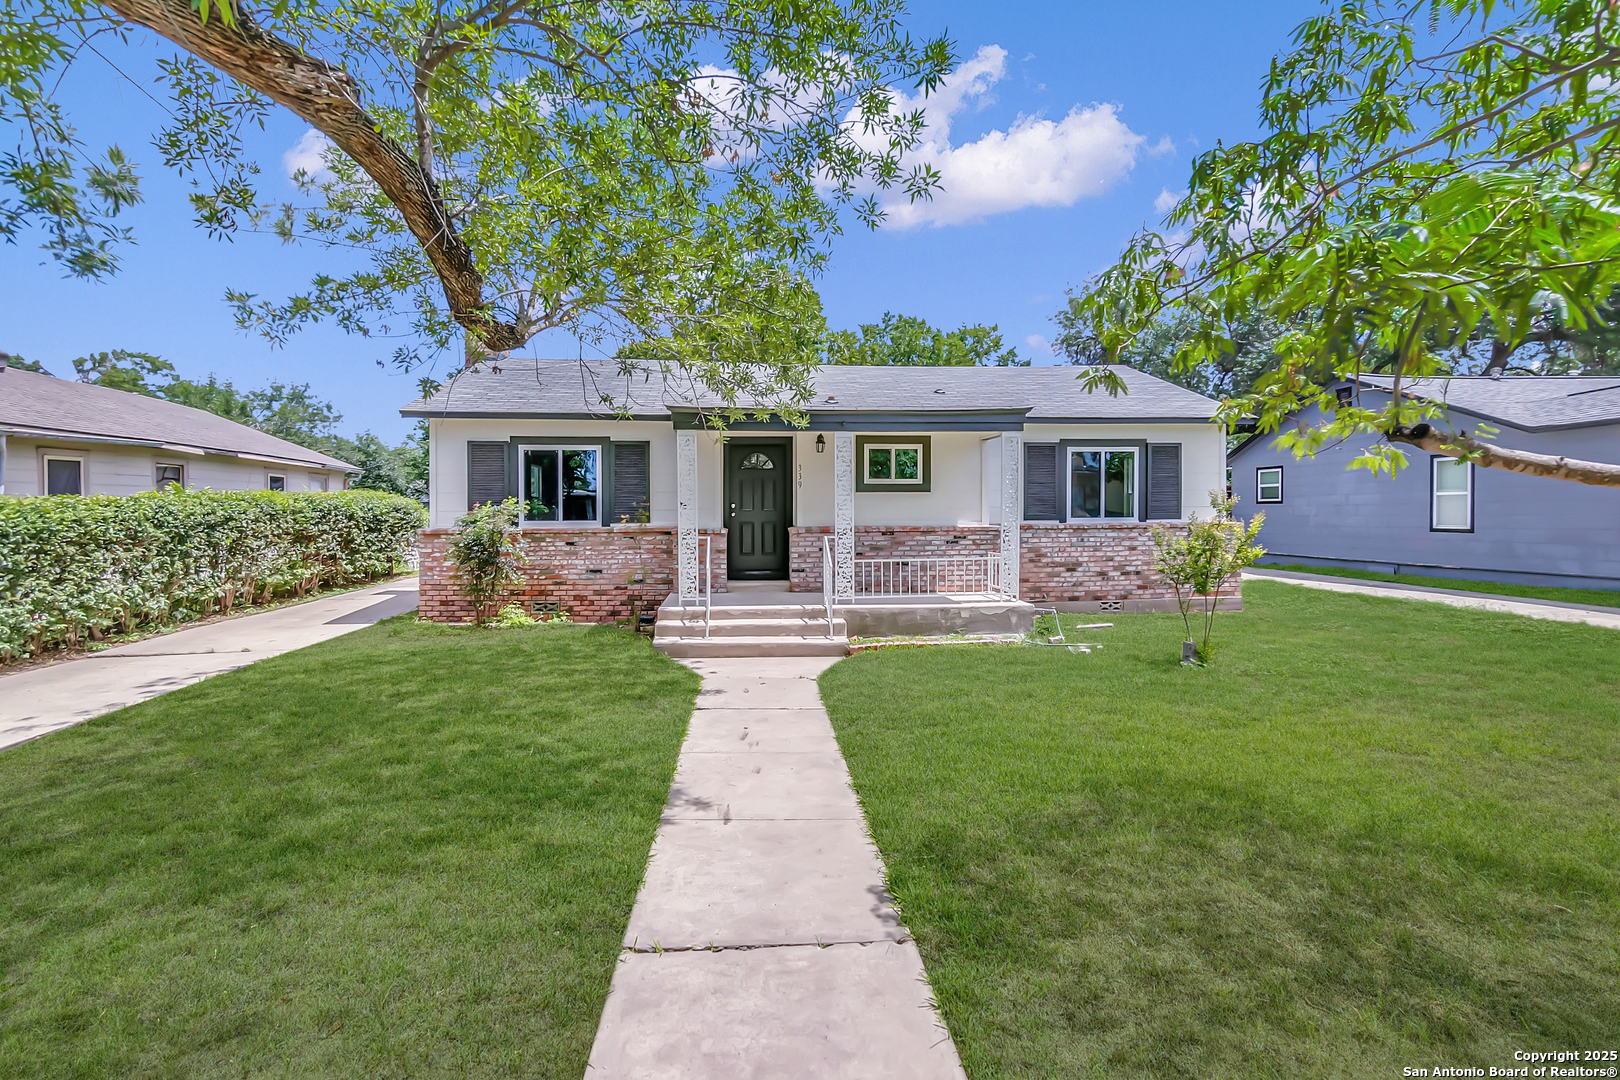
Active
$298,000
3
bds
|
2
ba
|
1,662
sqft
|
built
1948
339 Thorain Blvd, San Antonio, TX 78212
$-609
Cash flow
-10.7%
Cash-on-Cash Return
3.2%
Cap rate
0.6%
Rent to Value Ratio
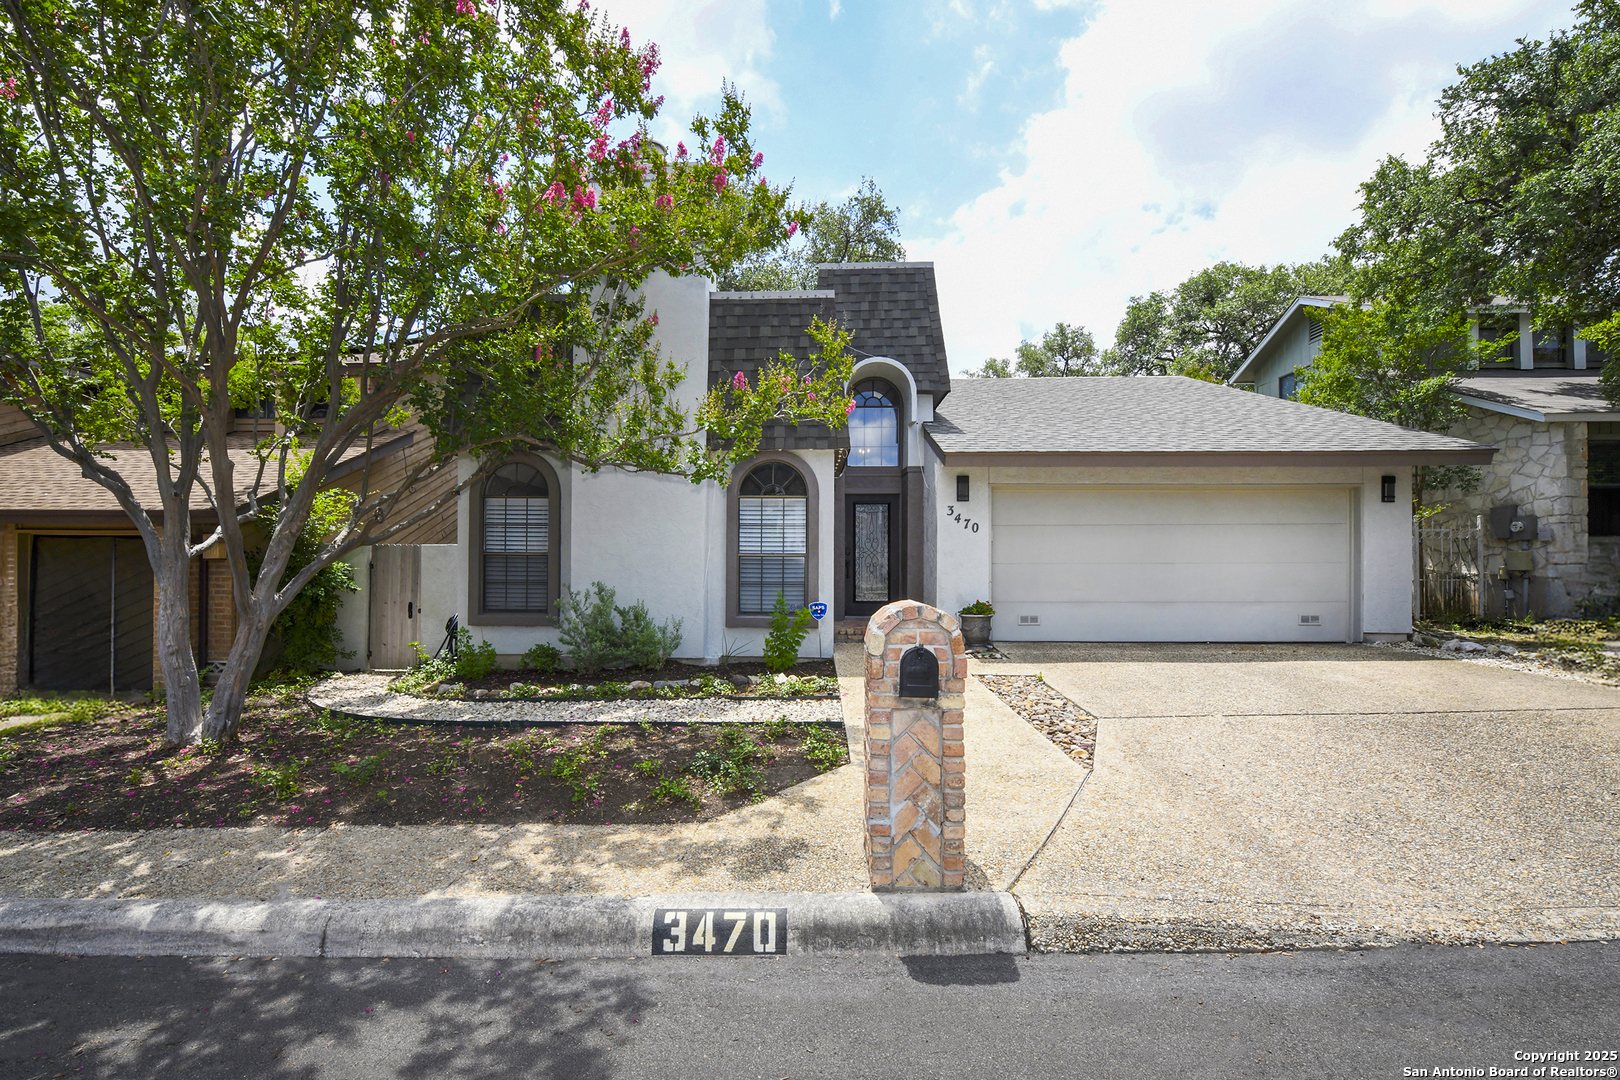
Active under contract
$400,000
3
bds
|
2
ba
|
2,066
sqft
|
built
1982
3470 River Path St, San Antonio, TX 78230
$-891
Cash flow
-11.6%
Cash-on-Cash Return
3.0%
Cap rate
0.6%
Rent to Value Ratio