San Antonio, TX Investment Properties for Sale
Browse homes for sale and investment properties in San Antonio, TX. Refine your search by price, property type, or more.
Best cash flowing properties in San Antonio, TX

Active
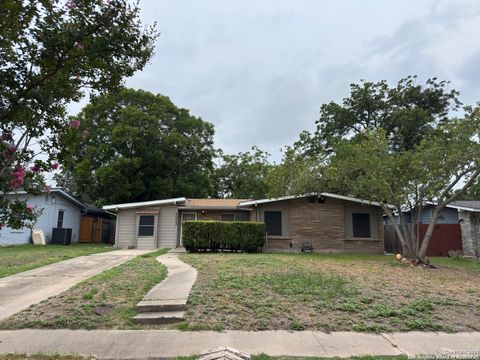
$175,000
4
bds
|
2
ba
|
1,036
sqft
|
built
1972
7330 Glen Cross, San Antonio, TX 78239
$-38
Cash flow
-1.1%
Cash-on-Cash Return
6.0%
Cap rate
0.9%
Rent to Value Ratio
Active
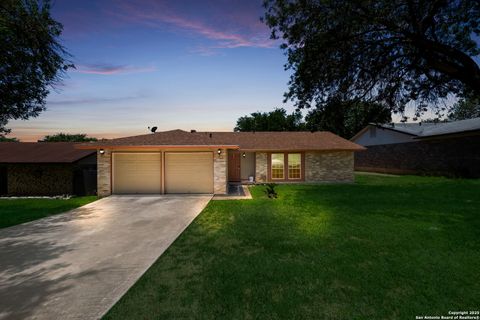
$170,000
3
bds
|
1
ba
|
1,273
sqft
|
built
1954
1715 Parnell Ave, San Antonio, TX 78224
$-137
Cash flow
-4.2%
Cash-on-Cash Return
5.3%
Cap rate
0.9%
Rent to Value Ratio
5,678 out of 5,956 properties for sale in San Antonio, TX
Limited Results Shown
Create a free account, or log in to reveal all property listings and enjoy the complete experience.

Active
$729,000
4
bds
|
3
ba
|
2,933
sqft
|
built
1981
13810 S Port Blf, San Antonio, TX 78216
$-2,677
Cash flow
-19.2%
Cash-on-Cash Return
1.9%
Cap rate
0.5%
Rent to Value Ratio

Active
$254,000
3
bds
|
2
ba
|
1,505
sqft
|
built
1970
14223 Brook Hollow Blvd, San Antonio, TX 78232
$-498
Cash flow
-10.2%
Cash-on-Cash Return
3.9%
Cap rate
0.7%
Rent to Value Ratio

Active
$199,995
2
bds
|
3
ba
|
942
sqft
|
built
1946
2336 E Houston St, San Antonio, TX 78202
$-738
Cash flow
-19.3%
Cash-on-Cash Return
1.8%
Cap rate
0.5%
Rent to Value Ratio

Active
$234,900
3
bds
|
3
ba
|
2,431
sqft
|
built
2007
24615 Corral Gables, San Antonio, TX 78261
$-265
Cash flow
-5.9%
Cash-on-Cash Return
4.9%
Cap rate
0.9%
Rent to Value Ratio

Active
$703,000
4
bds
|
2
ba
|
2,889
sqft
|
built
1993
424 Honey Oaks Ln, San Antonio, TX 78253
$-2,250
Cash flow
-16.7%
Cash-on-Cash Return
2.4%
Cap rate
0.5%
Rent to Value Ratio

Active
$163,000
1
bds
|
1
ba
|
760
sqft
|
built
1983
11815 Vance Jackson Rd, San Antonio, TX 78230
$-535
Cash flow
-17.1%
Cash-on-Cash Return
2.3%
Cap rate
0.8%
Rent to Value Ratio

Active
$332,900
3
bds
|
2
ba
|
1,584
sqft
|
built
1990
13934 Boulder Oaks, San Antonio, TX 78247
$-982
Cash flow
-15.4%
Cash-on-Cash Return
2.7%
Cap rate
0.5%
Rent to Value Ratio

Active
$226,999
3
bds
|
3
ba
|
1,365
sqft
|
built
2002
6943 Grapevine Lk, San Antonio, TX 78244
$-473
Cash flow
-10.9%
Cash-on-Cash Return
3.8%
Cap rate
0.7%
Rent to Value Ratio

Active
$600,000
3
bds
|
2
ba
|
2,276
sqft
|
built
2005
13607 Stagecoach Run, San Antonio, TX 78253
$-2,185
Cash flow
-19.0%
Cash-on-Cash Return
1.9%
Cap rate
0.4%
Rent to Value Ratio

Active
$285,000
4
bds
|
2
ba
|
2,025
sqft
|
built
2004
927 Magnolia Bnd, San Antonio, TX 78251
$-680
Cash flow
-12.4%
Cash-on-Cash Return
3.4%
Cap rate
0.7%
Rent to Value Ratio

Active
$289,900
3
bds
|
2
ba
|
1,742
sqft
|
built
2016
11828 Luckey Fls, San Antonio, TX 78252
$-687
Cash flow
-12.4%
Cash-on-Cash Return
3.4%
Cap rate
0.7%
Rent to Value Ratio

Active
$374,000
4
bds
|
3
ba
|
2,538
sqft
|
built
2004
26907 Sparrow Rdg, San Antonio, TX 78261
$-964
Cash flow
-13.4%
Cash-on-Cash Return
3.2%
Cap rate
0.6%
Rent to Value Ratio

Active
$524,900
4
bds
|
3
ba
|
3,197
sqft
|
built
2018
1939 Argos Star, San Antonio, TX 78245
$-1,466
Cash flow
-14.6%
Cash-on-Cash Return
2.9%
Cap rate
0.5%
Rent to Value Ratio

Active
$348,330
4
bds
|
3
ba
|
2,601
sqft
|
built
2022
10322 Lady Bird, San Antonio, TX 78252
$-888
Cash flow
-13.3%
Cash-on-Cash Return
3.2%
Cap rate
0.6%
Rent to Value Ratio

Active
$315,000
3
bds
|
3
ba
|
1,720
sqft
|
built
2018
9527 Butterfly Bnd, San Antonio, TX 78224
$-1,030
Cash flow
-17.1%
Cash-on-Cash Return
2.3%
Cap rate
0.6%
Rent to Value Ratio

Active
$265,000
4
bds
|
2
ba
|
1,611
sqft
|
built
1984
7220 Poss Rd, San Antonio, TX 78240
$-625
Cash flow
-12.3%
Cash-on-Cash Return
3.4%
Cap rate
0.7%
Rent to Value Ratio

Active
$489,000
4
bds
|
2
ba
|
1,552
sqft
|
built
1922
702 E Euclid Ave, San Antonio, TX 78212
$-1,530
Cash flow
-16.3%
Cash-on-Cash Return
2.5%
Cap rate
0.6%
Rent to Value Ratio

Active
$210,000
3
bds
|
3
ba
|
1,177
sqft
|
built
1985
9395 Village Lance, San Antonio, TX 78250
$-37,962
Cash flow
-943.2%
Cash-on-Cash Return
-210.7%
Cap rate
0.9%
Rent to Value Ratio

Active
$699,000
3
bds
|
2
ba
|
1,700
sqft
|
built
2020
9294 New Sulphur Springs Rd, San Antonio, TX 78263
$-3,155
Cash flow
-23.5%
Cash-on-Cash Return
0.8%
Cap rate
0.3%
Rent to Value Ratio

Active
$295,000
4
bds
|
2
ba
|
1,902
sqft
|
built
2021
4219 Laterite Trl, San Antonio, TX 78253
$-877
Cash flow
-15.5%
Cash-on-Cash Return
2.7%
Cap rate
0.7%
Rent to Value Ratio

Active
$200,000
4
bds
|
3
ba
|
2,111
sqft
|
built
2015
714 Halogen Way, San Antonio, TX 78221
$-187
Cash flow
-4.9%
Cash-on-Cash Return
5.1%
Cap rate
1.0%
Rent to Value Ratio

Active
$775,000
4
bds
|
3
ba
|
3,222
sqft
|
built
2001
23340 Wells Pt, San Antonio, TX 78261
$-2,878
Cash flow
-19.4%
Cash-on-Cash Return
1.8%
Cap rate
0.5%
Rent to Value Ratio

Active
$525,000
4
bds
|
5
ba
|
2,853
sqft
|
built
2008
23510 Canyon Golf Rd, San Antonio, TX 78258
$-1,488
Cash flow
-14.8%
Cash-on-Cash Return
2.9%
Cap rate
0.7%
Rent to Value Ratio

Active
$550,000
4
bds
|
3
ba
|
3,086
sqft
|
built
2015
8202 Two Fls, San Antonio, TX 78255
$-1,597
Cash flow
-15.1%
Cash-on-Cash Return
2.8%
Cap rate
0.6%
Rent to Value Ratio

Active
$234,999
3
bds
|
2
ba
|
1,169
sqft
|
built
1926
511 Meerscheidt St, San Antonio, TX 78203
$-611
Cash flow
-13.6%
Cash-on-Cash Return
3.1%
Cap rate
0.7%
Rent to Value Ratio

Active
$514,000
5
bds
|
4
ba
|
4,082
sqft
|
built
2018
8808 Chavez Path, San Antonio, TX 78254
$-1,550
Cash flow
-15.7%
Cash-on-Cash Return
2.6%
Cap rate
0.6%
Rent to Value Ratio

Active under contract
$299,900
3
bds
|
2
ba
|
1,587
sqft
|
built
1995
6326 Maverick Oak Dr, San Antonio, TX 78240
$-884
Cash flow
-15.4%
Cash-on-Cash Return
2.7%
Cap rate
0.6%
Rent to Value Ratio
Active
$1,198,999
5
bds
|
6
ba
|
4,593
sqft
|
built
2010
7439 Hovingham, San Antonio, TX 78257
$-4,774
Cash flow
-20.8%
Cash-on-Cash Return
1.5%
Cap rate
0.4%
Rent to Value Ratio

Pending
$250,000
3
bds
|
2
ba
|
1,477
sqft
|
built
1983
9501 Wildwood Rdg, San Antonio, TX 78250
$-597
Cash flow
-12.5%
Cash-on-Cash Return
3.4%
Cap rate
0.7%
Rent to Value Ratio

Active
$235,000
3
bds
|
3
ba
|
1,472
sqft
|
built
2022
1025 Pacific Monarch, San Antonio, TX 78253
$-560
Cash flow
-12.4%
Cash-on-Cash Return
3.4%
Cap rate
0.8%
Rent to Value Ratio

Active
$233,400
3
bds
|
2
ba
|
1,450
sqft
|
built
2019
10222 Robbins Blf, San Antonio, TX 78245
$-540
Cash flow
-12.1%
Cash-on-Cash Return
3.5%
Cap rate
0.7%
Rent to Value Ratio

Active
$240,000
3
bds
|
2
ba
|
1,398
sqft
|
built
1921
508 Thompson Pl, San Antonio, TX 78225
$-326
Cash flow
-7.1%
Cash-on-Cash Return
4.6%
Cap rate
0.8%
Rent to Value Ratio

Active
$289,900
5
bds
|
3
ba
|
2,670
sqft
|
built
1951
2310 W Gramercy Pl, San Antonio, TX 78201
$-580
Cash flow
-10.4%
Cash-on-Cash Return
3.9%
Cap rate
0.9%
Rent to Value Ratio

Active
$285,000
3
bds
|
2
ba
|
1,838
sqft
|
built
2015
627 Sea Eagle, San Antonio, TX 78253
$-668
Cash flow
-12.2%
Cash-on-Cash Return
3.5%
Cap rate
0.7%
Rent to Value Ratio

Active
$1,650,000
4
bds
|
4
ba
|
3,320
sqft
|
built
1946
227 E Sunset Rd, San Antonio, TX 78209
$-7,809
Cash flow
-24.7%
Cash-on-Cash Return
0.6%
Cap rate
0.2%
Rent to Value Ratio

Active
$290,000
3
bds
|
3
ba
|
1,769
sqft
|
built
2021
7639 Coffee Ml, San Antonio, TX 78252
$-821
Cash flow
-14.8%
Cash-on-Cash Return
2.9%
Cap rate
0.6%
Rent to Value Ratio
Active
$175,000
4
bds
|
2
ba
|
1,036
sqft
|
built
1972
7330 Glen Cross, San Antonio, TX 78239
$-38
Cash flow
-1.1%
Cash-on-Cash Return
6.0%
Cap rate
0.9%
Rent to Value Ratio

Active
$283,500
3
bds
|
3
ba
|
1,812
sqft
|
built
2012
25107 Cambridge Wl, San Antonio, TX 78261
$-571
Cash flow
-10.5%
Cash-on-Cash Return
3.8%
Cap rate
0.7%
Rent to Value Ratio
Active
$170,000
3
bds
|
1
ba
|
1,273
sqft
|
built
1954
1715 Parnell Ave, San Antonio, TX 78224
$-137
Cash flow
-4.2%
Cash-on-Cash Return
5.3%
Cap rate
0.9%
Rent to Value Ratio
Active
$242,500
3
bds
|
2
ba
|
1,426
sqft
|
built
1982
1027 Gallatin Dr, San Antonio, TX 78245
$-419
Cash flow
-9.0%
Cash-on-Cash Return
4.2%
Cap rate
0.7%
Rent to Value Ratio