Sanford, FL Investment Properties for Sale
Browse homes for sale and investment properties in Sanford, FL. Refine your search by price, property type, or more.
Best cash flowing properties in Sanford, FL
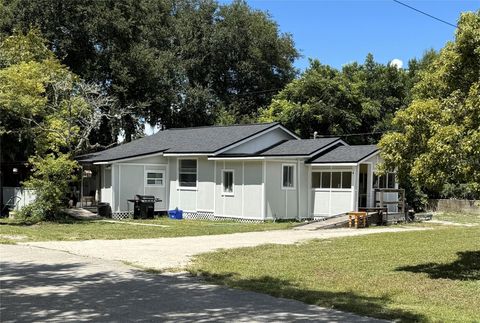
Active
$375,000
5
bds
|
3
ba
|
1,350
sqft
|
built
1926
300 Hibiscus Dr, Sanford, FL 32773
$-673
Cash flow
-9.4%
Cash-on-Cash Return
4.0%
Cap rate
0.6%
Rent to Value Ratio
Active
$300,000
4
bds
|
0
ba
|
1,452
sqft
|
built
1938
1511 W 12th St, Sanford, FL 32771
$-783
Cash flow
-13.6%
Cash-on-Cash Return
3.0%
Cap rate
0.5%
Rent to Value Ratio
5 out of 5 properties for sale in Sanford, FL
Limited Results Shown
Create a free account, or log in to reveal all property listings and enjoy the complete experience.
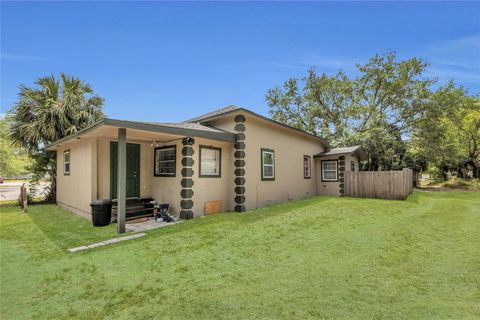
Active
$625,000
4
bds
|
4
ba
|
2,304
sqft
|
built
1925
1201 S Myrtle Ave, Sanford, FL 32771
$-2,514
Cash flow
-21.0%
Cash-on-Cash Return
1.3%
Cap rate
0.3%
Rent to Value Ratio
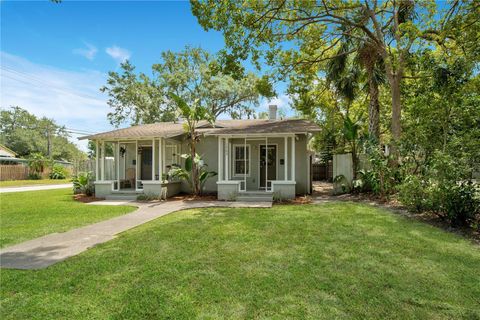
Active
$435,000
4
bds
|
3
ba
|
1,592
sqft
|
built
1930
2508 Yale Ave, Sanford, FL 32773
$-1,409
Cash flow
-16.9%
Cash-on-Cash Return
2.3%
Cap rate
0.4%
Rent to Value Ratio
Active
$300,000
4
bds
|
0
ba
|
1,452
sqft
|
built
1938
1511 W 12th St, Sanford, FL 32771
$-783
Cash flow
-13.6%
Cash-on-Cash Return
3.0%
Cap rate
0.5%
Rent to Value Ratio
Active
$375,000
5
bds
|
3
ba
|
1,350
sqft
|
built
1926
300 Hibiscus Dr, Sanford, FL 32773
$-673
Cash flow
-9.4%
Cash-on-Cash Return
4.0%
Cap rate
0.6%
Rent to Value Ratio

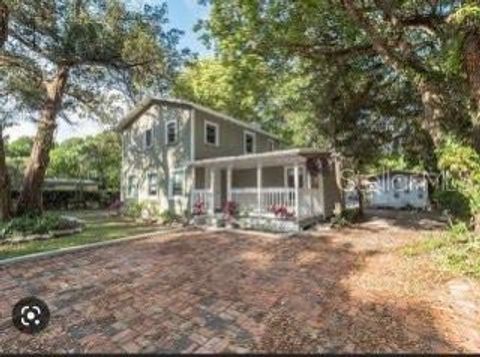
Active
$1,477,700
9
bds
|
9
ba
|
6,112
sqft
|
built
1901
318 S Palmetto Ave, Sanford, FL 32771
$-6,337
Cash flow
-22.4%
Cash-on-Cash Return
1.0%
Cap rate
0.2%
Rent to Value Ratio