Seabrook, TX Investment Properties for Sale
Browse homes for sale and investment properties in Seabrook, TX. Refine your search by price, property type, or more.
Best cash flowing properties in Seabrook, TX
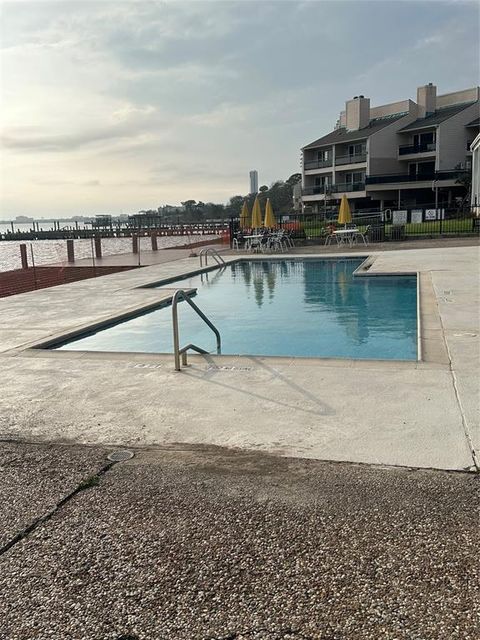
Active
$80,000
1
bds
|
1
ba
|
725
sqft
|
built
1978
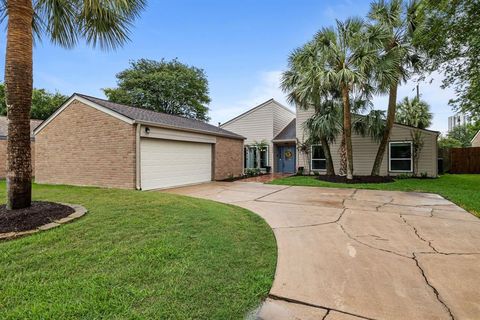
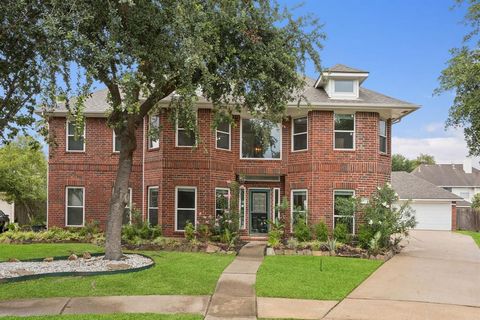
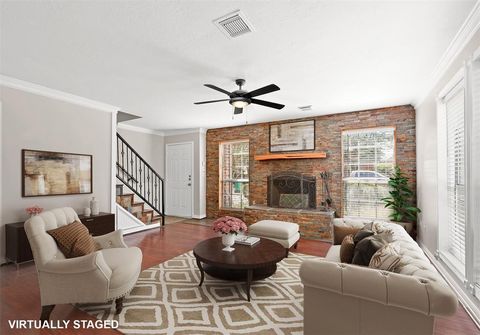
3535 Nasa Pkwy, Seabrook, TX 77586
$-159
Cash flow
-10.4%
Cash-on-Cash Return
3.3%
Cap rate
1.6%
Rent to Value Ratio

Active
$114,900
2
bds
|
0
ba
|
1,107
sqft
|
built
1978
3535 Nasa Pkwy, Seabrook, TX 77586
$-270
Cash flow
-12.3%
Cash-on-Cash Return
3.4%
Cap rate
1.4%
Rent to Value Ratio
125 out of 130 properties for sale in Seabrook, TX
Limited Results Shown
Create a free account, or log in to reveal all property listings and enjoy the complete experience.

Active
$86,900
1
bds
|
0
ba
|
725
sqft
|
built
1978
3535 Nasa Pkwy, Seabrook, TX 77586
$-348
Cash flow
-20.9%
Cash-on-Cash Return
1.5%
Cap rate
1.3%
Rent to Value Ratio

Active
$1,099,999
4
bds
|
0
ba
|
3,224
sqft
|
built
2003
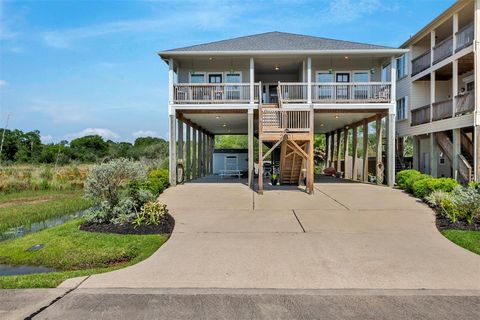
2938 N Island Dr, Seabrook, TX 77586
$-2,861
Cash flow
-13.6%
Cash-on-Cash Return
3.1%
Cap rate
0.6%
Rent to Value Ratio
Active
$273,000
3
bds
|
0
ba
|
2,307
sqft
|
built
1962
2010 Oceanview Dr, Seabrook, TX 77586
$-1,246
Cash flow
-23.8%
Cash-on-Cash Return
0.8%
Cap rate
0.3%
Rent to Value Ratio
Active
$925,000
3
bds
|
0
ba
|
4,255
sqft
|
built
1999
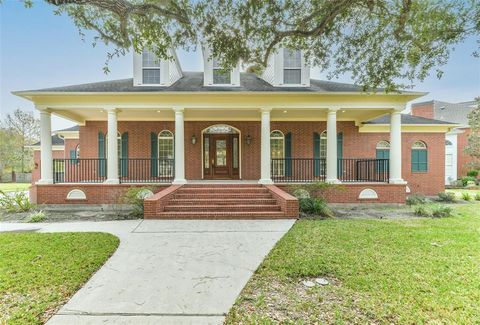
1310 Bluebonnet Dr, Seabrook, TX 77586
$-2,809
Cash flow
-15.8%
Cash-on-Cash Return
2.6%
Cap rate
0.5%
Rent to Value Ratio

Active
$430,000
4
bds
|
0
ba
|
2,816
sqft
|
built
2002
2119 Water Way, Seabrook, TX 77586
$-832
Cash flow
-10.1%
Cash-on-Cash Return
3.9%
Cap rate
0.7%
Rent to Value Ratio
Active
$660,000
3
bds
|
0
ba
|
1,700
sqft
|
built
2022
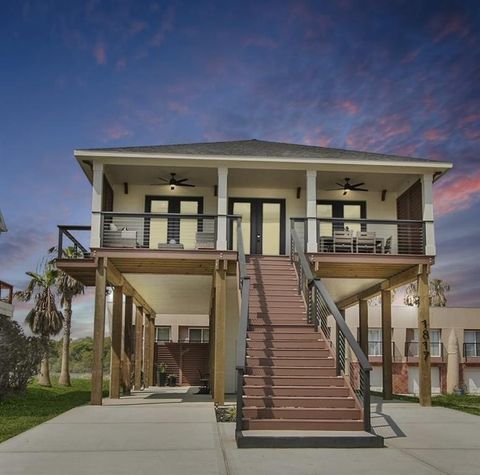
1817 Todville Rd, Seabrook, TX 77586
$-1,563
Cash flow
-12.4%
Cash-on-Cash Return
3.4%
Cap rate
0.6%
Rent to Value Ratio
Active
$374,900
4
bds
|
0
ba
|
2,673
sqft
|
built
1976
4322 Shady Springs Dr, Seabrook, TX 77586
$-738
Cash flow
-10.3%
Cash-on-Cash Return
3.9%
Cap rate
0.7%
Rent to Value Ratio

Active
$555,000
3
bds
|
0
ba
|
1,800
sqft
|
built
2005
711 Todville Rd, Seabrook, TX 77586
$-1,798
Cash flow
-16.9%
Cash-on-Cash Return
2.4%
Cap rate
0.5%
Rent to Value Ratio

Active
$380,000
5
bds
|
0
ba
|
2,886
sqft
|
built
1974
1115 Woodbank Dr, Seabrook, TX 77586
$-827
Cash flow
-11.4%
Cash-on-Cash Return
3.7%
Cap rate
0.8%
Rent to Value Ratio

Active
$455,000
4
bds
|
0
ba
|
2,926
sqft
|
built
1972
1015 Willow Vale Dr, Seabrook, TX 77586
$-432
Cash flow
-5.0%
Cash-on-Cash Return
5.1%
Cap rate
0.8%
Rent to Value Ratio

Active
$416,000
3
bds
|
0
ba
|
1,800
sqft
|
built
1981
1002 Staples Ave, Seabrook, TX 77586
$-1,202
Cash flow
-15.1%
Cash-on-Cash Return
2.8%
Cap rate
0.5%
Rent to Value Ratio

Active
$425,000
4
bds
|
0
ba
|
2,696
sqft
|
built
1997
2521 Sea Horse Ct, Seabrook, TX 77586
$-719
Cash flow
-8.8%
Cash-on-Cash Return
3.6%
Cap rate
0.7%
Rent to Value Ratio
Active
$424,900
4
bds
|
3.5
ba
|
3,546
sqft
|
built
2000
2613 Broussard Ct, Seabrook, TX 77586
$-566
Cash flow
-6.9%
Cash-on-Cash Return
4.1%
Cap rate
0.7%
Rent to Value Ratio
Active
$1,050,000
5
bds
|
0
ba
|
4,063
sqft
|
built
2000
2922 N Island Dr, Seabrook, TX 77586
$-1,898
Cash flow
-9.4%
Cash-on-Cash Return
4.1%
Cap rate
0.7%
Rent to Value Ratio
Active
$1,195,000
5
bds
|
0
ba
|
4,372
sqft
|
built
2006
2417 Blue Canoe Ct, Seabrook, TX 77586
$-2,828
Cash flow
-12.3%
Cash-on-Cash Return
3.4%
Cap rate
0.7%
Rent to Value Ratio

Active
$390,000
5
bds
|
0
ba
|
3,253
sqft
|
built
2010
801 Dawn Ridge Way, Seabrook, TX 77586
$-626
Cash flow
-8.4%
Cash-on-Cash Return
4.3%
Cap rate
0.8%
Rent to Value Ratio

Active
$407,000
5
bds
|
0
ba
|
3,129
sqft
|
built
2002
2222 Scenic Shore Dr, Seabrook, TX 77586
$-650
Cash flow
-8.3%
Cash-on-Cash Return
4.3%
Cap rate
0.8%
Rent to Value Ratio
Active
$499,900
5
bds
|
0
ba
|
3,772
sqft
|
built
1997
2537 La Rochelle Ct, Seabrook, TX 77586
$-1,002
Cash flow
-10.5%
Cash-on-Cash Return
3.9%
Cap rate
0.7%
Rent to Value Ratio

Active
$699,000
4
bds
|
0
ba
|
3,126
sqft
|
built
2006
4145 Boardwalk Blvd, Seabrook, TX 77586
$-2,228
Cash flow
-16.6%
Cash-on-Cash Return
2.4%
Cap rate
0.5%
Rent to Value Ratio

Active
$224,800
2
bds
|
0
ba
|
936
sqft
|
built
1979
307 Yacht Club Ln, Seabrook, TX 77586
$-984
Cash flow
-22.8%
Cash-on-Cash Return
1.0%
Cap rate
0.9%
Rent to Value Ratio
Active
$445,000
4
bds
|
0
ba
|
2,296
sqft
|
built
2022
1501 Ashley Ct, Seabrook, TX 77586
$-767
Cash flow
-9.0%
Cash-on-Cash Return
4.2%
Cap rate
0.8%
Rent to Value Ratio

Active
$795,000
3
bds
|
0
ba
|
2,165
sqft
|
built
2006
4821 Nasa Pkwy, Seabrook, TX 77586
$-4,440
Cash flow
-29.1%
Cash-on-Cash Return
-0.4%
Cap rate
0.6%
Rent to Value Ratio
Active
$318,000
4
bds
|
0
ba
|
2,280
sqft
|
built
1991
4309 Kingfish Dr, Seabrook, TX 77586
$-395
Cash flow
-6.5%
Cash-on-Cash Return
4.8%
Cap rate
0.8%
Rent to Value Ratio

Active
$1,800,000
5
bds
|
0
ba
|
5,223
sqft
|
built
1989
1206 Spring Cress Ln, Seabrook, TX 77586
$-7,677
Cash flow
-22.3%
Cash-on-Cash Return
1.1%
Cap rate
0.3%
Rent to Value Ratio
Active
$1,850,000
4
bds
|
0
ba
|
1,026
sqft
|
built
2010
2904 Red Bluff Rd, Seabrook, TX 77586
$-7,519
Cash flow
-21.2%
Cash-on-Cash Return
1.4%
Cap rate
0.2%
Rent to Value Ratio

Active
$330,000
3
bds
|
0
ba
|
2,841
sqft
|
built
1994
2605 De Four Trce, Seabrook, TX 77586
$-457
Cash flow
-7.2%
Cash-on-Cash Return
4.6%
Cap rate
0.8%
Rent to Value Ratio
Active
$289,500
5
bds
|
0
ba
|
2,314
sqft
|
built
1966
1865 El Mar Ln, Seabrook, TX 77586
$-337
Cash flow
-6.1%
Cash-on-Cash Return
4.9%
Cap rate
0.8%
Rent to Value Ratio

Active
$349,900
4
bds
|
0
ba
|
2,238
sqft
|
built
1966
110 Harborcrest Dr, Seabrook, TX 77586
$-646
Cash flow
-9.6%
Cash-on-Cash Return
4.1%
Cap rate
0.7%
Rent to Value Ratio

Active
$530,000
4
bds
|
0
ba
|
3,387
sqft
|
built
2014
2731 Sea Ledge Dr, Seabrook, TX 77586
$-1,382
Cash flow
-13.6%
Cash-on-Cash Return
3.1%
Cap rate
0.6%
Rent to Value Ratio
Active
$447,500
3
bds
|
0
ba
|
1,674
sqft
|
built
2019
1205 Todville Rd, Seabrook, TX 77586
$-1,036
Cash flow
-12.1%
Cash-on-Cash Return
3.5%
Cap rate
0.7%
Rent to Value Ratio

Active
$2,700,000
6
bds
|
0
ba
|
6,903
sqft
|
built
1991
1406 Spring Cress Ln, Seabrook, TX 77586
$-12,180
Cash flow
-23.5%
Cash-on-Cash Return
0.9%
Cap rate
0.2%
Rent to Value Ratio
Active
$599,000
5
bds
|
0
ba
|
4,370
sqft
|
built
1991
907 Live Oak Ln, Seabrook, TX 77586
$-1,396
Cash flow
-12.2%
Cash-on-Cash Return
3.5%
Cap rate
0.7%
Rent to Value Ratio

Active
$249,900
4
bds
|
0
ba
|
1,708
sqft
|
built
1966
1853 El Mar Ln, Seabrook, TX 77586
$-332
Cash flow
-6.9%
Cash-on-Cash Return
4.7%
Cap rate
0.8%
Rent to Value Ratio

Active
$90,500
1
bds
|
0
ba
|
592
sqft
|
built
1980
3300 Pebblebrook Dr, Seabrook, TX 77586
$-277
Cash flow
-16.0%
Cash-on-Cash Return
2.6%
Cap rate
1.2%
Rent to Value Ratio
Active
$399,900
4
bds
|
0
ba
|
2,730
sqft
|
built
1999
1427 Roaring Springs Ln, Seabrook, TX 77586
$-856
Cash flow
-11.2%
Cash-on-Cash Return
3.7%
Cap rate
0.7%
Rent to Value Ratio
Active
$265,000
3
bds
|
0
ba
|
1,928
sqft
|
built
1995
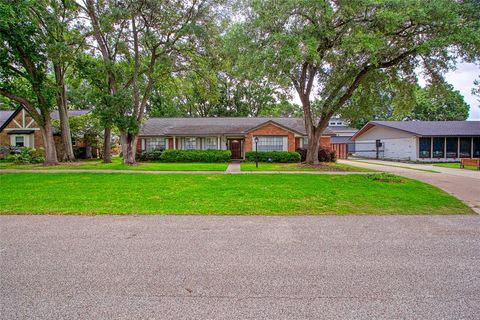
4714 Hawthorne St, Seabrook, TX 77586
$-446
Cash flow
-8.8%
Cash-on-Cash Return
4.2%
Cap rate
0.8%
Rent to Value Ratio
Active
$564,900
3
bds
|
0
ba
|
2,010
sqft
|
built
2016
2101 Menard Ave, Seabrook, TX 77586
$-1,668
Cash flow
-15.4%
Cash-on-Cash Return
2.7%
Cap rate
0.5%
Rent to Value Ratio
Active
$175,000
2
bds
|
0
ba
|
1,092
sqft
|
built
1979
208 Yacht Club Ln, Seabrook, TX 77586
$-840
Cash flow
-25.0%
Cash-on-Cash Return
0.5%
Cap rate
1.0%
Rent to Value Ratio