Seabrook, TX Investment Properties for Sale
Browse homes for sale and investment properties in Seabrook, TX. Refine your search by price, property type, or more.
Best cash flowing properties in Seabrook, TX
Active
$80,000
1
bds
|
1
ba
|
760
sqft
|
built
1978
3535 Nasa Pkwy, Seabrook, TX 77586
$1
Cash flow
0.1%
Cash-on-Cash Return
5.7%
Cap rate
1.9%
Rent to Value Ratio

Active
$79,900
1
bds
|
1
ba
|
670
sqft
|
built
1980
3300 Pebblebrook Dr, Seabrook, TX 77586
$-104
Cash flow
-6.8%
Cash-on-Cash Return
4.1%
Cap rate
1.6%
Rent to Value Ratio
79 out of 87 properties for sale in Seabrook, TX
Limited Results Shown
Create a free account, or log in to reveal all property listings and enjoy the complete experience.
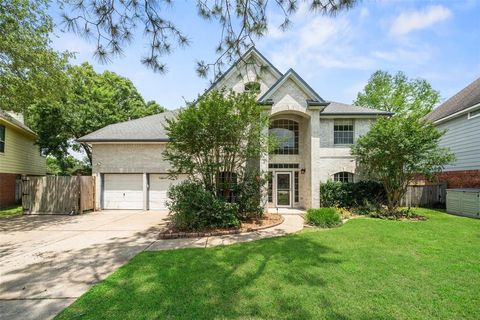
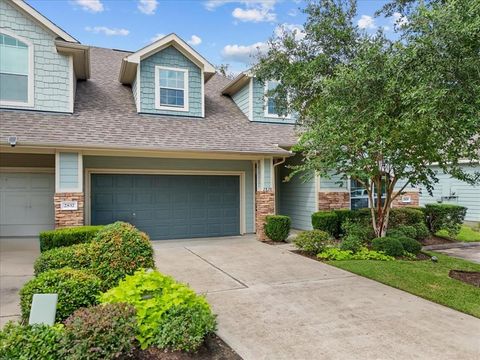
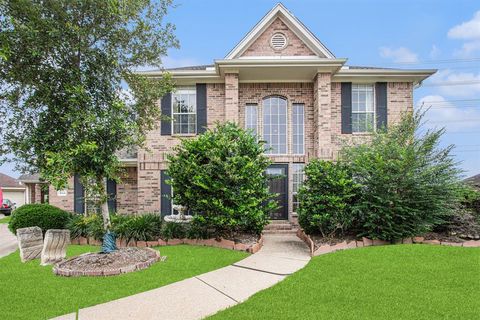
Active
$699,000
4
bds
|
4
ba
|
3,126
sqft
|
built
2006
4145 Boardwalk Blvd, Seabrook, TX 77586
$-1,887
Cash flow
-14.1%
Cash-on-Cash Return
2.4%
Cap rate
0.5%
Rent to Value Ratio
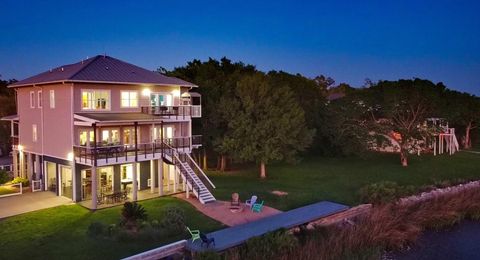
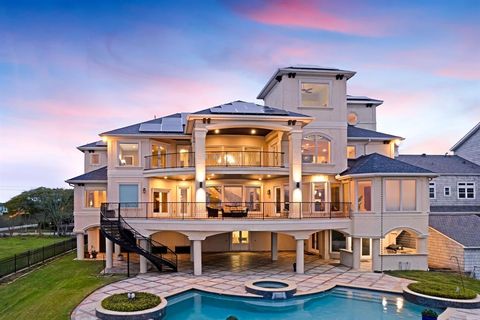
Active
$1,050,000
5
bds
|
4
ba
|
4,063
sqft
|
built
2000
2922 N Island Dr, Seabrook, TX 77586
$-1,385
Cash flow
-6.9%
Cash-on-Cash Return
4.1%
Cap rate
0.7%
Rent to Value Ratio

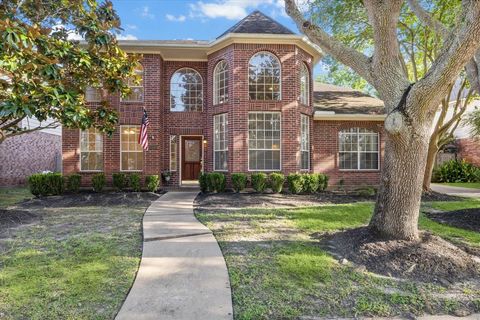
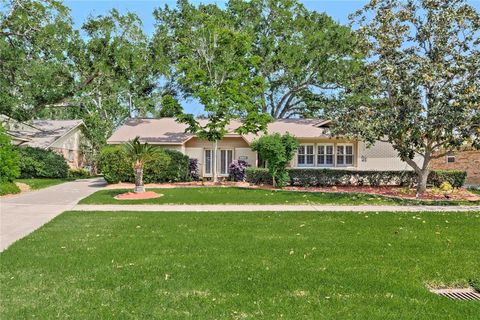
Active
$509,000
3
bds
|
2
ba
|
2,272
sqft
|
built
2018
1433 Lake Mija Ct, Seabrook, TX 77586
$-1,126
Cash flow
-11.5%
Cash-on-Cash Return
3.0%
Cap rate
0.6%
Rent to Value Ratio
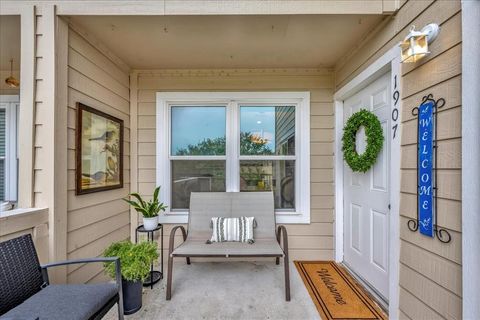
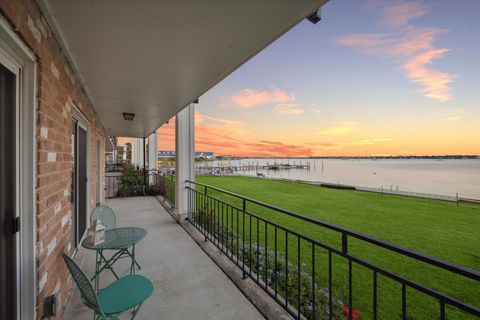
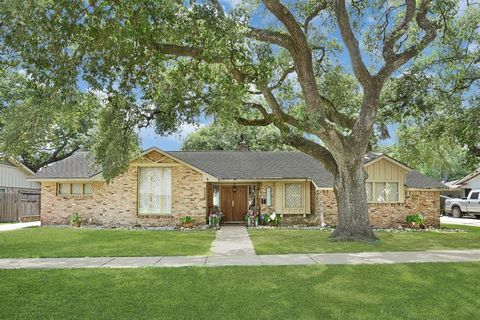
Active
$260,000
2
bds
|
3
ba
|
1,325
sqft
|
built
1979
1907 Glencove Dr, Seabrook, TX 77586
$-451
Cash flow
-9.1%
Cash-on-Cash Return
3.6%
Cap rate
0.9%
Rent to Value Ratio
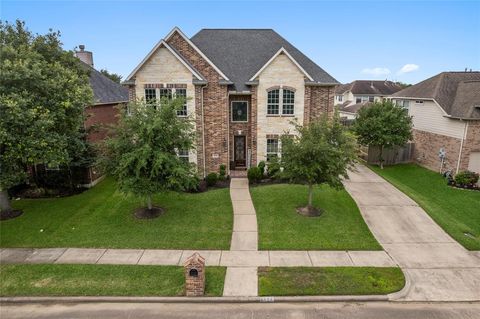
Active
$439,900
4
bds
|
3
ba
|
3,057
sqft
|
built
1996
2502 Sea Horse Ct, Seabrook, TX 77586
$-790
Cash flow
-9.4%
Cash-on-Cash Return
3.5%
Cap rate
0.7%
Rent to Value Ratio

Active
$479,900
3
bds
|
3
ba
|
2,313
sqft
|
built
1965
4905 Todville Rd, Seabrook, TX 77586
$-629
Cash flow
-6.8%
Cash-on-Cash Return
4.1%
Cap rate
0.6%
Rent to Value Ratio
Active
$849,000
4
bds
|
3
ba
|
3,174
sqft
|
built
2008
814 Hall Ave, Seabrook, TX 77586
$-1,014
Cash flow
-6.2%
Cash-on-Cash Return
4.2%
Cap rate
0.7%
Rent to Value Ratio
Active
$400,000
5
bds
|
3
ba
|
3,586
sqft
|
built
1996
1410 Juniper Ln, Seabrook, TX 77586
$-708
Cash flow
-9.2%
Cash-on-Cash Return
3.6%
Cap rate
0.8%
Rent to Value Ratio
Active
$249,900
3
bds
|
2
ba
|
1,408
sqft
|
built
1978
3535 Nasa Pkwy, Seabrook, TX 77586
$-1,121
Cash flow
-23.4%
Cash-on-Cash Return
0.3%
Cap rate
0.8%
Rent to Value Ratio
Active
$325,000
3
bds
|
2
ba
|
1,903
sqft
|
built
2013
2828 Sand Dune Dr, Seabrook, TX 77586
$-541
Cash flow
-8.7%
Cash-on-Cash Return
3.7%
Cap rate
0.8%
Rent to Value Ratio
Active
$395,000
4
bds
|
2
ba
|
2,506
sqft
|
built
1973
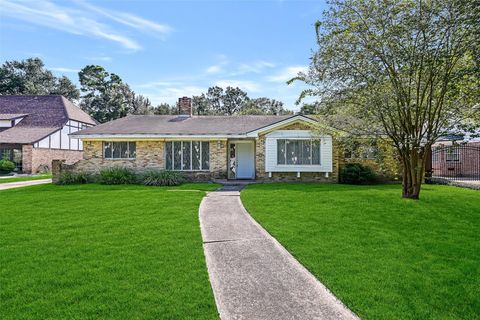
4247 Crownwood Dr, Seabrook, TX 77586
$-660
Cash flow
-8.7%
Cash-on-Cash Return
3.7%
Cap rate
0.7%
Rent to Value Ratio
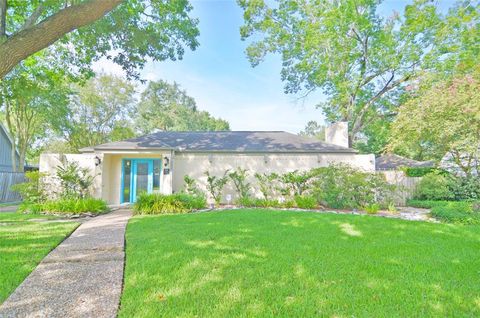
Active
$348,000
3
bds
|
2
ba
|
2,290
sqft
|
built
1961
2001 Willow Wisp Dr, Seabrook, TX 77586
$-264
Cash flow
-4.0%
Cash-on-Cash Return
4.8%
Cap rate
0.8%
Rent to Value Ratio
Active
$489,900
5
bds
|
3
ba
|
3,194
sqft
|
built
2016
2202 Water Way, Seabrook, TX 77586
$-913
Cash flow
-9.7%
Cash-on-Cash Return
3.4%
Cap rate
0.7%
Rent to Value Ratio
Active
$154,999
2
bds
|
1
ba
|
994
sqft
|
built
1963
709 Gale St, Seabrook, TX 77586
$-217
Cash flow
-7.3%
Cash-on-Cash Return
4.0%
Cap rate
1.0%
Rent to Value Ratio
Active
$549,000
4
bds
|
3
ba
|
2,903
sqft
|
built
1963
215 Whispering Oaks Dr, Seabrook, TX 77586
$-1,052
Cash flow
-10.0%
Cash-on-Cash Return
3.4%
Cap rate
0.6%
Rent to Value Ratio
Active
$320,000
4
bds
|
3
ba
|
2,464
sqft
|
built
1978
518 Lorie Ln, Seabrook, TX 77586
$-453
Cash flow
-7.4%
Cash-on-Cash Return
4.0%
Cap rate
0.8%
Rent to Value Ratio
Active
$382,500
4
bds
|
3
ba
|
2,792
sqft
|
built
1997
1410 Poplar Ln, Seabrook, TX 77586
$-523
Cash flow
-7.1%
Cash-on-Cash Return
4.0%
Cap rate
0.8%
Rent to Value Ratio
Active
$399,500
4
bds
|
3
ba
|
2,595
sqft
|
built
1995
2506 Guilbeau Ln, Seabrook, TX 77586
$-634
Cash flow
-8.3%
Cash-on-Cash Return
3.8%
Cap rate
0.7%
Rent to Value Ratio
Active
$339,000
2
bds
|
2
ba
|
1,254
sqft
|
built
1977
33 Lakewood Ln, Seabrook, TX 77586
$-1,272
Cash flow
-19.6%
Cash-on-Cash Return
1.2%
Cap rate
0.5%
Rent to Value Ratio
Active
$395,000
2
bds
|
2
ba
|
1,535
sqft
|
built
1983
817 Bryan Ave, Seabrook, TX 77586
$-475
Cash flow
-6.3%
Cash-on-Cash Return
4.2%
Cap rate
0.7%
Rent to Value Ratio
Active
$339,900
4
bds
|
3
ba
|
2,617
sqft
|
built
1971
4206 Willow Hill Dr, Seabrook, TX 77586
$-350
Cash flow
-5.4%
Cash-on-Cash Return
4.4%
Cap rate
0.8%
Rent to Value Ratio
Active
$350,000
4
bds
|
3
ba
|
2,783
sqft
|
built
1994
2526 Sand Castle Ct, Seabrook, TX 77586
$-218
Cash flow
-3.2%
Cash-on-Cash Return
4.9%
Cap rate
0.9%
Rent to Value Ratio
Active
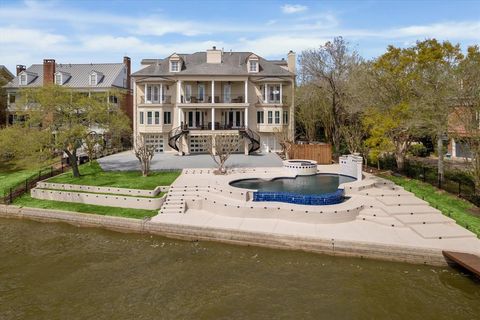
$3,750,000
5
bds
|
7
ba
|
7,584
sqft
|
built
2011
2220 Todville Rd, Seabrook, TX 77586
$-15,048
Cash flow
-20.9%
Cash-on-Cash Return
0.9%
Cap rate
0.2%
Rent to Value Ratio
Active
$305,000
3
bds
|
2
ba
|
2,057
sqft
|
built
1963
2105 Willow Dell Dr, Seabrook, TX 77586
$-226
Cash flow
-3.9%
Cash-on-Cash Return
4.8%
Cap rate
0.8%
Rent to Value Ratio
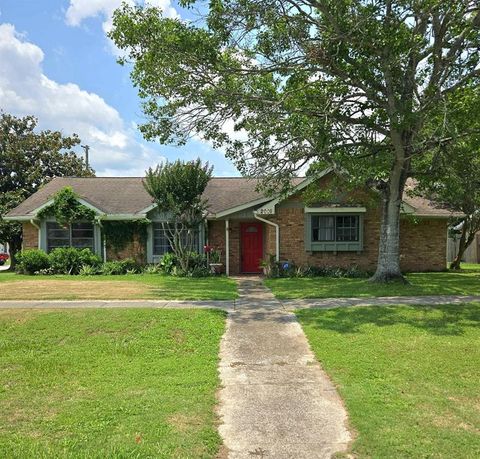
Active
$293,000
3
bds
|
2
ba
|
2,042
sqft
|
built
1960
2022 Willow Wisp Dr, Seabrook, TX 77586
$-154
Cash flow
-2.7%
Cash-on-Cash Return
5.0%
Cap rate
0.9%
Rent to Value Ratio

Active
$90,000
1
bds
|
1
ba
|
670
sqft
|
built
1980
3300 Pebblebrook Dr, Seabrook, TX 77586
$-265
Cash flow
-15.4%
Cash-on-Cash Return
2.1%
Cap rate
1.2%
Rent to Value Ratio
Active
$290,000
4
bds
|
3
ba
|
2,234
sqft
|
built
1968
418 Forest Lake Dr, Seabrook, TX 77586
$-192
Cash flow
-3.5%
Cash-on-Cash Return
4.9%
Cap rate
0.9%
Rent to Value Ratio
Active
$400,000
5
bds
|
3
ba
|
2,817
sqft
|
built
1976
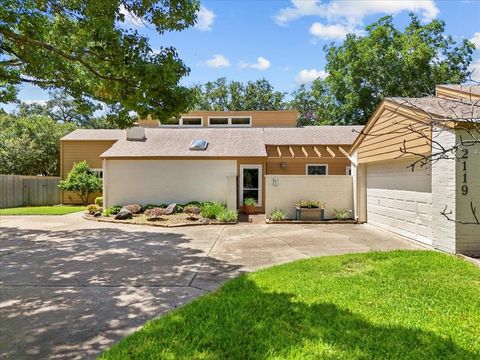
2119 Willow Dell Dr, Seabrook, TX 77586
$-518
Cash flow
-6.8%
Cash-on-Cash Return
4.1%
Cap rate
0.7%
Rent to Value Ratio
Active
$410,000
4
bds
|
3
ba
|
2,681
sqft
|
built
1997
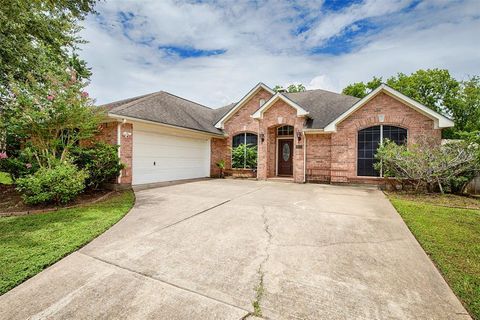
1815 Rustic Oak Ln, Seabrook, TX 77586
$-820
Cash flow
-10.4%
Cash-on-Cash Return
3.3%
Cap rate
0.7%
Rent to Value Ratio
Active
$359,000
4
bds
|
3
ba
|
2,314
sqft
|
built
1968
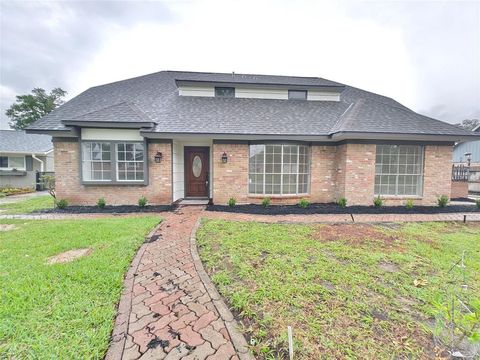
4106 Clovernook Ln, Seabrook, TX 77586
$-623
Cash flow
-9.1%
Cash-on-Cash Return
3.6%
Cap rate
0.6%
Rent to Value Ratio
Active
$175,000
2
bds
|
2
ba
|
1,092
sqft
|
built
1979
208 Yacht Club Ln, Seabrook, TX 77586
$-754
Cash flow
-22.5%
Cash-on-Cash Return
0.5%
Cap rate
1.0%
Rent to Value Ratio
Active
$499,000
3
bds
|
2
ba
|
2,010
sqft
|
built
2016
2101 Menard Ave, Seabrook, TX 77586
$-1,080
Cash flow
-11.3%
Cash-on-Cash Return
3.1%
Cap rate
0.6%
Rent to Value Ratio
Active
$389,900
4
bds
|
3
ba
|
2,920
sqft
|
built
1999
1001 Victorian Ct, Seabrook, TX 77586
$-513
Cash flow
-6.9%
Cash-on-Cash Return
4.1%
Cap rate
0.7%
Rent to Value Ratio
Active
$388,900
4
bds
|
3
ba
|
2,730
sqft
|
built
1999
1427 Roaring Springs Ln, Seabrook, TX 77586
$-608
Cash flow
-8.2%
Cash-on-Cash Return
3.8%
Cap rate
0.7%
Rent to Value Ratio
Active
$299,999
2
bds
|
3
ba
|
1,657
sqft
|
built
1999
2032 Glencove Dr, Seabrook, TX 77586
$-839
Cash flow
-14.6%
Cash-on-Cash Return
2.3%
Cap rate
0.7%
Rent to Value Ratio
Active
$2,350,000
6
bds
|
6
ba
|
6,903
sqft
|
built
1991
1406 Spring Cress Ln, Seabrook, TX 77586
$-9,205
Cash flow
-20.4%
Cash-on-Cash Return
1.0%
Cap rate
0.2%
Rent to Value Ratio
Active
$299,900
2
bds
|
2
ba
|
1,882
sqft
|
built
1975
502 Wildwood Dr, Seabrook, TX 77586
$-380
Cash flow
-6.6%
Cash-on-Cash Return
4.2%
Cap rate
0.7%
Rent to Value Ratio