Sunnyvale, CA Investment Properties for Sale
Browse homes for sale and investment properties in Sunnyvale, CA. Refine your search by price, property type, or more.
Best cash flowing properties in Sunnyvale, CA
Active
$824,999
2
bds
|
1
ba
|
926
sqft
|
built
1971
233 Red Oak Dr E, Sunnyvale, CA 94086
$-2,747
Cash flow
-17.4%
Cash-on-Cash Return
2.3%
Cap rate
0.4%
Rent to Value Ratio
Pending
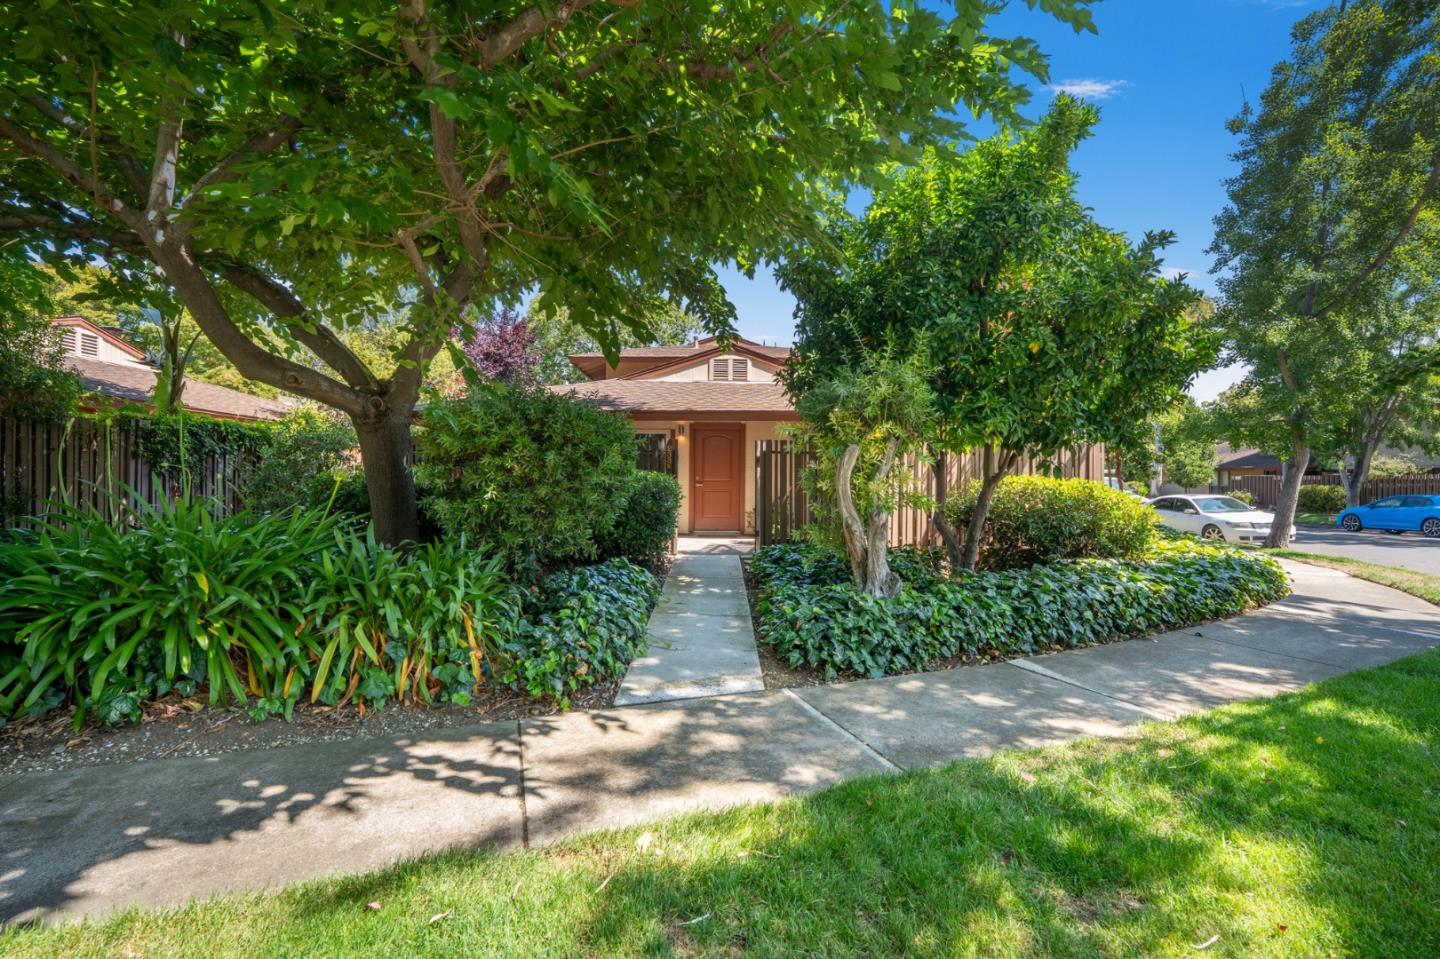
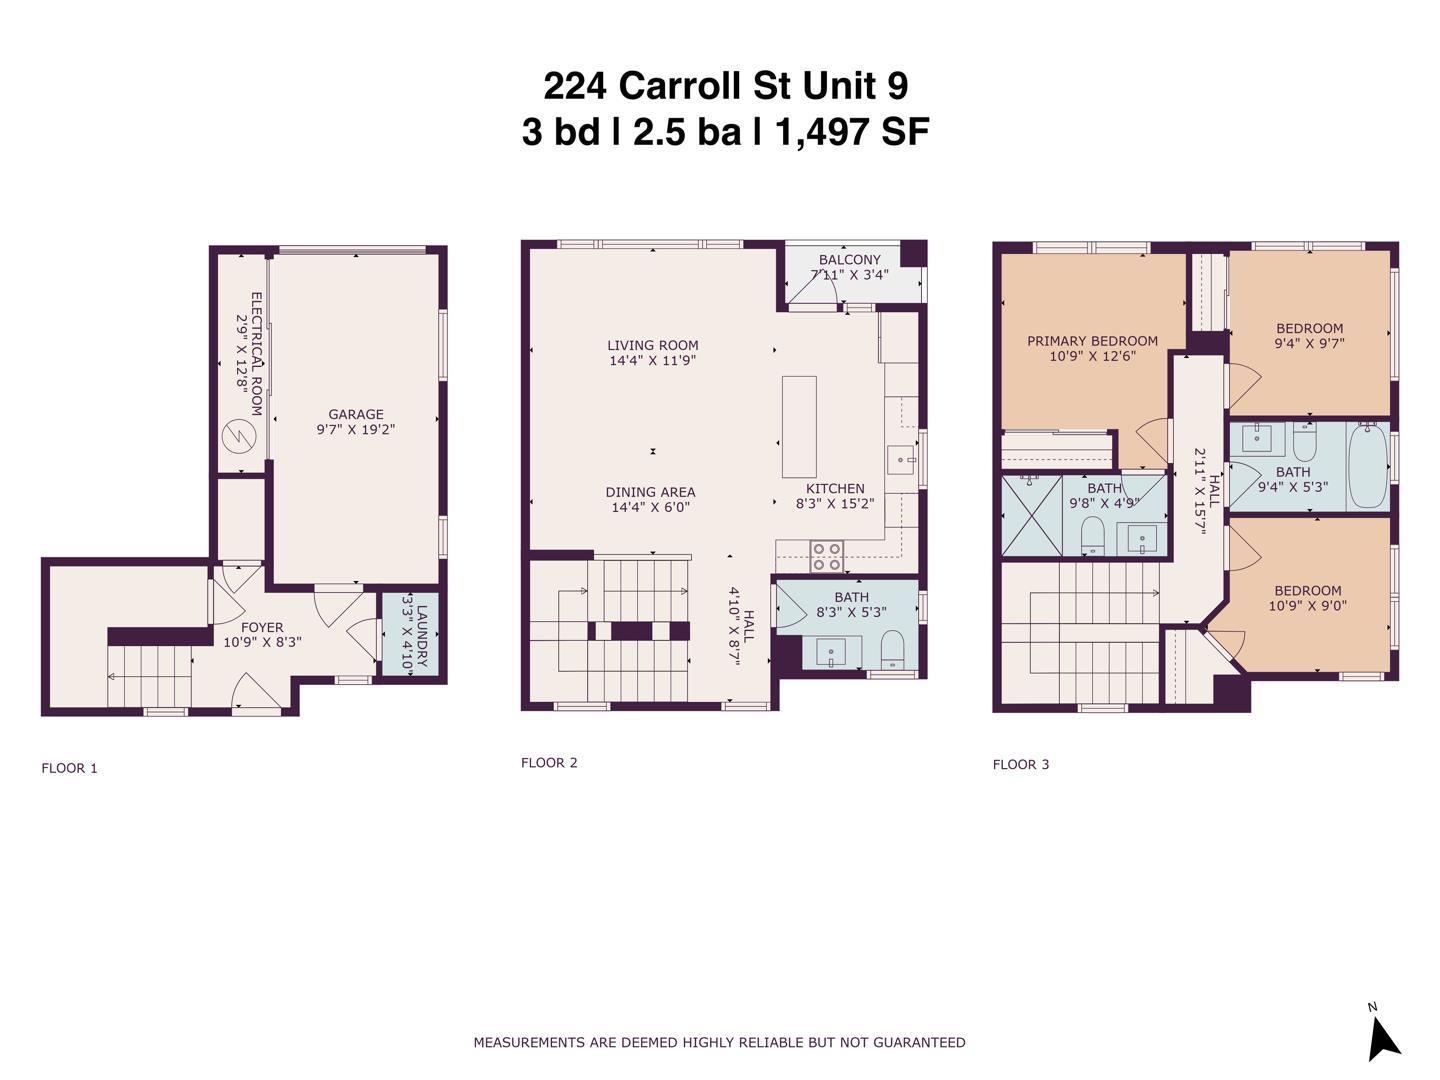
$1,488,888
3
bds
|
3
ba
|
1,497
sqft
|
built
2023
224 Carroll St, Sunnyvale, CA 94086
$-3,364
Cash flow
-11.8%
Cash-on-Cash Return
3.6%
Cap rate
0.5%
Rent to Value Ratio
95 out of 109 properties for sale in Sunnyvale, CA
Limited Results Shown
Create a free account, or log in to reveal all property listings and enjoy the complete experience.
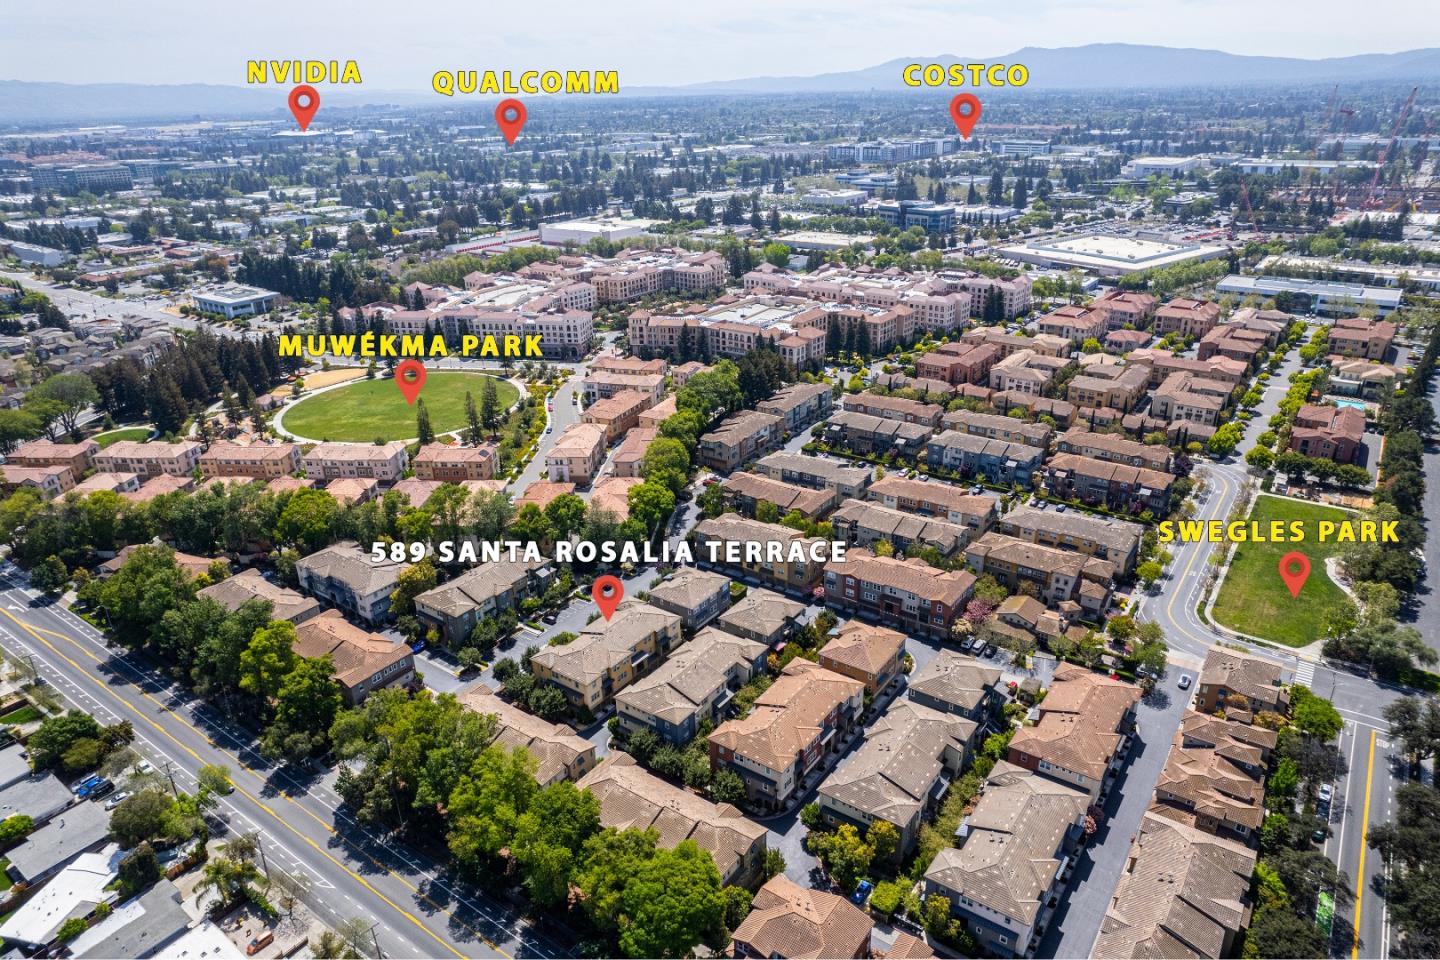
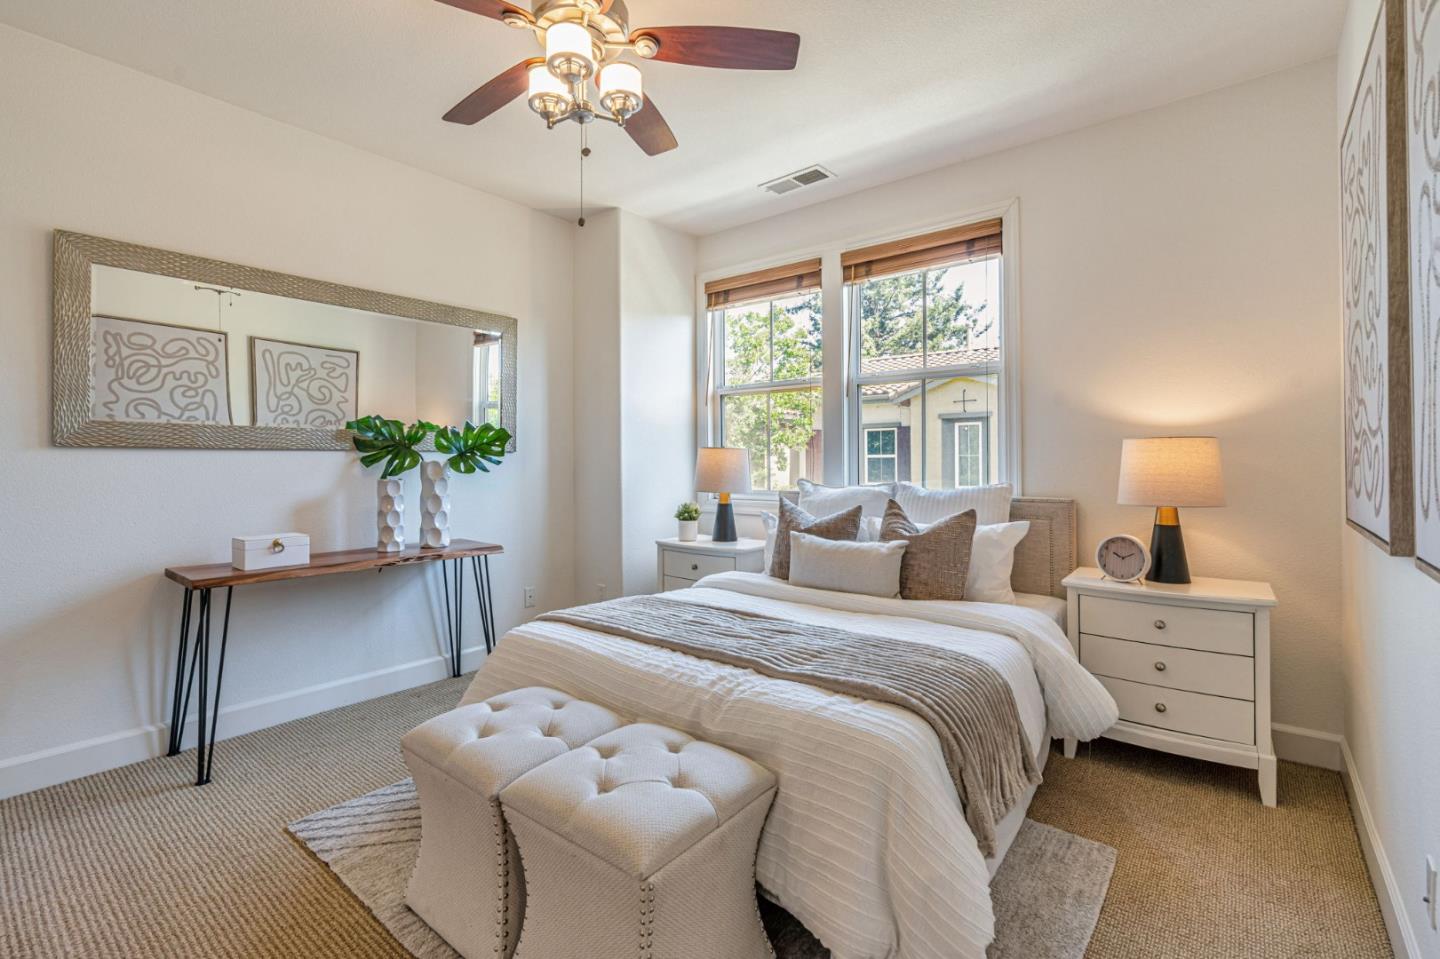
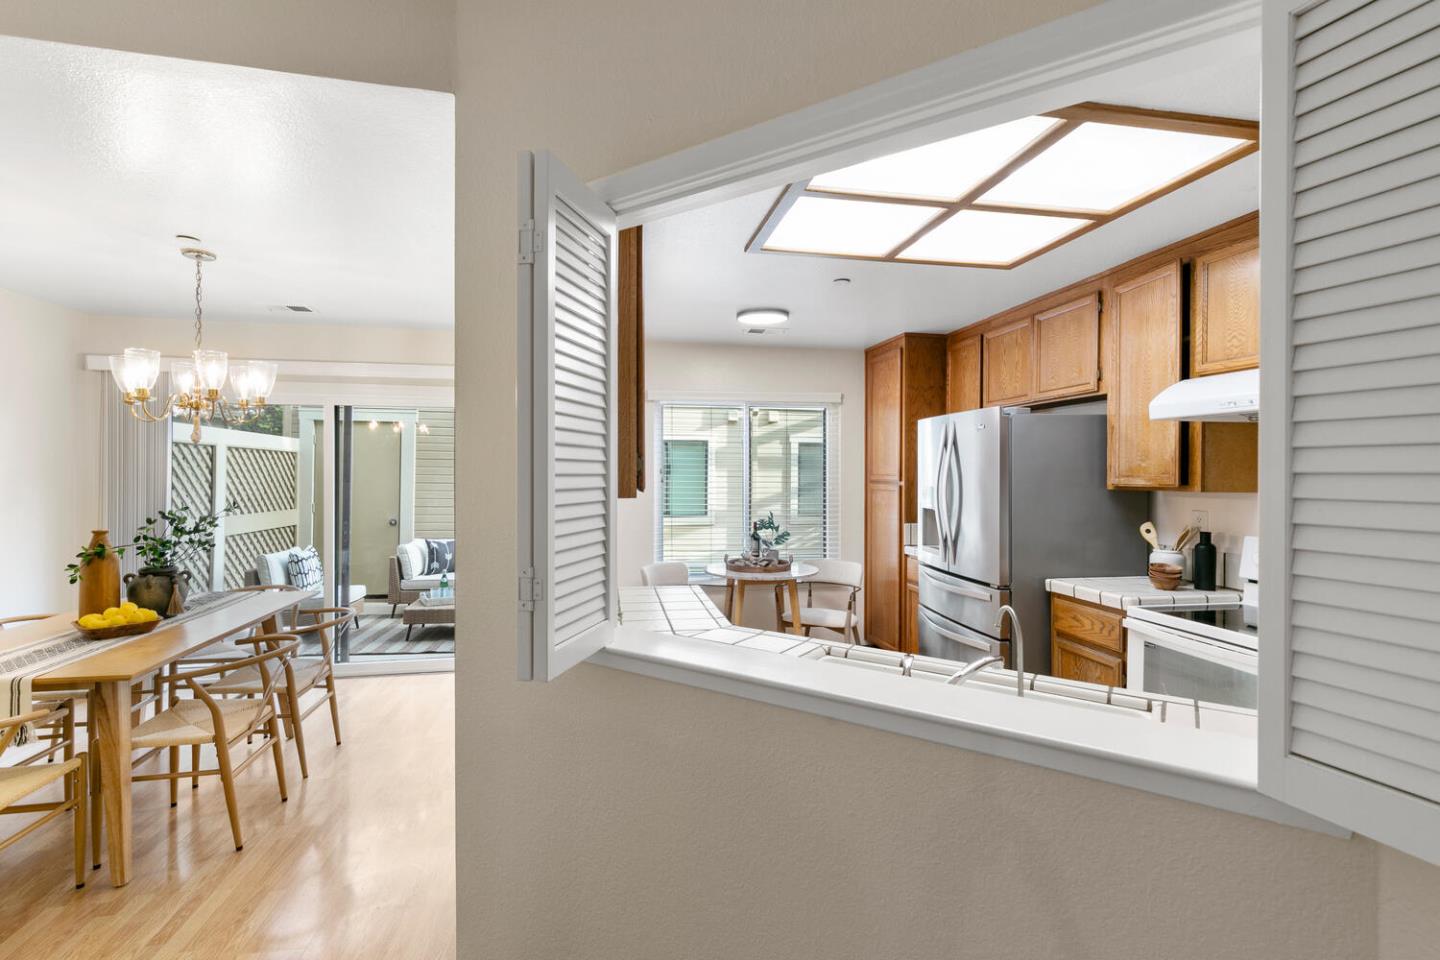
Active
$1,588,000
3
bds
|
3
ba
|
1,620
sqft
|
built
2011
589 Santa Rosalia Ter, Sunnyvale, CA 94085
$-5,358
Cash flow
-17.6%
Cash-on-Cash Return
2.2%
Cap rate
0.3%
Rent to Value Ratio
Active
$1,398,000
2
bds
|
3
ba
|
1,579
sqft
|
built
2006
519 Sirte Ter, Sunnyvale, CA 94089
$-4,554
Cash flow
-17.0%
Cash-on-Cash Return
2.4%
Cap rate
0.3%
Rent to Value Ratio
Pending
$2,100,088
3
bds
|
2
ba
|
1,416
sqft
|
built
1968
1236 Robbia Dr, Sunnyvale, CA 94087
$-7,203
Cash flow
-17.9%
Cash-on-Cash Return
2.2%
Cap rate
0.3%
Rent to Value Ratio
Active
$1,698,000
3
bds
|
4
ba
|
1,851
sqft
|
built
2018
810 Gridley Ter, Sunnyvale, CA 94085
$-5,442
Cash flow
-16.7%
Cash-on-Cash Return
2.4%
Cap rate
0.3%
Rent to Value Ratio
Active
$1,575,000
3
bds
|
1
ba
|
1,000
sqft
|
built
1953
559 E Duane Ave, Sunnyvale, CA 94085
$-5,212
Cash flow
-17.3%
Cash-on-Cash Return
2.3%
Cap rate
0.3%
Rent to Value Ratio
Active
$2,299,000
3
bds
|
2
ba
|
1,102
sqft
|
built
1950
1472 Hampton Dr, Sunnyvale, CA 94087
$-9,003
Cash flow
-20.4%
Cash-on-Cash Return
1.6%
Cap rate
0.2%
Rent to Value Ratio
Active
$2,588,000
4
bds
|
3
ba
|
2,212
sqft
|
built
2021
362 Stowell Ave, Sunnyvale, CA 94085
$-9,206
Cash flow
-18.6%
Cash-on-Cash Return
2.0%
Cap rate
0.2%
Rent to Value Ratio
Active
$1,899,000
3
bds
|
2
ba
|
1,965
sqft
|
built
1948
310 Jackson St, Sunnyvale, CA 94085
$-6,081
Cash flow
-16.7%
Cash-on-Cash Return
2.4%
Cap rate
0.3%
Rent to Value Ratio
Active
$1,100,000
2
bds
|
2
ba
|
1,209
sqft
|
built
1971
125 Connemara Way, Sunnyvale, CA 94087
$-3,393
Cash flow
-16.1%
Cash-on-Cash Return
2.6%
Cap rate
0.4%
Rent to Value Ratio
Pending
$2,199,999
3
bds
|
3
ba
|
2,012
sqft
|
built
1950
398 E Olive Ave, Sunnyvale, CA 94086
$-7,588
Cash flow
-18.0%
Cash-on-Cash Return
2.1%
Cap rate
0.3%
Rent to Value Ratio
Active
$1,298,000
2
bds
|
3
ba
|
2,120
sqft
|
built
1985
974 La Mesa Ter, Sunnyvale, CA 94086
$-4,067
Cash flow
-16.3%
Cash-on-Cash Return
2.5%
Cap rate
0.4%
Rent to Value Ratio
Pending
$1,488,888
3
bds
|
3
ba
|
1,497
sqft
|
built
2023
224 Carroll St, Sunnyvale, CA 94086
$-3,364
Cash flow
-11.8%
Cash-on-Cash Return
3.6%
Cap rate
0.5%
Rent to Value Ratio
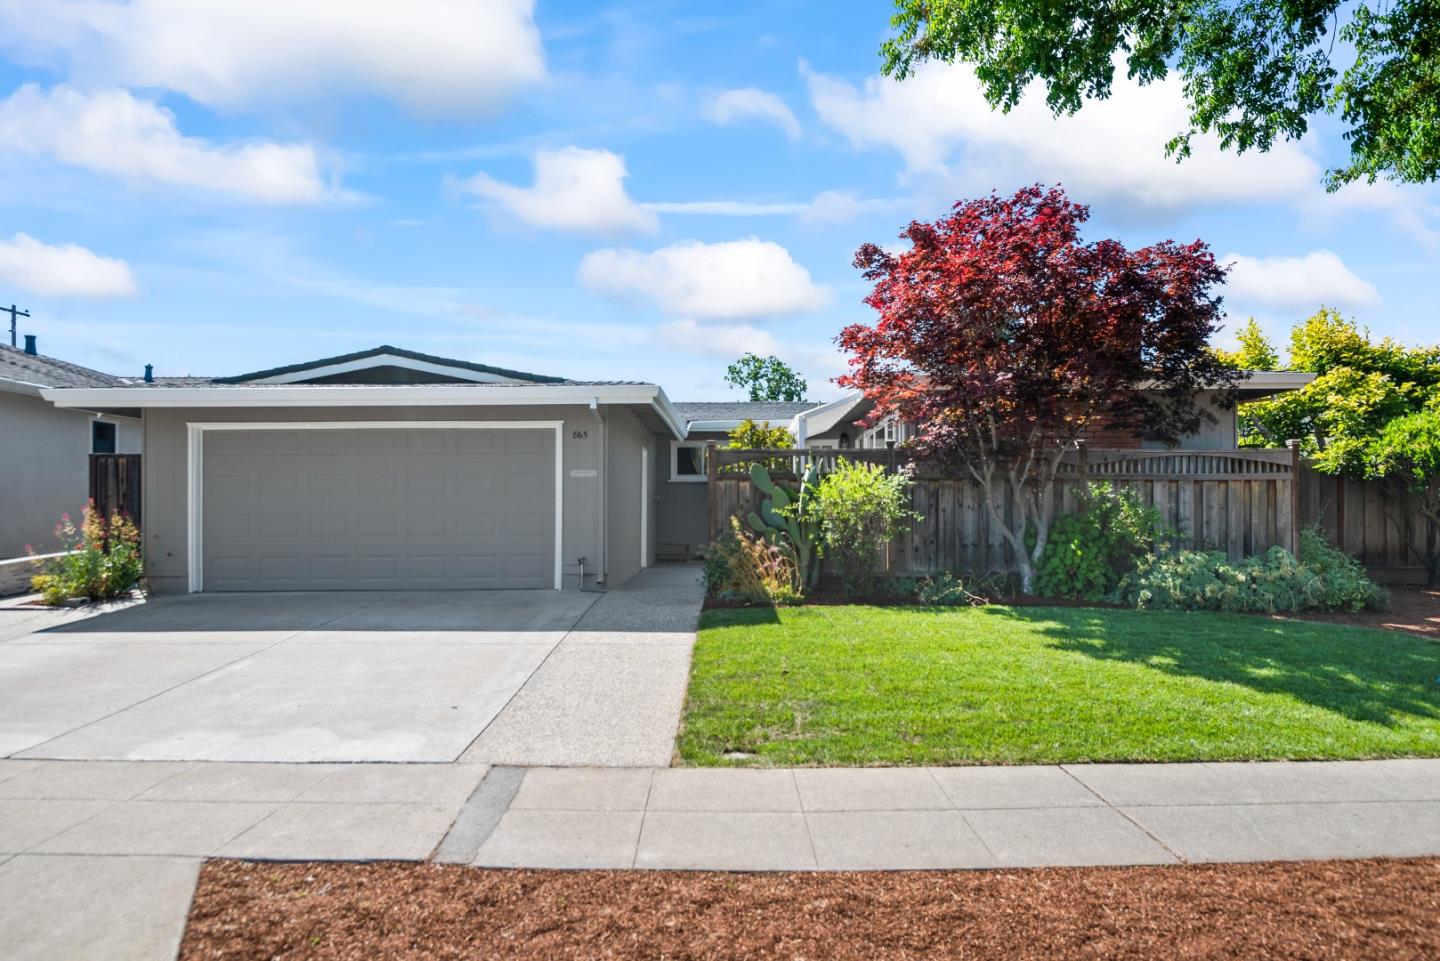
Active
$2,766,000
4
bds
|
3
ba
|
1,675
sqft
|
built
1962
1390 Pointe Claire Dr, Sunnyvale, CA 94087
$-10,276
Cash flow
-19.4%
Cash-on-Cash Return
1.8%
Cap rate
0.2%
Rent to Value Ratio
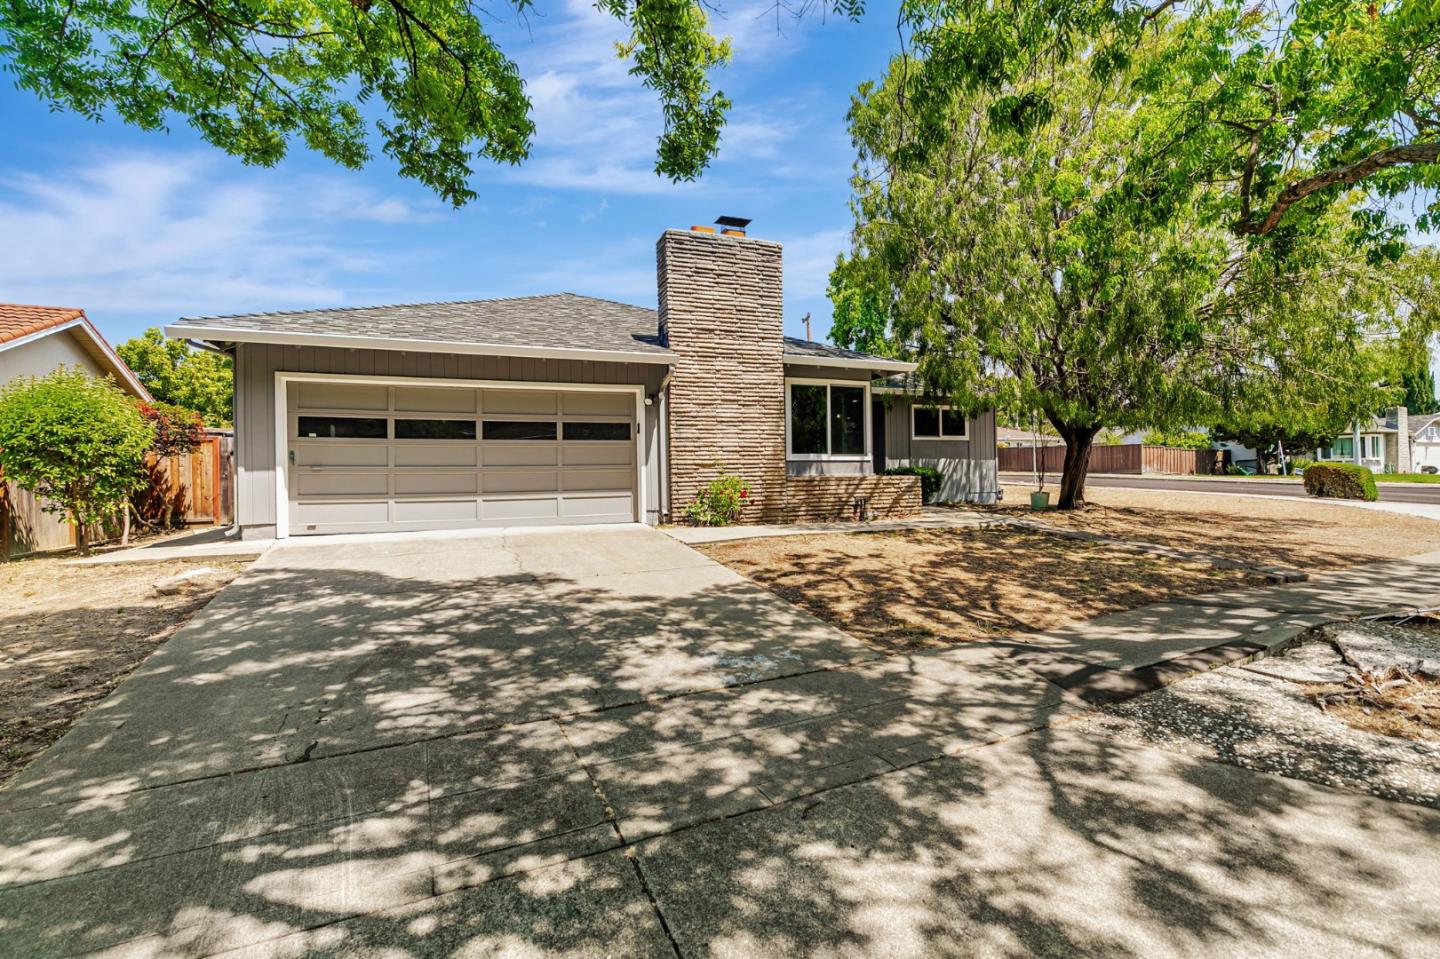
Active
$2,298,000
4
bds
|
3
ba
|
1,479
sqft
|
built
1962
865 Ponderosa Ave, Sunnyvale, CA 94086
$-8,515
Cash flow
-19.3%
Cash-on-Cash Return
1.8%
Cap rate
0.2%
Rent to Value Ratio
Active
$824,999
2
bds
|
1
ba
|
926
sqft
|
built
1971
233 Red Oak Dr E, Sunnyvale, CA 94086
$-2,747
Cash flow
-17.4%
Cash-on-Cash Return
2.3%
Cap rate
0.4%
Rent to Value Ratio