Davidson County Investment Properties for Sale
Browse homes for sale and investment properties in Davidson County. Refine your search by price, property type, or more.
Best cash flowing properties in Davidson County
$259,900
2
bds
|
2
ba
|
1,270
sqft
|
built
1986
1115 Waggoner Ct W, Nashville, TN 37214
$453
Cash flow
9.1%
Cash-on-Cash Return
7.8%
Cap rate
1.0%
Rent to Value Ratio
$474,900
4
bds
|
2
ba
|
1,815
sqft
|
built
1966
486 Westcrest Dr, Nashville, TN 37211
$316
Cash flow
3.5%
Cash-on-Cash Return
6.5%
Cap rate
0.8%
Rent to Value Ratio
67 out of 2,735 properties for sale in Davidson County
Limited Results Shown
Create a free account, or log in to reveal all property listings and enjoy the complete experience.
$1,219,000
4
bds
|
3
ba
|
2,667
sqft
|
built
1959
215 Rolling Fork Ct, Nashville, TN 37205
$-3,208
Cash flow
-13.7%
Cash-on-Cash Return
2.5%
Cap rate
0.4%
Rent to Value Ratio
$620,000
4
bds
|
3
ba
|
3,270
sqft
|
built
1997
8012 Poplarwood Rd, Nashville, TN 37221
$-842
Cash flow
-7.1%
Cash-on-Cash Return
4.0%
Cap rate
0.6%
Rent to Value Ratio
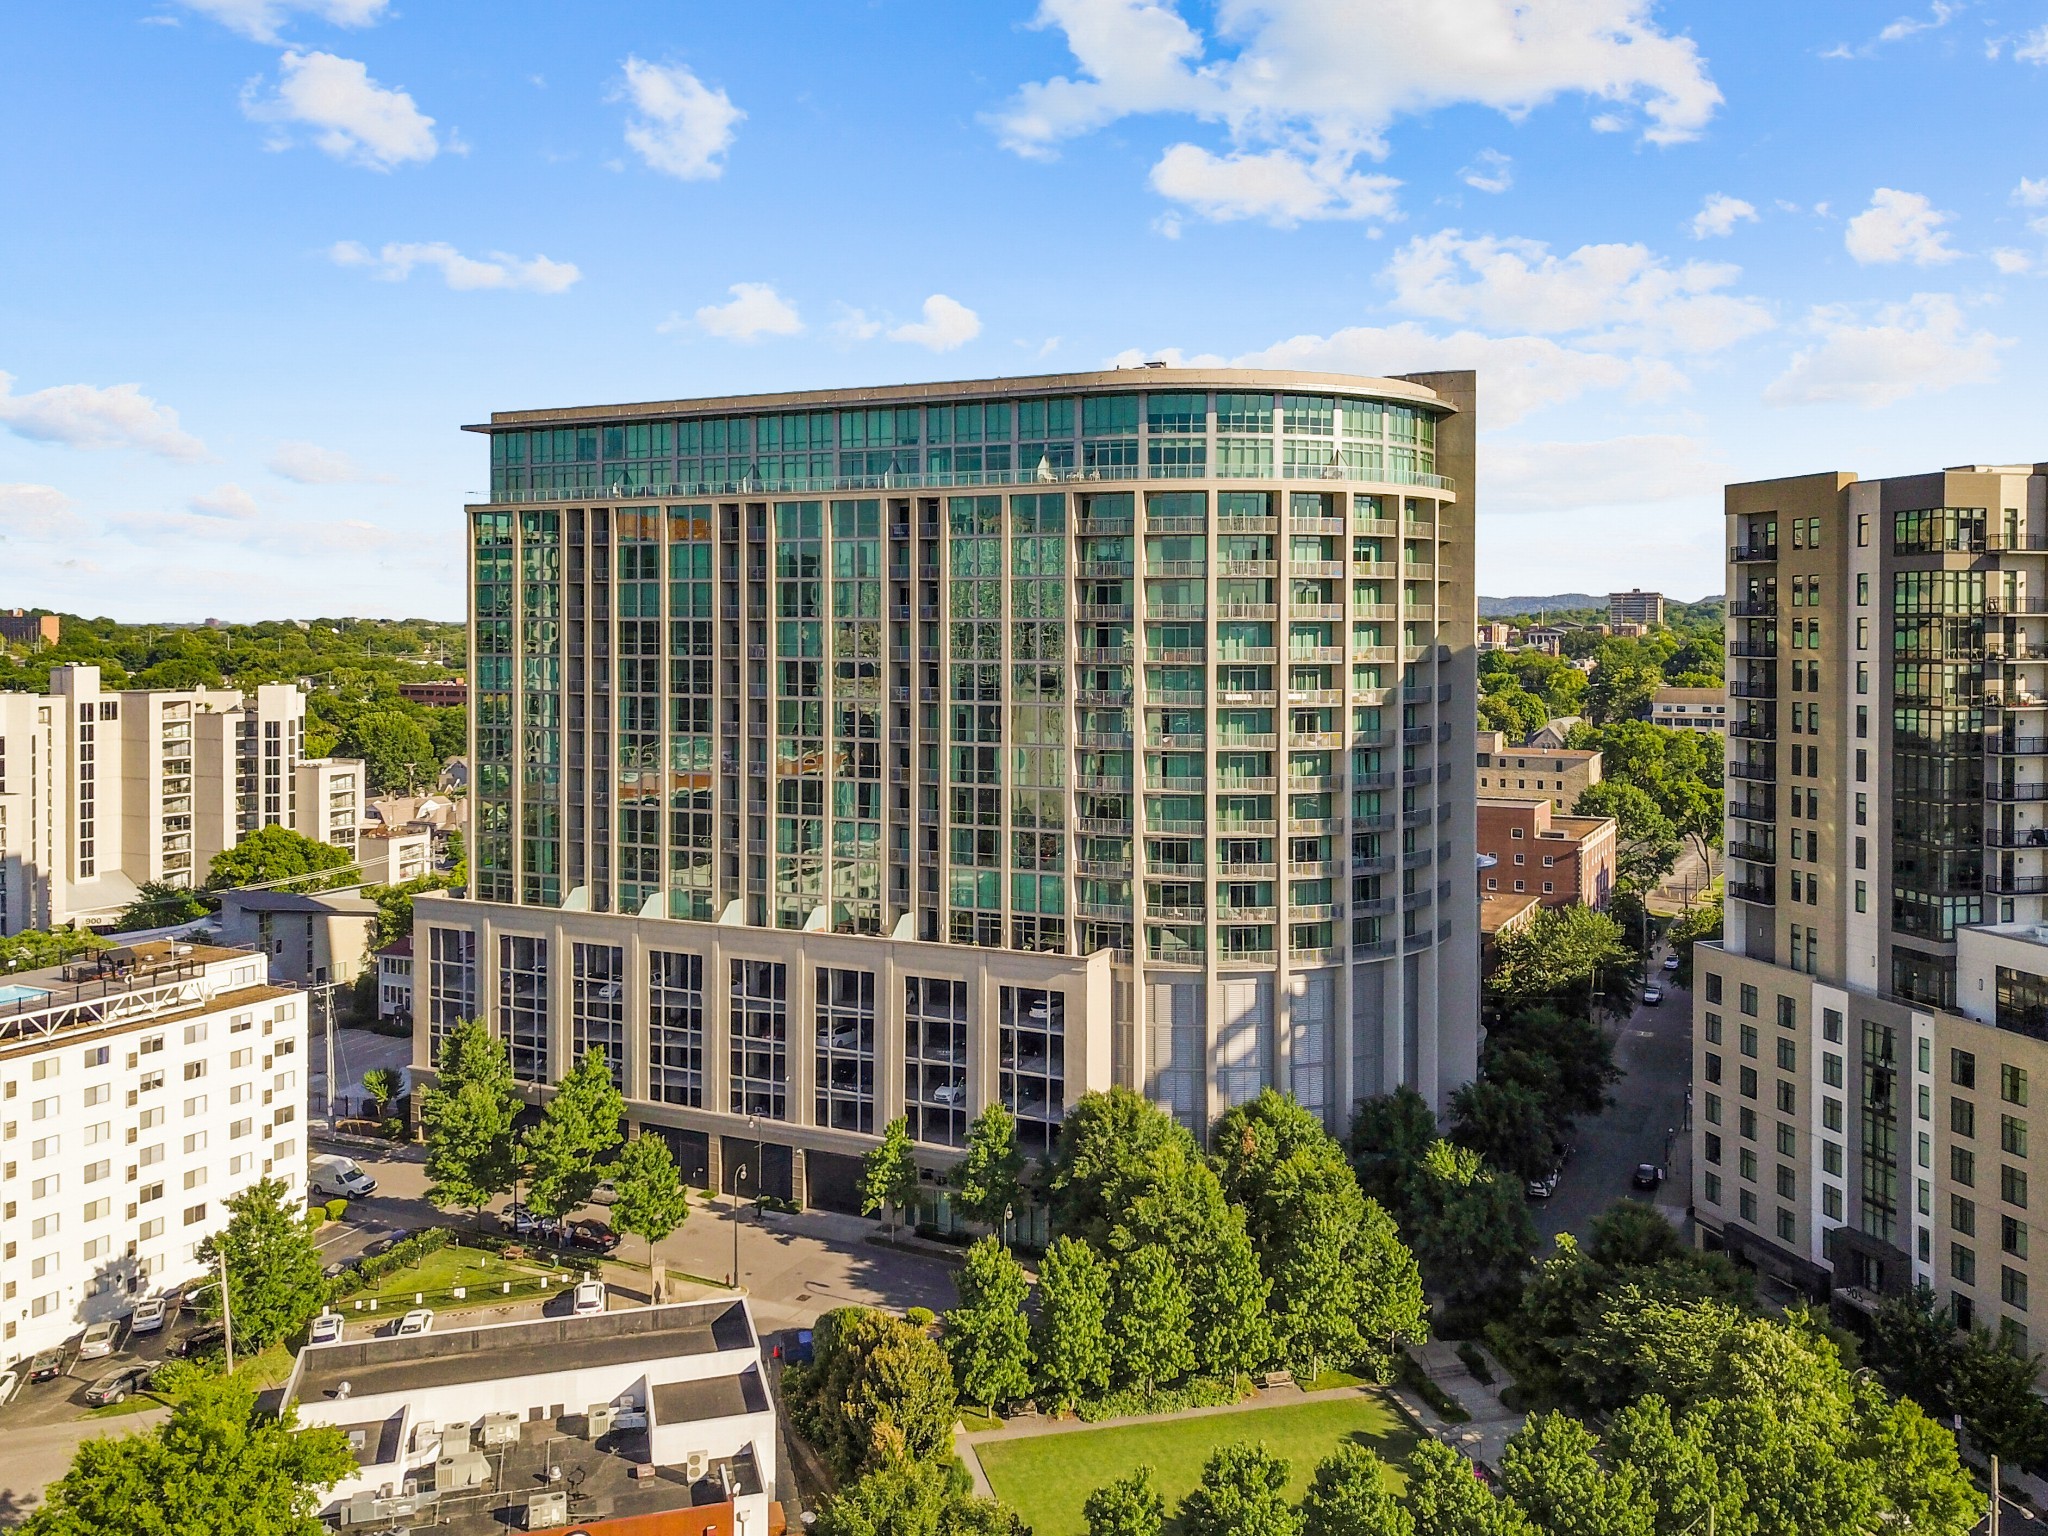
$469,500
1
bds
|
1
ba
|
808
sqft
|
built
2007
900 20th Ave S, Nashville, TN 37212
$-1,408
Cash flow
-15.6%
Cash-on-Cash Return
2.1%
Cap rate
0.5%
Rent to Value Ratio
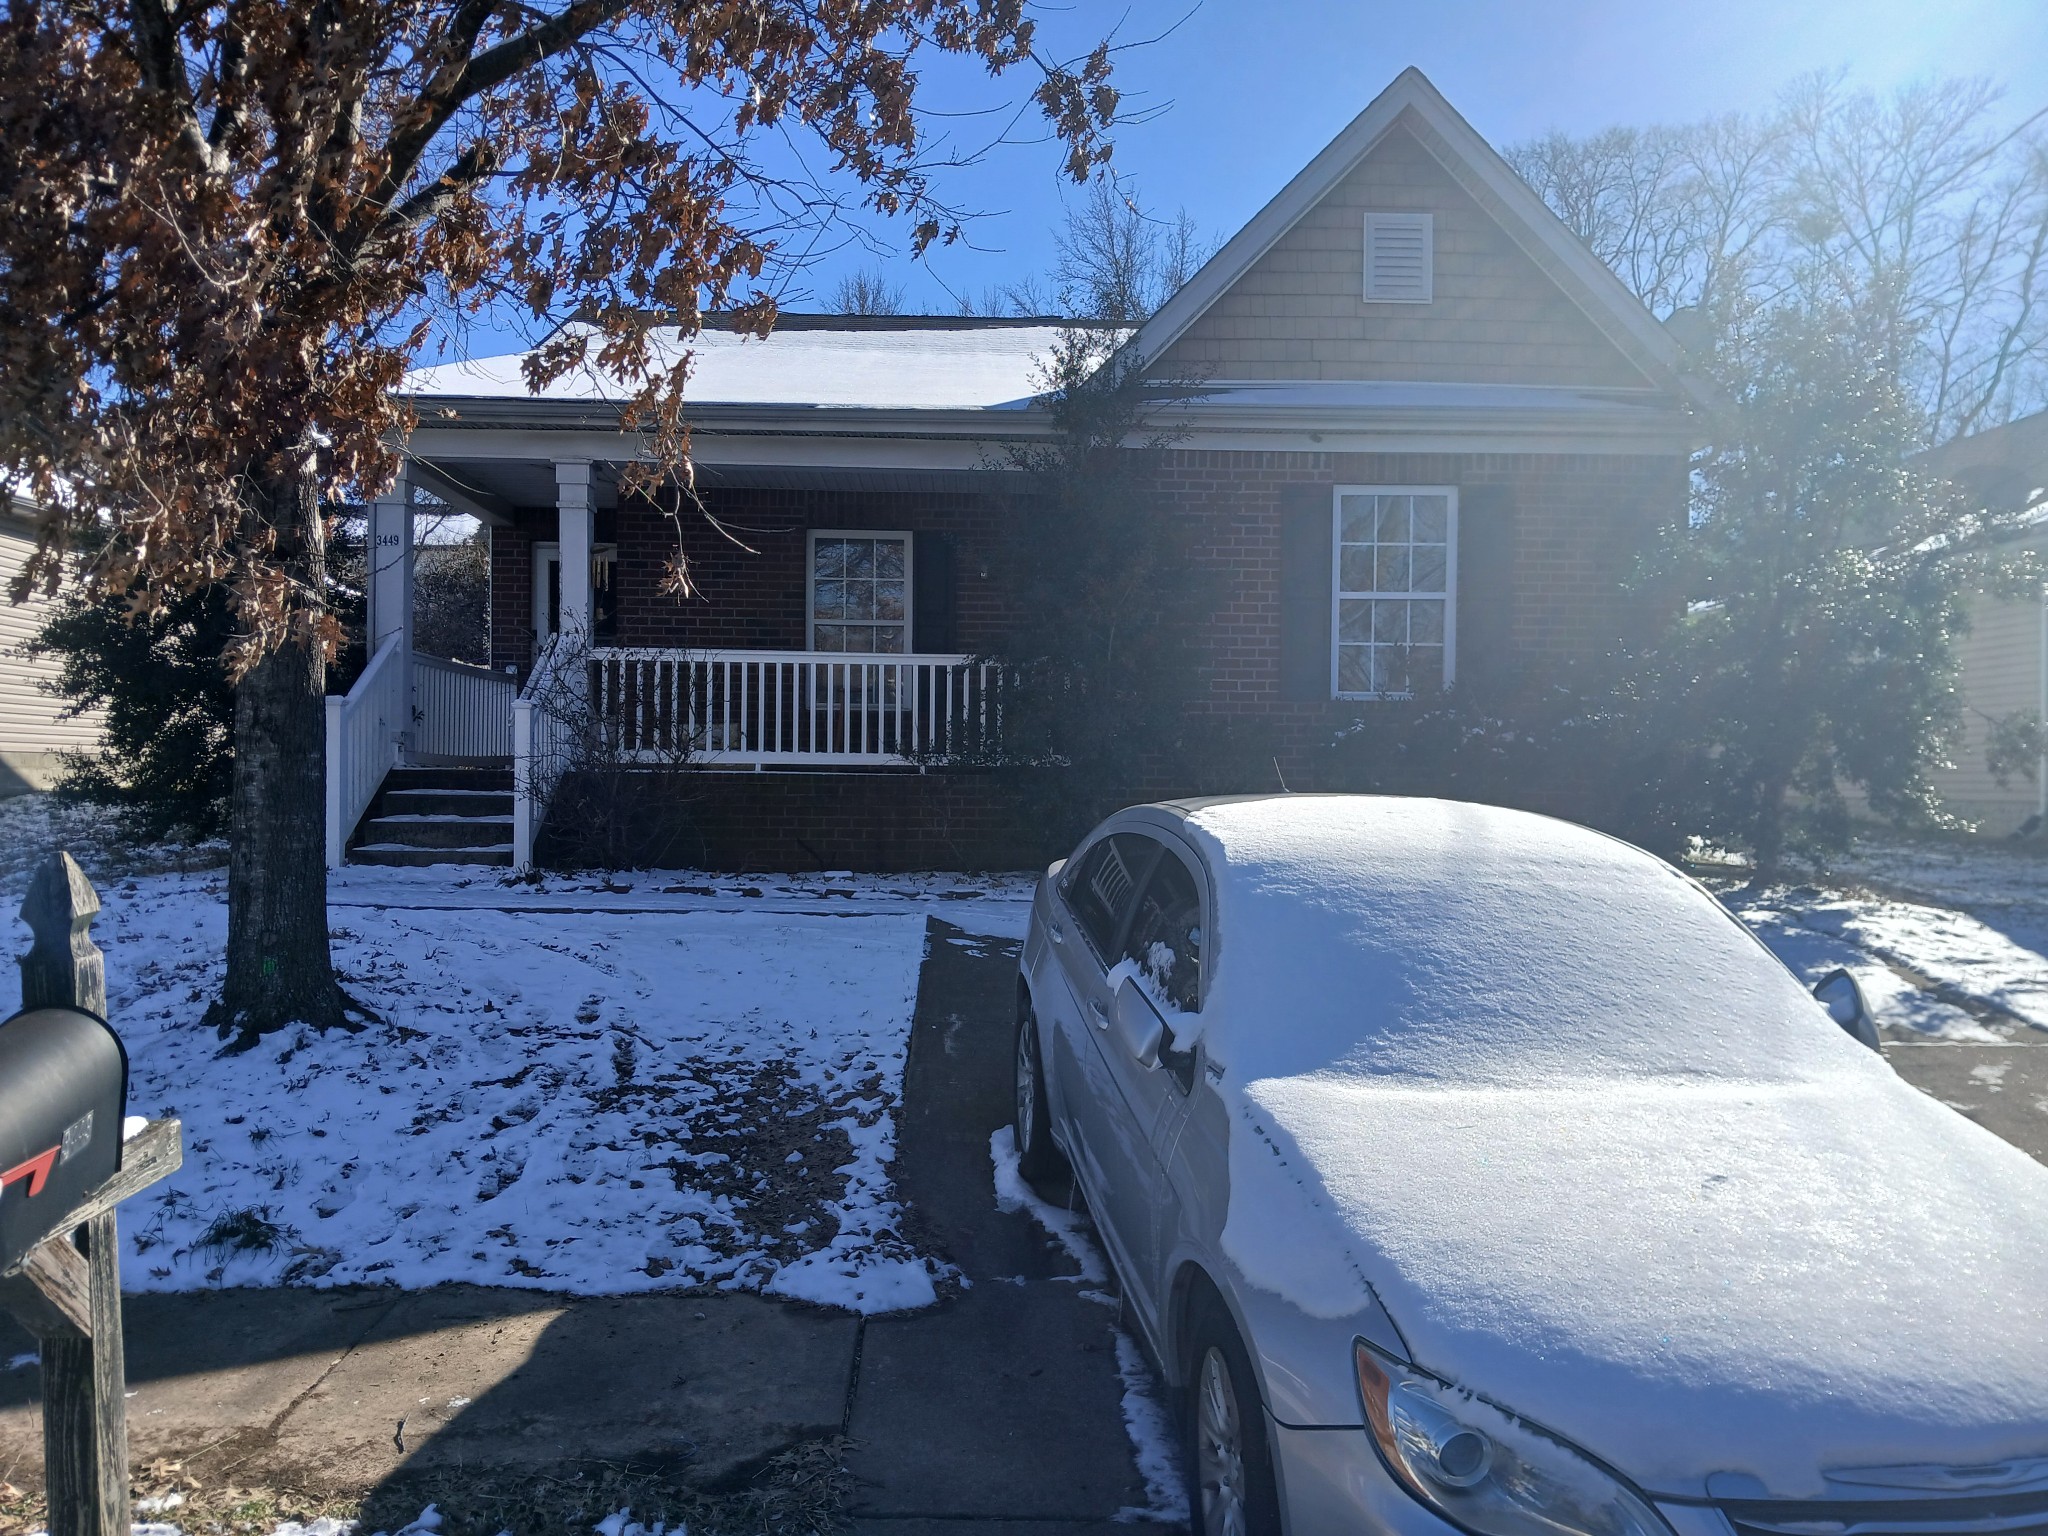
$325,000
3
bds
|
2
ba
|
1,500
sqft
|
built
2005
3449 Rainwood Dr, Nashville, TN 37207
$-145
Cash flow
-2.3%
Cash-on-Cash Return
5.1%
Cap rate
0.7%
Rent to Value Ratio
$620,000
3
bds
|
4
ba
|
1,554
sqft
|
built
2013
2003 Convent Pl, Nashville, TN 37212
$-1,404
Cash flow
-11.8%
Cash-on-Cash Return
3.0%
Cap rate
0.5%
Rent to Value Ratio
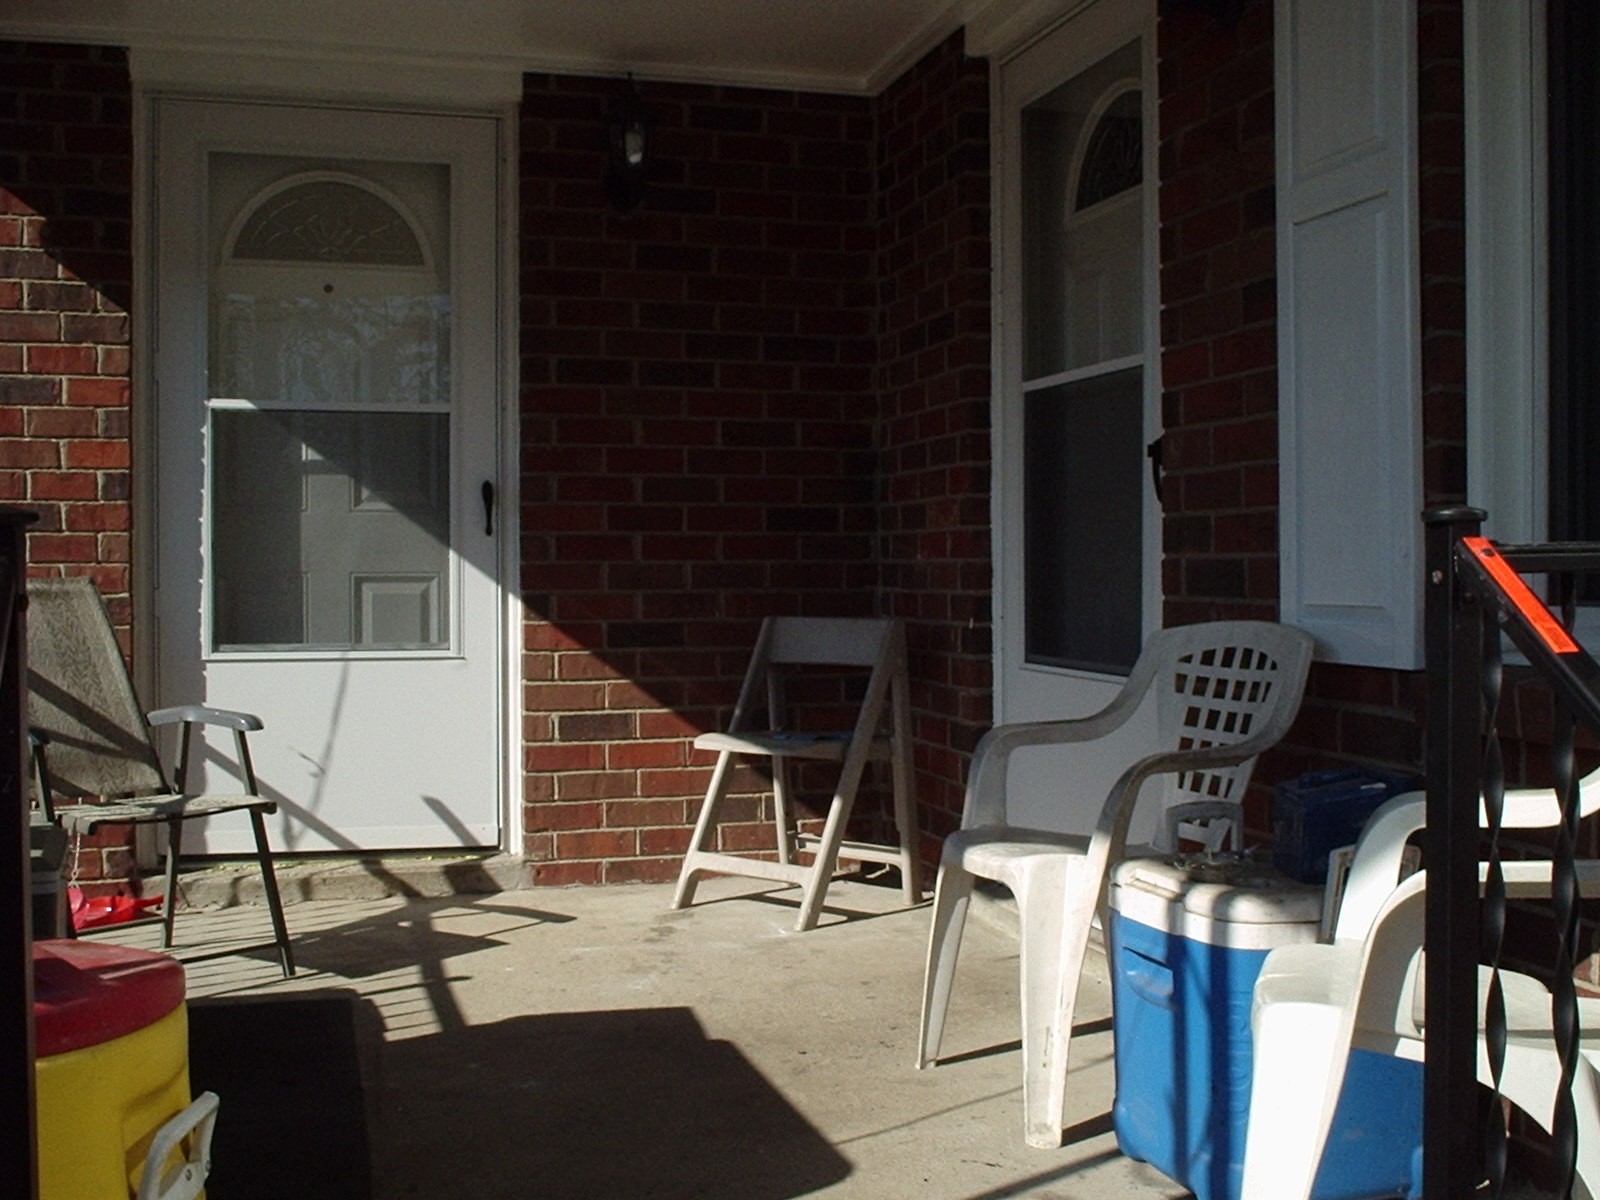
$420,000
4
bds
|
1
ba
|
1,200
sqft
|
built
1960
4109 Edwards Ave, Nashville, TN 37216
$-632
Cash flow
-7.9%
Cash-on-Cash Return
3.9%
Cap rate
0.5%
Rent to Value Ratio
$995,000
2
bds
|
2
ba
|
1,210
sqft
|
built
2014
1212 Laurel St, Nashville, TN 37203
$-2,534
Cash flow
-13.3%
Cash-on-Cash Return
2.6%
Cap rate
0.5%
Rent to Value Ratio
$1,140,000
2
bds
|
2
ba
|
1,187
sqft
|
built
2018
515 Church St, Nashville, TN 37219
$-4,001
Cash flow
-18.3%
Cash-on-Cash Return
1.5%
Cap rate
0.4%
Rent to Value Ratio
$569,000
3
bds
|
2
ba
|
1,325
sqft
|
built
1963
623 Dunston Dr, Nashville, TN 37211
$-1,294
Cash flow
-11.9%
Cash-on-Cash Return
3.0%
Cap rate
0.4%
Rent to Value Ratio
$539,899
4
bds
|
3
ba
|
1,525
sqft
|
built
1968
437 Ezell Pike, Nashville, TN 37217
$-670
Cash flow
-6.5%
Cash-on-Cash Return
4.2%
Cap rate
0.5%
Rent to Value Ratio
$474,900
4
bds
|
2
ba
|
1,815
sqft
|
built
1966
486 Westcrest Dr, Nashville, TN 37211
$316
Cash flow
3.5%
Cash-on-Cash Return
6.5%
Cap rate
0.8%
Rent to Value Ratio
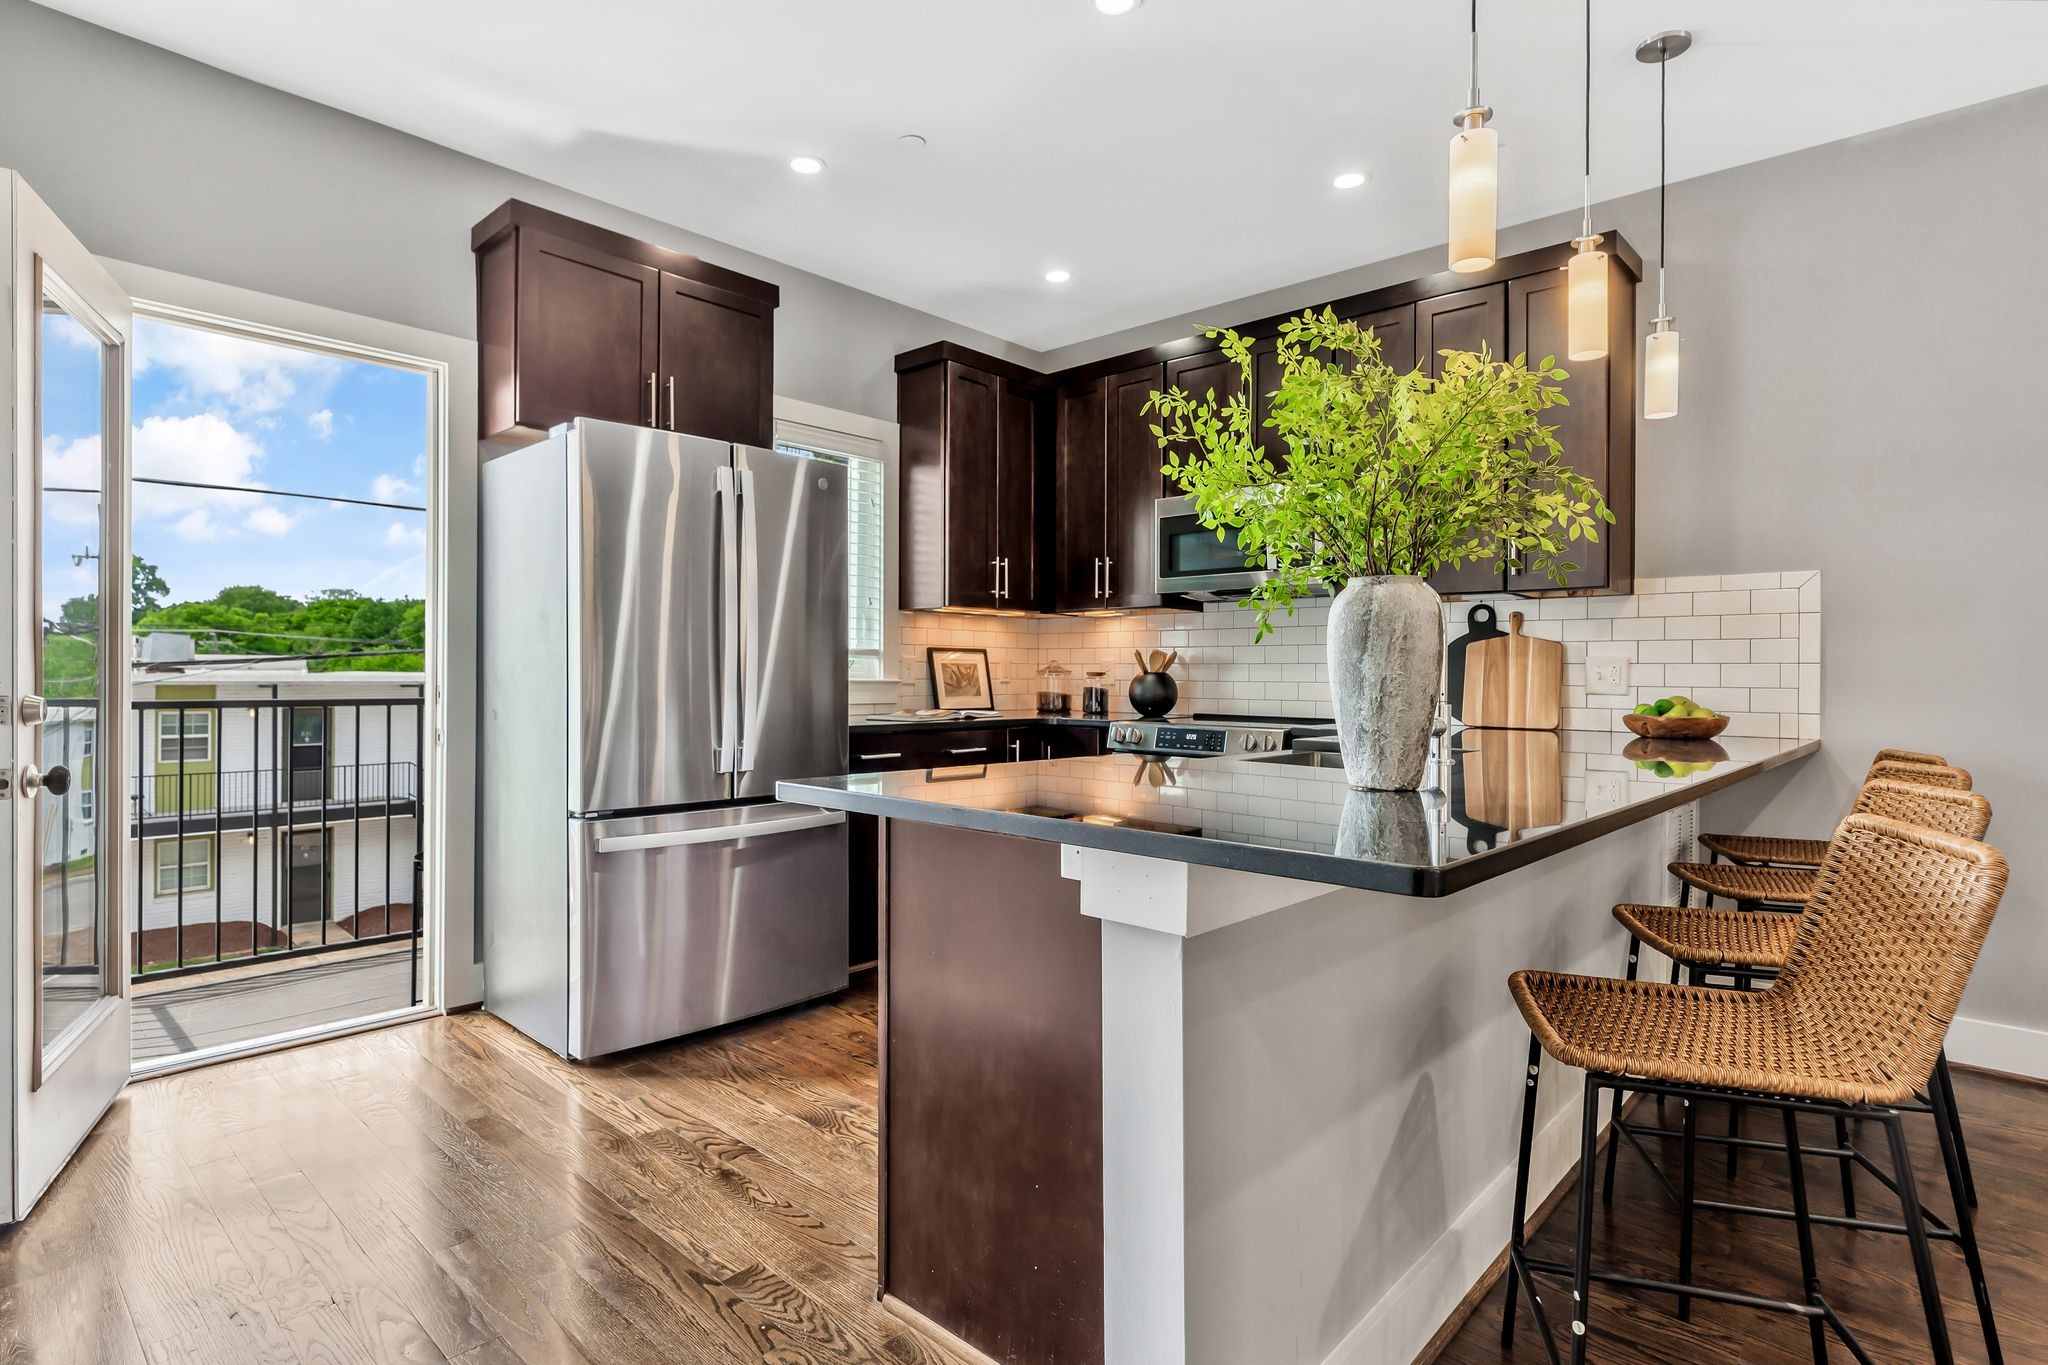
$499,000
2
bds
|
2
ba
|
1,146
sqft
|
built
2017
2407 8th Ave S, Nashville, TN 37204
n/a
Cash flow
n/a
Cash-on-Cash Return
n/a
Cap rate
n/a
Rent to Value Ratio

$535,000
3
bds
|
4
ba
|
1,753
sqft
|
built
2003
3632 Crossbrooke Dr, Nashville, TN 37221
$-623
Cash flow
-6.1%
Cash-on-Cash Return
4.3%
Cap rate
0.6%
Rent to Value Ratio
$259,900
2
bds
|
2
ba
|
1,270
sqft
|
built
1986
1115 Waggoner Ct W, Nashville, TN 37214
$453
Cash flow
9.1%
Cash-on-Cash Return
7.8%
Cap rate
1.0%
Rent to Value Ratio
$429,900
2
bds
|
2
ba
|
814
sqft
|
built
1960
1403 Davidson St, Nashville, TN 37206
$-734
Cash flow
-8.9%
Cash-on-Cash Return
3.6%
Cap rate
0.5%
Rent to Value Ratio
$1,299,000
4
bds
|
4
ba
|
2,944
sqft
|
built
2013
604B Hume St, Nashville, TN 37208
$-2,476
Cash flow
-9.9%
Cash-on-Cash Return
3.4%
Cap rate
0.5%
Rent to Value Ratio
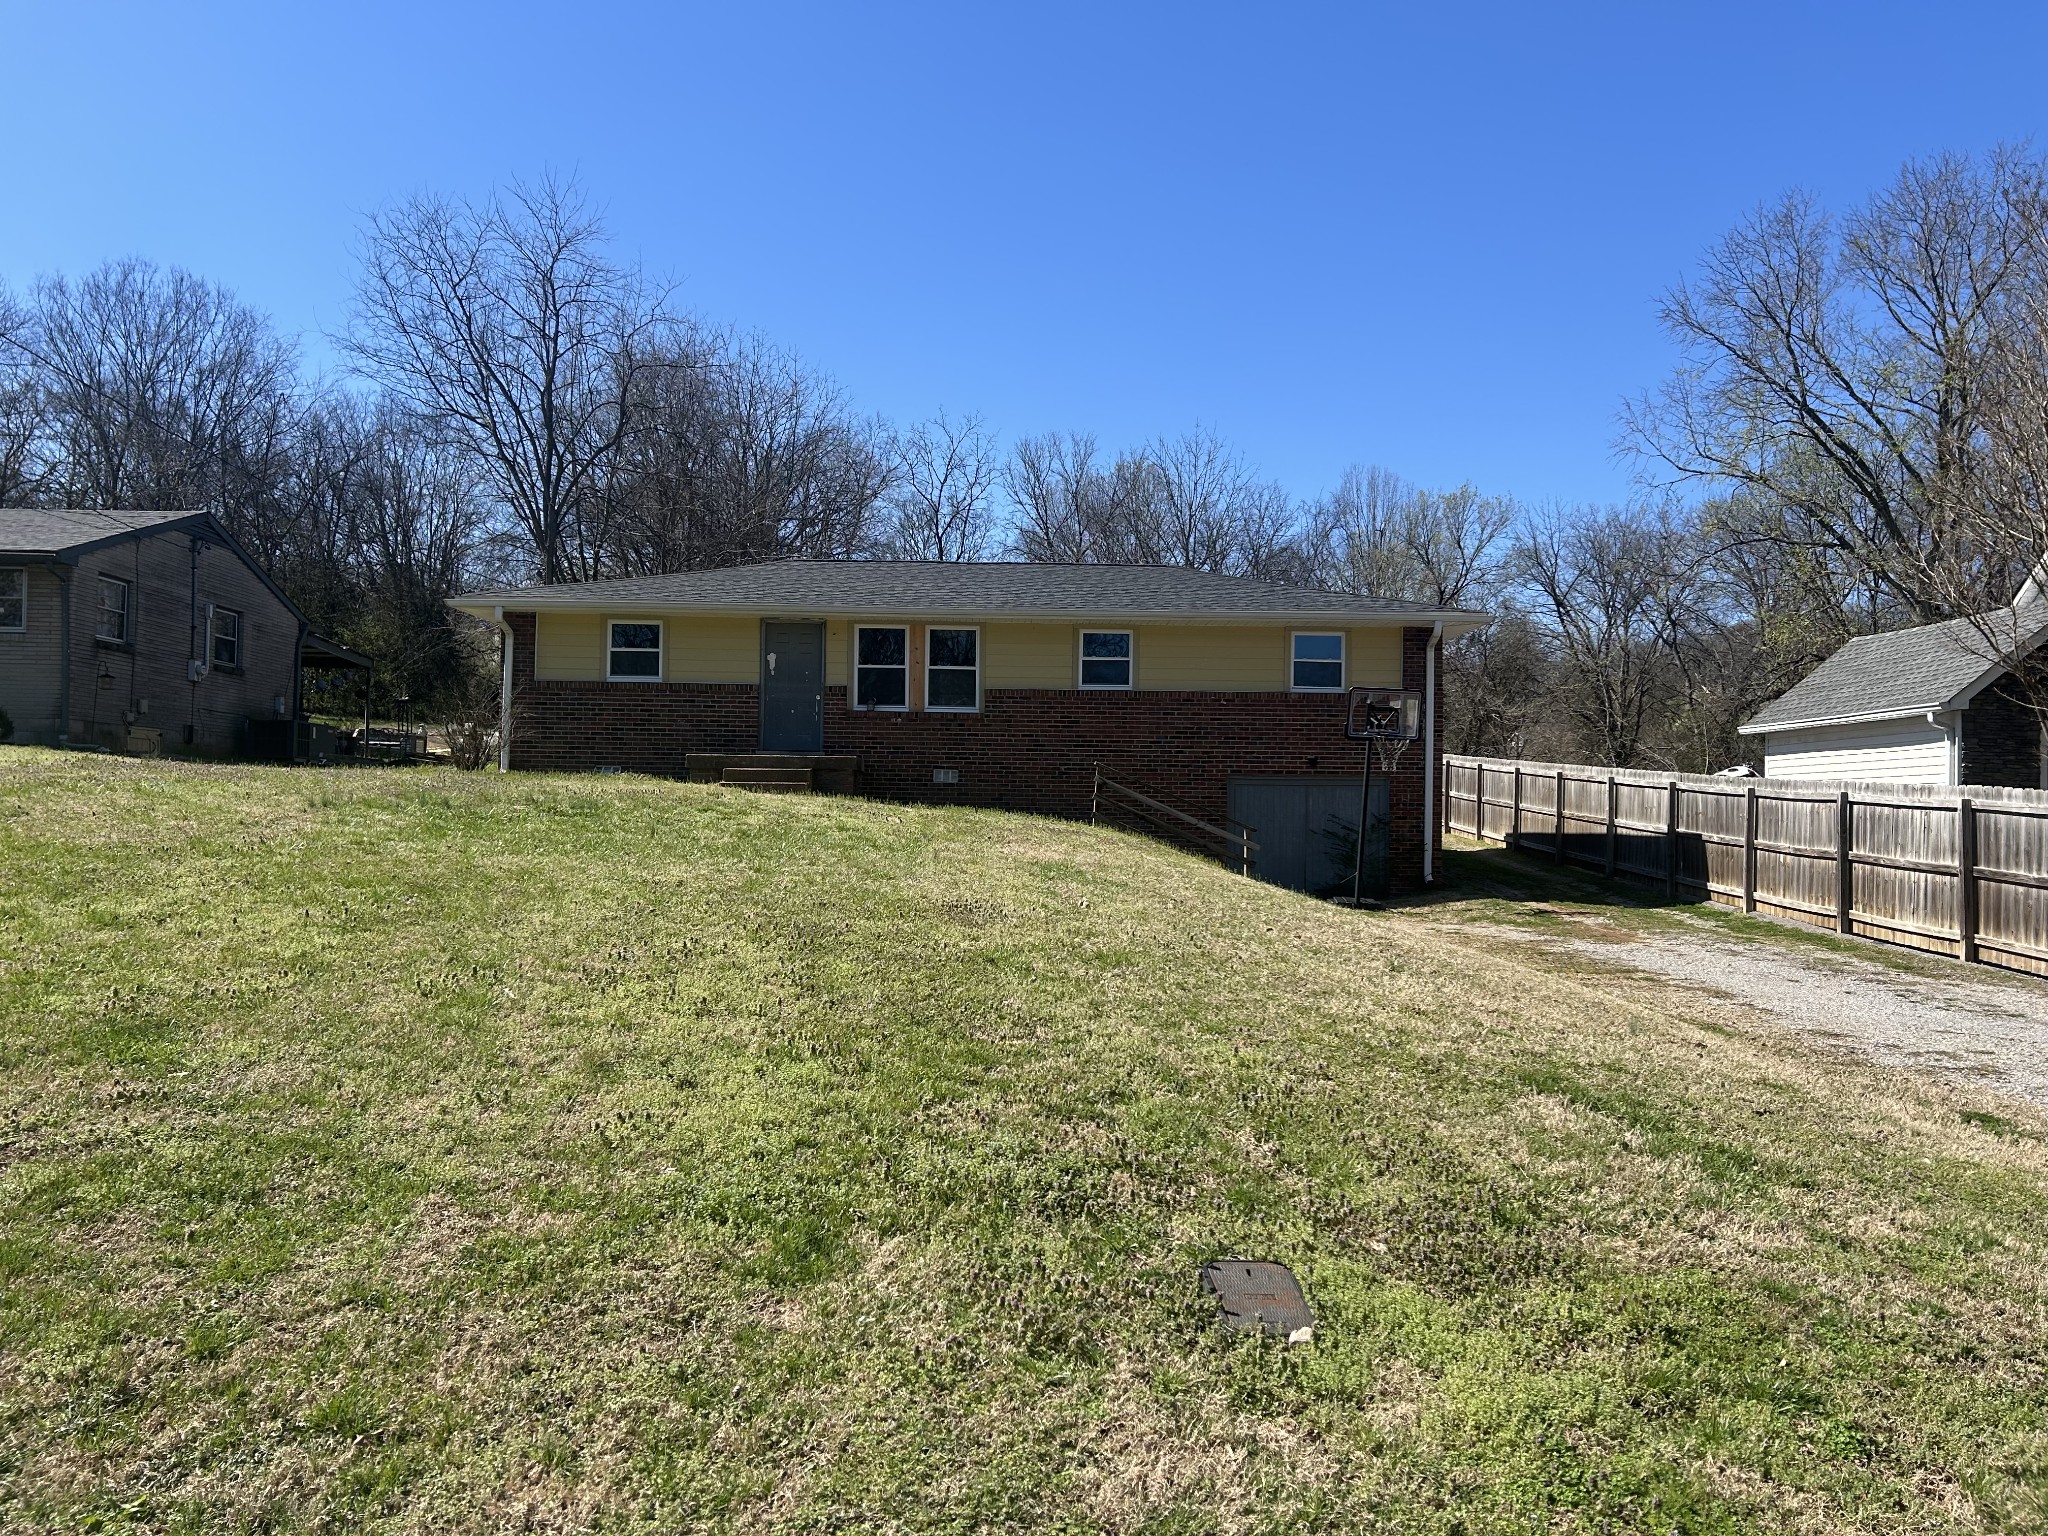
$225,000
2
bds
|
2
ba
|
1,143
sqft
|
built
1985
138 N Timber Dr, Nashville, TN 37214
$-272
Cash flow
-6.3%
Cash-on-Cash Return
4.2%
Cap rate
0.8%
Rent to Value Ratio

$230,000
2
bds
|
2
ba
|
1,143
sqft
|
built
1985
139 N Timber Dr, Nashville, TN 37214
$-295
Cash flow
-6.7%
Cash-on-Cash Return
4.1%
Cap rate
0.7%
Rent to Value Ratio
$285,000
2
bds
|
2
ba
|
1,242
sqft
|
built
1998
3337 Niagara Dr, Nashville, TN 37214
$-371
Cash flow
-6.8%
Cash-on-Cash Return
4.1%
Cap rate
0.6%
Rent to Value Ratio
$2,839,600
BiggerPockets Estimate
Our estimate offers a data-driven snapshot of this property’s current market value, using available information about the home and local trends.
BiggerPockets estimate
BiggerPockets Estimate
Our estimate offers a data-driven snapshot of this property’s current market value, using available information about the home and local trends.
BiggerPockets estimate
4
bds
|
4.5
ba
|
3,640
sqft
|
built
2024
1304 15th Ave S, Nashville, TN 37212
$-8,192
Cash flow
-15.1%
Cash-on-Cash Return
2.2%
Cap rate
0.3%
Rent to Value Ratio
$4,699,999
2
bds
|
3
ba
|
2,323
sqft
|
built
2022
160 2nd Ave S, Nashville, TN 37201
$-24,338
Cash flow
-27.0%
Cash-on-Cash Return
-0.5%
Cap rate
0.1%
Rent to Value Ratio

$1,800,000
2
bds
|
2
ba
|
1,321
sqft
|
built
2018
515 Church St, Nashville, TN 37219
$-6,110
Cash flow
-17.7%
Cash-on-Cash Return
1.6%
Cap rate
0.3%
Rent to Value Ratio
$400,000
4
bds
|
0
ba
|
1,656
sqft
|
built
1979
7 Peachtree St, Nashville, TN 37210
$-769
Cash flow
-10.0%
Cash-on-Cash Return
3.4%
Cap rate
0.5%
Rent to Value Ratio
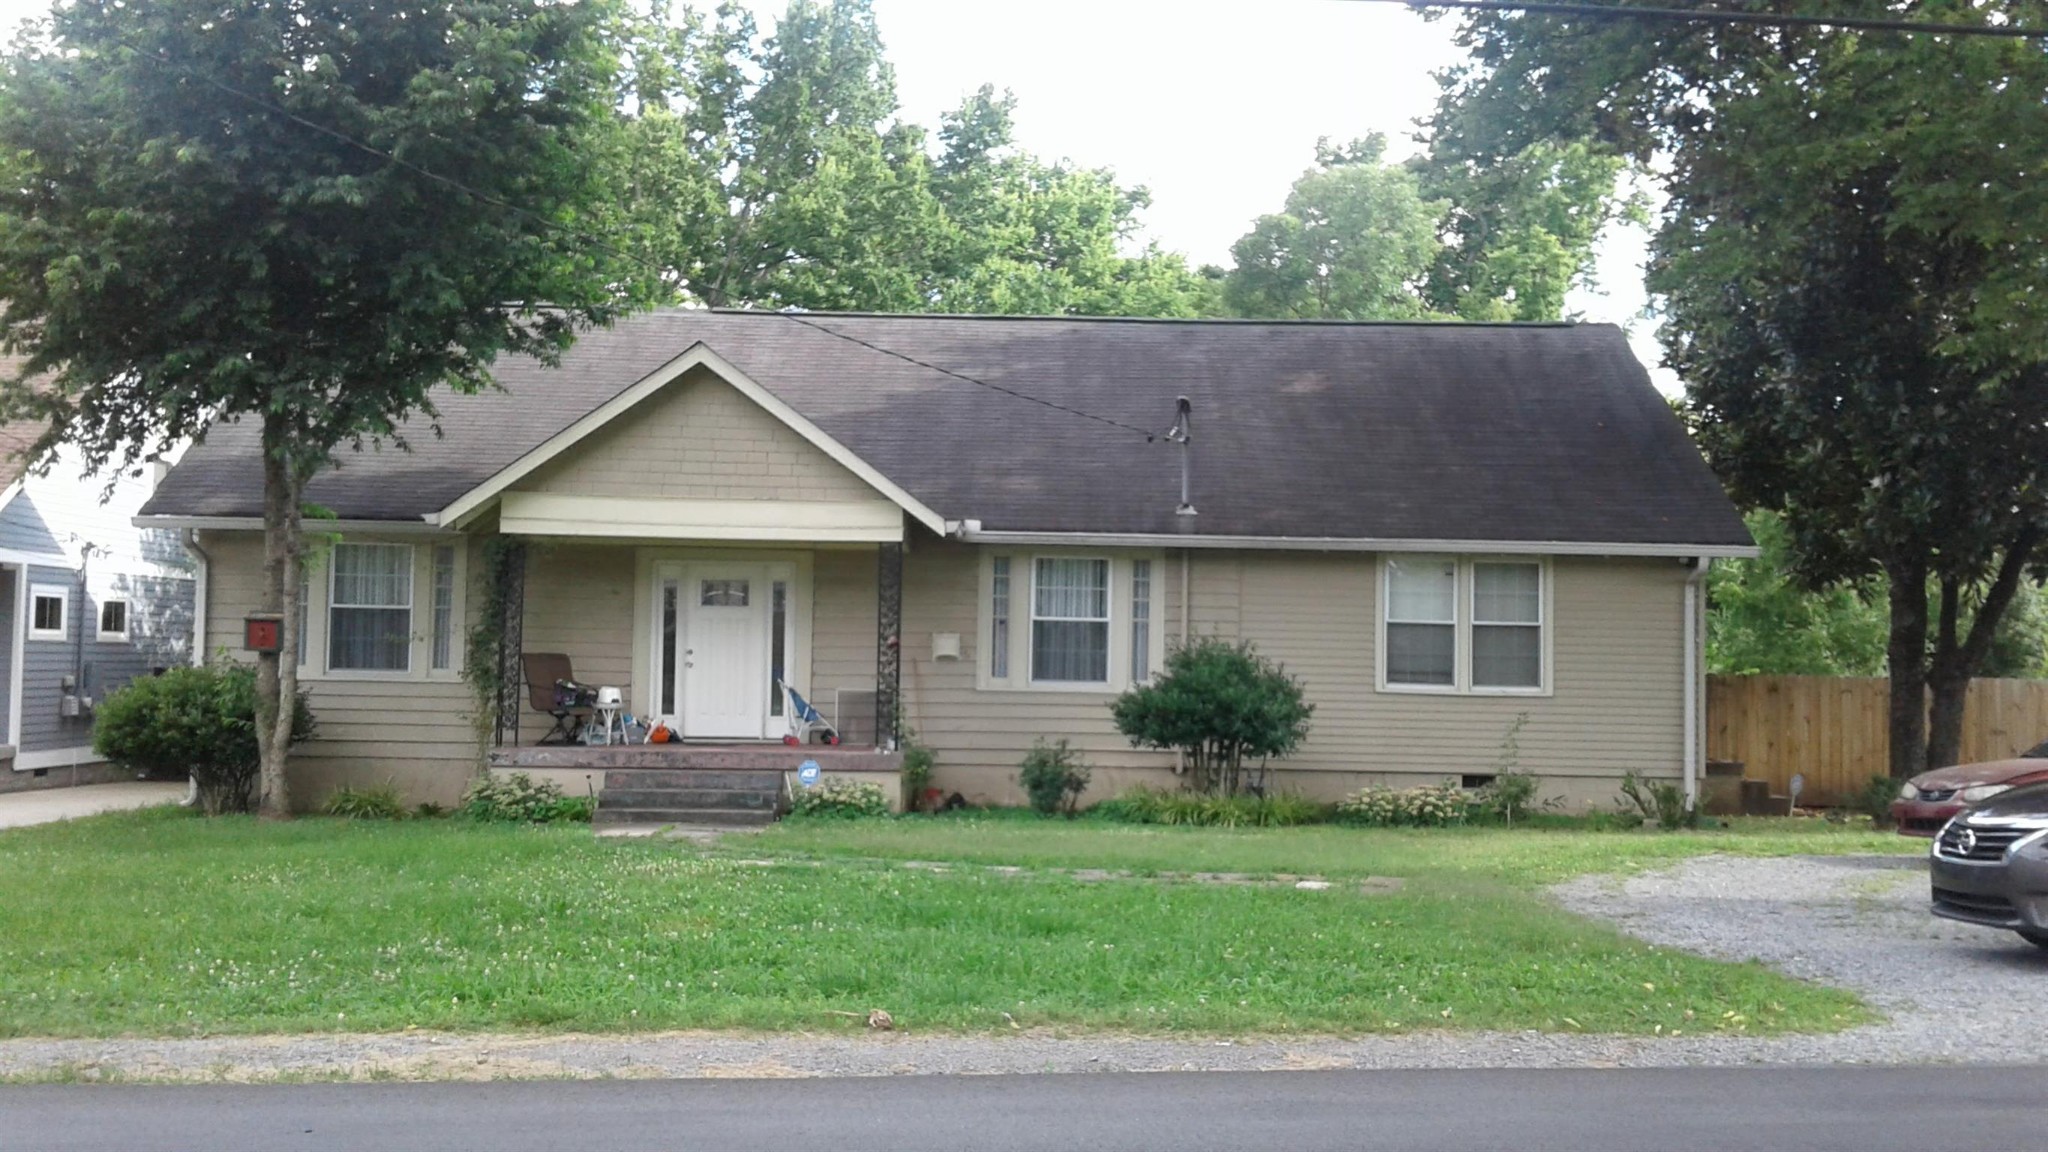
$325,000
3
bds
|
2
ba
|
1,000
sqft
|
built
1940
1108 Kellow St, Nashville, TN 37208
$-409
Cash flow
-6.6%
Cash-on-Cash Return
4.2%
Cap rate
0.6%
Rent to Value Ratio
$650,000
4
bds
|
0
ba
|
1,742
sqft
|
built
1987
708 S 14th St, Nashville, TN 37206
$-1,986
Cash flow
-15.9%
Cash-on-Cash Return
2.0%
Cap rate
0.3%
Rent to Value Ratio
$850,000
3
bds
|
3
ba
|
1,880
sqft
|
built
1948
1110 Stratford Ave, Nashville, TN 37216
$-2,321
Cash flow
-14.2%
Cash-on-Cash Return
2.4%
Cap rate
0.3%
Rent to Value Ratio
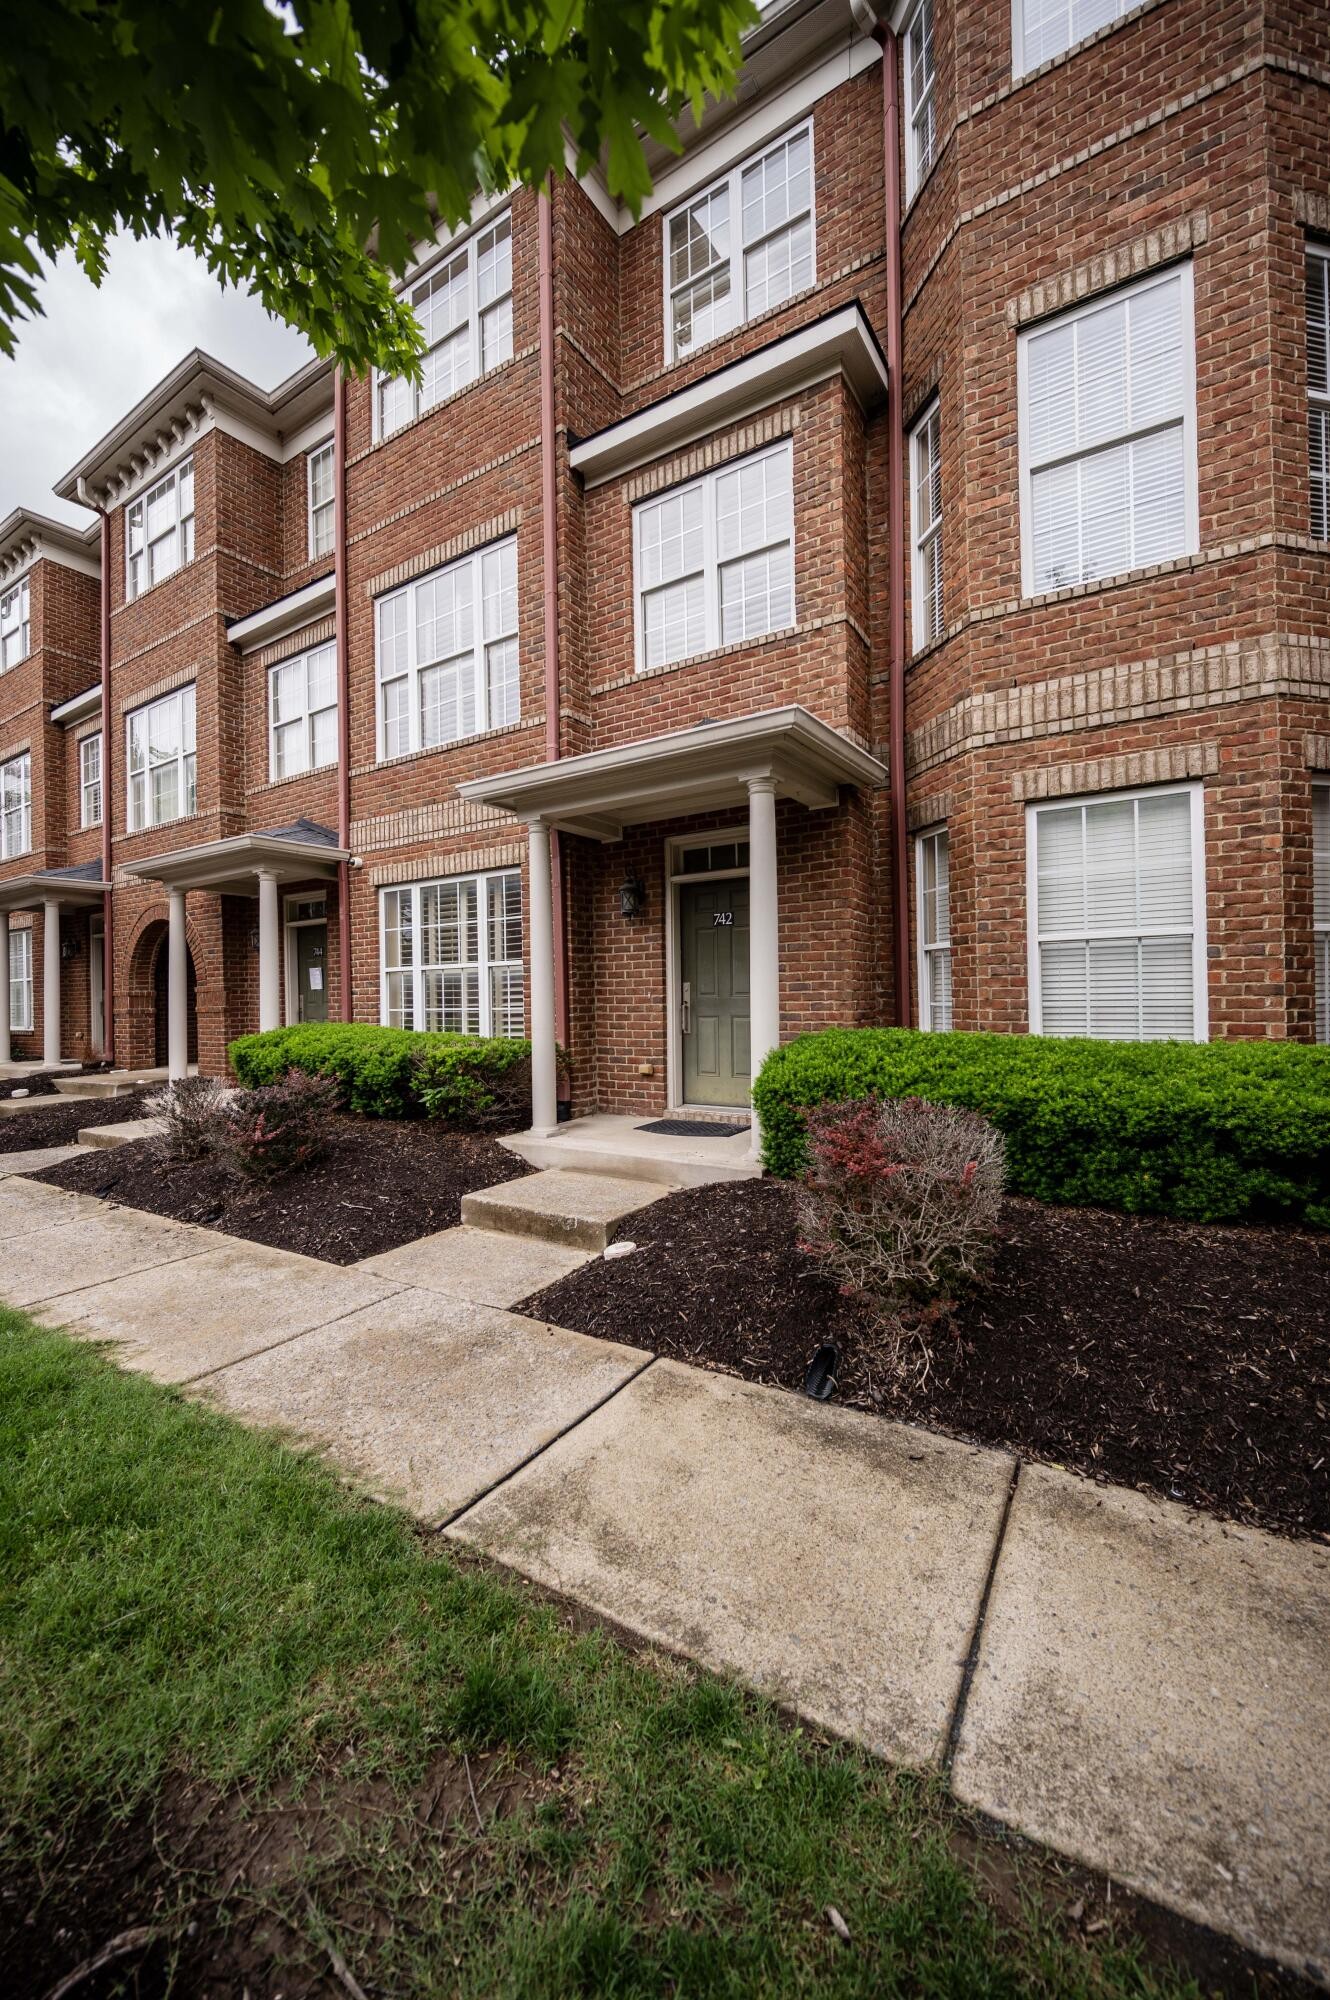
$589,000
2
bds
|
3
ba
|
1,789
sqft
|
built
2007
742 Wedgewood Park, Nashville, TN 37203
$-944
Cash flow
-8.4%
Cash-on-Cash Return
3.8%
Cap rate
0.6%
Rent to Value Ratio