Tomball, TX Investment Properties for Sale
Browse homes for sale and investment properties in Tomball, TX. Refine your search by price, property type, or more.
Best cash flowing properties in Tomball, TX

Active
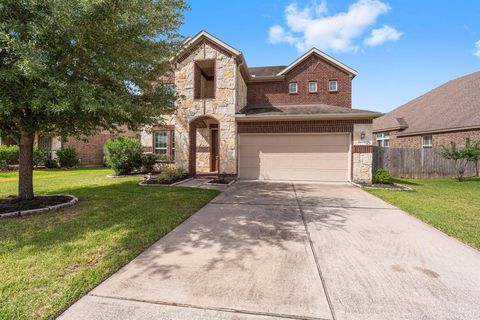
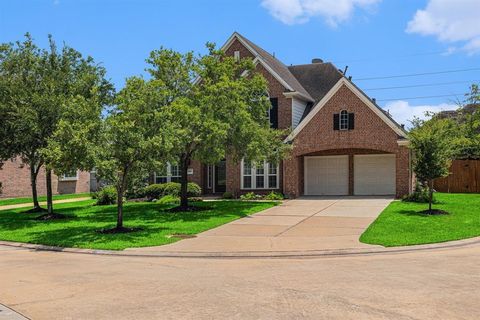
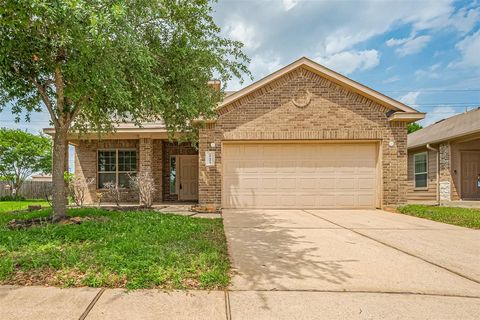
$275,000
4
bds
|
0
ba
|
2,080
sqft
|
built
2002
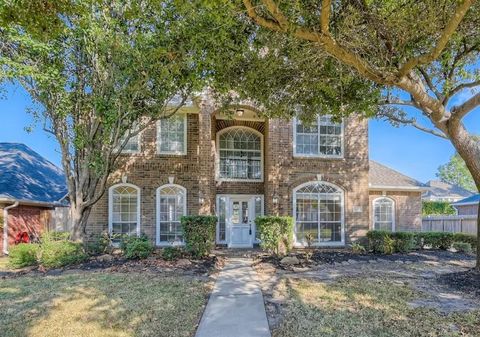
19311 Twin Buttes Dr, Tomball, TX 77375
$44
Cash flow
0.8%
Cash-on-Cash Return
6.5%
Cap rate
0.8%
Rent to Value Ratio

Active
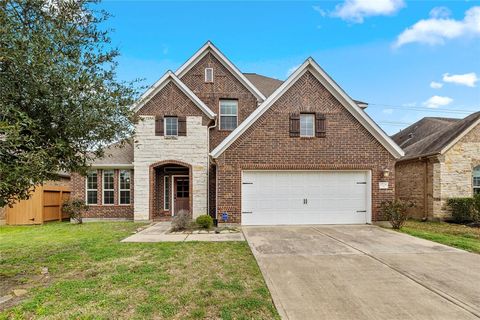
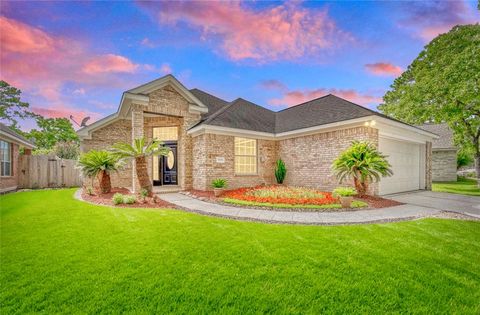
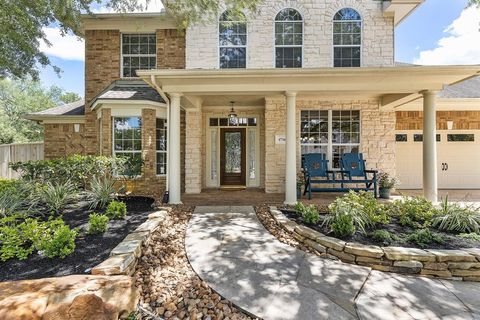
$489,900
5
bds
|
0
ba
|
3,022
sqft
|
built
2023
11211 Stirton Dr, Tomball, TX 77375
$-143
Cash flow
-1.5%
Cash-on-Cash Return
5.9%
Cap rate
0.7%
Rent to Value Ratio
368 out of 442 properties for sale in Tomball, TX
Limited Results Shown
Create a free account, or log in to reveal all property listings and enjoy the complete experience.
Active
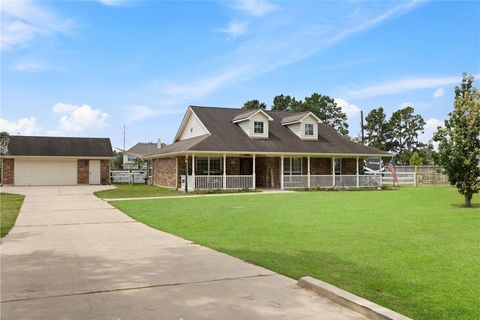
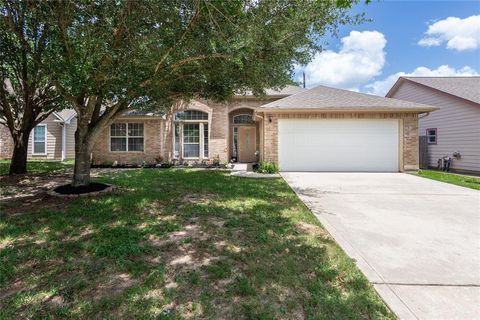
$457,000
4
bds
|
0
ba
|
2,911
sqft
|
built
2014
18115 Fernwood Bend Dr, Tomball, TX 77377
$-546
Cash flow
-6.2%
Cash-on-Cash Return
4.8%
Cap rate
0.6%
Rent to Value Ratio

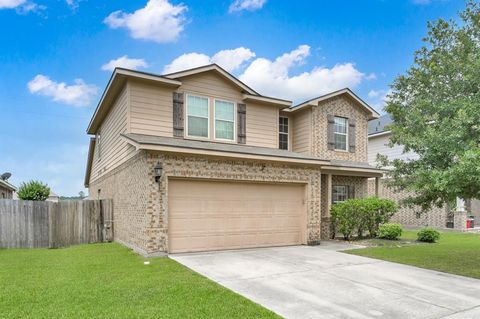
Active
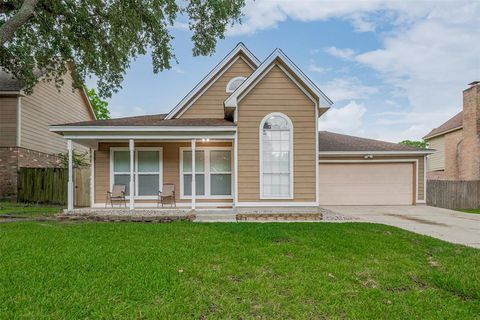
$379,500
3
bds
|
0
ba
|
2,626
sqft
|
built
2000
11714 Goldstream Ct, Tomball, TX 77377
$-970
Cash flow
-13.3%
Cash-on-Cash Return
3.2%
Cap rate
0.7%
Rent to Value Ratio

Active
$495,000
4
bds
|
0
ba
|
3,407
sqft
|
built
2003
11510 Maple Falls Dr, Tomball, TX 77377
$-1,297
Cash flow
-13.7%
Cash-on-Cash Return
3.1%
Cap rate
0.6%
Rent to Value Ratio
Active
$455,000
4
bds
|
0
ba
|
3,398
sqft
|
built
2014
22726 Little Blue Stem Dr, Tomball, TX 77375
$-1,092
Cash flow
-12.5%
Cash-on-Cash Return
3.4%
Cap rate
0.7%
Rent to Value Ratio
Active
$700,000
3
bds
|
0
ba
|
2,238
sqft
|
built
2009
10711 Indian Trails Dr, Tomball, TX 77375
$-2,506
Cash flow
-18.7%
Cash-on-Cash Return
2.0%
Cap rate
0.4%
Rent to Value Ratio
Active
$325,000
5
bds
|
0
ba
|
2,309
sqft
|
built
2012
24603 Sandusky Dr, Tomball, TX 77375
$-866
Cash flow
-13.9%
Cash-on-Cash Return
3.1%
Cap rate
0.7%
Rent to Value Ratio
Active
$559,000
4
bds
|
0
ba
|
3,627
sqft
|
built
2004
12631 Midland Creek Dr, Tomball, TX 77377
$-1,551
Cash flow
-14.5%
Cash-on-Cash Return
2.9%
Cap rate
0.6%
Rent to Value Ratio

Active
$1,750,000
3
bds
|
0
ba
|
2,348
sqft
|
built
1967
12943 Spring Cypress Rd, Tomball, TX 77377
$-7,742
Cash flow
-23.1%
Cash-on-Cash Return
1.0%
Cap rate
0.2%
Rent to Value Ratio
Active
$390,000
4
bds
|
0
ba
|
1,994
sqft
|
built
1999
19019 Northcanyon Dr, Tomball, TX 77377
$-754
Cash flow
-10.1%
Cash-on-Cash Return
3.9%
Cap rate
0.5%
Rent to Value Ratio
Active
$269,000
3
bds
|
0
ba
|
1,696
sqft
|
built
2003
1511 Ashley Ct, Tomball, TX 77375
$-499
Cash flow
-9.7%
Cash-on-Cash Return
4.0%
Cap rate
0.7%
Rent to Value Ratio

Active
$300,000
3
bds
|
0
ba
|
1,444
sqft
|
built
2012
12915 Taper Reach Dr, Tomball, TX 77377
$-345
Cash flow
-6.0%
Cash-on-Cash Return
4.9%
Cap rate
0.9%
Rent to Value Ratio

Active
$299,999
4
bds
|
0
ba
|
2,166
sqft
|
built
2008
8306 Calico Canyon Dr, Tomball, TX 77375
$-650
Cash flow
-11.3%
Cash-on-Cash Return
3.7%
Cap rate
0.8%
Rent to Value Ratio
Active
$255,000
3
bds
|
0
ba
|
1,737
sqft
|
built
1981
22823 Black Willow Dr, Tomball, TX 77375
$-500
Cash flow
-10.2%
Cash-on-Cash Return
3.9%
Cap rate
0.8%
Rent to Value Ratio

Active
$315,000
3
bds
|
0
ba
|
1,635
sqft
|
built
2018
9923 Berlander Ash Ln, Tomball, TX 77375
$-891
Cash flow
-14.8%
Cash-on-Cash Return
2.9%
Cap rate
0.6%
Rent to Value Ratio
Active
$465,000
4
bds
|
0
ba
|
2,438
sqft
|
built
2022
20514 Yearling Pasture Ln, Tomball, TX 77377
$-997
Cash flow
-11.2%
Cash-on-Cash Return
3.7%
Cap rate
0.7%
Rent to Value Ratio

Active
$600,000
4
bds
|
0
ba
|
3,779
sqft
|
built
2020
19219 Filly Park Cir, Tomball, TX 77377
$-1,809
Cash flow
-15.7%
Cash-on-Cash Return
2.6%
Cap rate
0.7%
Rent to Value Ratio
Active
$1,270,000
5
bds
|
0
ba
|
5,913
sqft
|
built
1994
22222 Holly Creek Trl, Tomball, TX 77377
$-3,341
Cash flow
-13.7%
Cash-on-Cash Return
3.1%
Cap rate
0.5%
Rent to Value Ratio

Active
$399,000
4
bds
|
0
ba
|
2,248
sqft
|
built
2021
20806 Gray Percheron Ln, Tomball, TX 77377
$-1,239
Cash flow
-16.2%
Cash-on-Cash Return
2.5%
Cap rate
0.7%
Rent to Value Ratio
Active
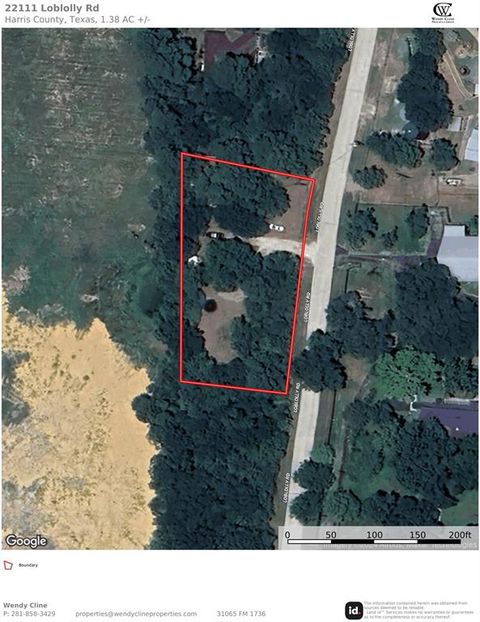
$375,000
1
bds
|
0
ba
|
440
sqft
|
built
2000
22111 Loblolly Dr, Tomball, TX 77377
$-1,331
Cash flow
-18.5%
Cash-on-Cash Return
2.0%
Cap rate
0.3%
Rent to Value Ratio
Active
$1,100,000
5
bds
|
0
ba
|
4,663
sqft
|
built
1998
8615 Haven Woods Way, Tomball, TX 77375
$-2,526
Cash flow
-12.0%
Cash-on-Cash Return
3.5%
Cap rate
0.6%
Rent to Value Ratio
Active
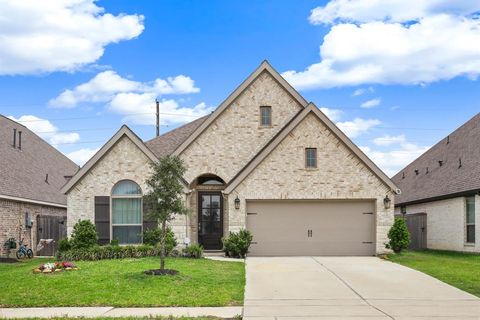
$275,000
4
bds
|
0
ba
|
2,080
sqft
|
built
2002
19311 Twin Buttes Dr, Tomball, TX 77375
$44
Cash flow
0.8%
Cash-on-Cash Return
6.5%
Cap rate
0.8%
Rent to Value Ratio
Active
$389,900
4
bds
|
0
ba
|
2,548
sqft
|
built
1996
31330 Capella Cir, Tomball, TX 77375
$-848
Cash flow
-11.3%
Cash-on-Cash Return
3.7%
Cap rate
0.6%
Rent to Value Ratio
Active
$365,000
4
bds
|
0
ba
|
2,076
sqft
|
built
2023
10718 Soapberry Ct, Tomball, TX 77375
$-984
Cash flow
-14.1%
Cash-on-Cash Return
3.0%
Cap rate
0.7%
Rent to Value Ratio

Active
$235,000
3
bds
|
0
ba
|
1,515
sqft
|
built
2005
10219 Cinnaberry Ln, Tomball, TX 77375
$-290
Cash flow
-6.4%
Cash-on-Cash Return
4.8%
Cap rate
0.8%
Rent to Value Ratio

Active
$795,000
4
bds
|
0
ba
|
3,948
sqft
|
built
2022
25014 Ryleigh Cove Cir, Tomball, TX 77375
$-2,270
Cash flow
-14.9%
Cash-on-Cash Return
2.8%
Cap rate
0.6%
Rent to Value Ratio
Active
$299,999
4
bds
|
0
ba
|
1,768
sqft
|
built
2020
18627 Yellow Lily Trl, Tomball, TX 77377
$-666
Cash flow
-11.6%
Cash-on-Cash Return
3.6%
Cap rate
0.8%
Rent to Value Ratio

Active
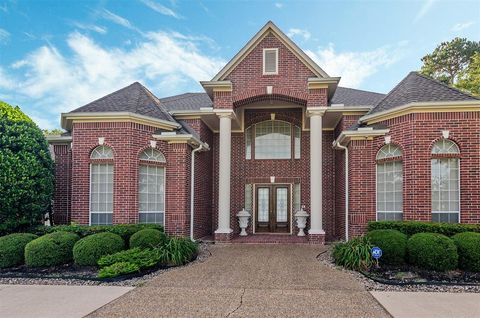
$499,000
4
bds
|
0
ba
|
2,114
sqft
|
built
1970
22010 Buescher Rd, Tomball, TX 77377
$-673
Cash flow
-7.0%
Cash-on-Cash Return
4.6%
Cap rate
0.6%
Rent to Value Ratio
Active
$309,999
3
bds
|
0
ba
|
1,649
sqft
|
built
2003
19426 Dolan Springs Dr, Tomball, TX 77377
$-776
Cash flow
-13.1%
Cash-on-Cash Return
3.3%
Cap rate
0.7%
Rent to Value Ratio
Active
$316,900
4
bds
|
0
ba
|
2,182
sqft
|
built
2012
25451 Dappled Filly Dr, Tomball, TX 77375
$-603
Cash flow
-9.9%
Cash-on-Cash Return
4.0%
Cap rate
0.8%
Rent to Value Ratio
Active
$497,000
4
bds
|
0
ba
|
3,596
sqft
|
built
2000
17314 Sunset Arbor Dr, Tomball, TX 77377
$-1,512
Cash flow
-15.9%
Cash-on-Cash Return
2.6%
Cap rate
0.6%
Rent to Value Ratio

Active
$499,900
3
bds
|
0
ba
|
2,131
sqft
|
built
1985
26010 Le Berge Dr, Tomball, TX 77377
$-1,474
Cash flow
-15.4%
Cash-on-Cash Return
2.7%
Cap rate
0.5%
Rent to Value Ratio

Active
$335,000
3
bds
|
0
ba
|
1,764
sqft
|
built
2013
20119 Ray Falls Dr, Tomball, TX 77375
$-894
Cash flow
-13.9%
Cash-on-Cash Return
3.1%
Cap rate
0.6%
Rent to Value Ratio
Active
$525,000
4
bds
|
0
ba
|
3,172
sqft
|
built
2006
22603 Blanefield Ct, Tomball, TX 77375
$-1,440
Cash flow
-14.3%
Cash-on-Cash Return
3.0%
Cap rate
0.6%
Rent to Value Ratio

Active
$319,900
4
bds
|
0
ba
|
1,980
sqft
|
built
2020
21242 Bush Brook Bend Path, Tomball, TX 77377
$-875
Cash flow
-14.3%
Cash-on-Cash Return
3.0%
Cap rate
0.7%
Rent to Value Ratio

Active
$675,000
5
bds
|
0
ba
|
3,786
sqft
|
built
2022
20618 Yearling Pasture Ln, Tomball, TX 77377
$-2,061
Cash flow
-15.9%
Cash-on-Cash Return
2.6%
Cap rate
0.7%
Rent to Value Ratio
Active
$489,900
5
bds
|
0
ba
|
3,022
sqft
|
built
2023
11211 Stirton Dr, Tomball, TX 77375
$-143
Cash flow
-1.5%
Cash-on-Cash Return
5.9%
Cap rate
0.7%
Rent to Value Ratio

Active
$307,500
4
bds
|
0
ba
|
2,498
sqft
|
built
2000
19222 Wading River Dr, Tomball, TX 77375
$-740
Cash flow
-12.6%
Cash-on-Cash Return
3.4%
Cap rate
0.7%
Rent to Value Ratio

Active
$550,000
4
bds
|
0
ba
|
3,236
sqft
|
built
2023
19238 Seabiscuit Stable Trl, Tomball, TX 77377
$-1,907
Cash flow
-18.1%
Cash-on-Cash Return
2.1%
Cap rate
0.7%
Rent to Value Ratio

Active
$460,000
4
bds
|
0
ba
|
2,712
sqft
|
built
2018
12626 Fort Isabella Dr, Tomball, TX 77375
$-1,070
Cash flow
-12.1%
Cash-on-Cash Return
3.5%
Cap rate
0.7%
Rent to Value Ratio

Active
$950,000
4
bds
|
0
ba
|
3,802
sqft
|
built
2005
11207 Indian Trails Dr, Tomball, TX 77375
$-3,533
Cash flow
-19.4%
Cash-on-Cash Return
1.8%
Cap rate
0.4%
Rent to Value Ratio