Tulsa, OK Investment Properties for Sale
Browse homes for sale and investment properties in Tulsa, OK. Refine your search by price, property type, or more.
Best cash flowing properties in Tulsa, OK
Active
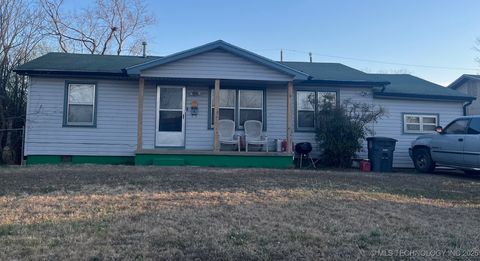
$65,000
3
bds
|
1
ba
|
1,298
sqft
|
built
1960
542 E 59th St N, Tulsa, OK 74126
$791
Cash flow
14.2%
Cash-on-Cash Return
14.6%
Cap rate
1.8%
Rent to Value Ratio

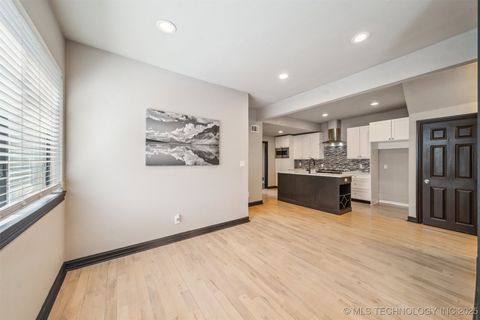
Active
$161,600
3
bds
|
1
ba
|
984
sqft
|
built
1943
1113 N New Haven Ave, Tulsa, OK 74115
$88
Cash flow
2.8%
Cash-on-Cash Return
6.9%
Cap rate
0.9%
Rent to Value Ratio
839 out of 940 properties for sale in Tulsa, OK
Limited Results Shown
Create a free account, or log in to reveal all property listings and enjoy the complete experience.

Active
$1,680,000
3
bds
|
4
ba
|
4,000
sqft
|
built
2023
3190 E 33rd St, Tulsa, OK 74105
$-5,669
Cash flow
-17.6%
Cash-on-Cash Return
2.2%
Cap rate
0.3%
Rent to Value Ratio

Active
$230,000
3
bds
|
1
ba
|
1,446
sqft
|
built
1955
5729 E 24th Pl, Tulsa, OK 74114
$-196
Cash flow
-4.4%
Cash-on-Cash Return
5.2%
Cap rate
0.7%
Rent to Value Ratio

Active
$319,900
4
bds
|
2
ba
|
2,031
sqft
|
built
2024
2016 E 1st St, Tulsa, OK 74104
$-876
Cash flow
-14.3%
Cash-on-Cash Return
3.0%
Cap rate
0.4%
Rent to Value Ratio

Active
$180,000
3
bds
|
2
ba
|
1,133
sqft
|
built
1969
1721 S 114th East Ave, Tulsa, OK 74128
$-276
Cash flow
-8.0%
Cash-on-Cash Return
4.4%
Cap rate
0.7%
Rent to Value Ratio

Active
$277,500
3
bds
|
2
ba
|
1,581
sqft
|
built
1955
4633 S Vandalia Ave, Tulsa, OK 74135
$-513
Cash flow
-9.6%
Cash-on-Cash Return
4.0%
Cap rate
0.6%
Rent to Value Ratio

Active
$495,000
4
bds
|
3
ba
|
2,824
sqft
|
built
1955
4156 E 43rd St, Tulsa, OK 74135
$-1,382
Cash flow
-14.6%
Cash-on-Cash Return
2.9%
Cap rate
0.5%
Rent to Value Ratio

Active
$249,900
3
bds
|
1
ba
|
1,510
sqft
|
built
1947
4641 S Trenton Ave, Tulsa, OK 74105
$-387
Cash flow
-8.1%
Cash-on-Cash Return
4.4%
Cap rate
0.6%
Rent to Value Ratio

Active
$400,000
2
bds
|
2
ba
|
1,290
sqft
|
built
1940
1338 E 34th St, Tulsa, OK 74105
$-1,214
Cash flow
-15.8%
Cash-on-Cash Return
2.6%
Cap rate
0.4%
Rent to Value Ratio

Active
$999,000
3
bds
|
5
ba
|
3,476
sqft
|
built
2018
1316 E 18th St, Tulsa, OK 74120
$-3,872
Cash flow
-20.2%
Cash-on-Cash Return
1.6%
Cap rate
0.3%
Rent to Value Ratio

Active
$117,000
1
bds
|
1
ba
|
564
sqft
|
built
1965
1313 E 48th St, Tulsa, OK 74105
$-270
Cash flow
-12.0%
Cash-on-Cash Return
3.5%
Cap rate
0.7%
Rent to Value Ratio

Active
$655,000
2
bds
|
2
ba
|
1,812
sqft
|
built
1981
2121 S Yorktown Ave, Tulsa, OK 74114
$-3,580
Cash flow
-28.5%
Cash-on-Cash Return
-0.3%
Cap rate
0.3%
Rent to Value Ratio

Active
$875,000
5
bds
|
6
ba
|
5,911
sqft
|
built
2003
11748 S Canton Ave, Tulsa, OK 74137
$-2,938
Cash flow
-17.5%
Cash-on-Cash Return
2.2%
Cap rate
0.4%
Rent to Value Ratio

Active
$589,000
5
bds
|
3
ba
|
3,498
sqft
|
built
1973
8700 S Union Ave, Tulsa, OK 74132
$-1,363
Cash flow
-12.1%
Cash-on-Cash Return
3.5%
Cap rate
0.5%
Rent to Value Ratio

Active
$214,900
3
bds
|
2
ba
|
1,609
sqft
|
built
1938
1223 S Canton Ave, Tulsa, OK 74112
$-193
Cash flow
-4.7%
Cash-on-Cash Return
5.2%
Cap rate
0.7%
Rent to Value Ratio

Active
$374,000
4
bds
|
3
ba
|
2,721
sqft
|
built
2000
7723 S 92nd East Pl, Tulsa, OK 74133
$-818
Cash flow
-11.4%
Cash-on-Cash Return
3.6%
Cap rate
0.6%
Rent to Value Ratio
Active
$362,500
3
bds
|
3
ba
|
1,756
sqft
|
built
1922
1320 S Carson Ave, Tulsa, OK 74119
$-765
Cash flow
-11.0%
Cash-on-Cash Return
3.7%
Cap rate
0.6%
Rent to Value Ratio

Active
$290,000
3
bds
|
2
ba
|
1,369
sqft
|
built
2023
5010 S 90th East Ave, Tulsa, OK 74145
$-695
Cash flow
-12.5%
Cash-on-Cash Return
3.4%
Cap rate
0.5%
Rent to Value Ratio

Active
$1,260,000
5
bds
|
4
ba
|
4,373
sqft
|
built
1926
1331 E 26th St, Tulsa, OK 74114
$-4,373
Cash flow
-18.1%
Cash-on-Cash Return
2.1%
Cap rate
0.4%
Rent to Value Ratio
Active
$161,600
3
bds
|
1
ba
|
984
sqft
|
built
1943
1113 N New Haven Ave, Tulsa, OK 74115
$88
Cash flow
2.8%
Cash-on-Cash Return
6.9%
Cap rate
0.9%
Rent to Value Ratio

Active
$125,000
2
bds
|
2
ba
|
747
sqft
|
built
1965
1737 S Peoria Ave, Tulsa, OK 74120
$-65
Cash flow
-2.7%
Cash-on-Cash Return
5.6%
Cap rate
1.1%
Rent to Value Ratio

Active
$95,000
2
bds
|
1
ba
|
876
sqft
|
built
1973
11031 E 11th Pl, Tulsa, OK 74128
$-26
Cash flow
-1.4%
Cash-on-Cash Return
5.9%
Cap rate
1.4%
Rent to Value Ratio

Active
$279,900
3
bds
|
2
ba
|
1,973
sqft
|
built
1976
6817 E 95th St, Tulsa, OK 74133
$-486
Cash flow
-9.1%
Cash-on-Cash Return
4.2%
Cap rate
0.6%
Rent to Value Ratio

Active
$285,000
3
bds
|
2
ba
|
2,256
sqft
|
built
1988
7528 S Trenton Pl, Tulsa, OK 74136
$-549
Cash flow
-10.1%
Cash-on-Cash Return
4.0%
Cap rate
0.6%
Rent to Value Ratio

Active
$194,900
3
bds
|
1
ba
|
1,458
sqft
|
built
1967
46 S 188th East Ave, Tulsa, OK 74108
$-35
Cash flow
-0.9%
Cash-on-Cash Return
6.1%
Cap rate
0.8%
Rent to Value Ratio

Active
$725,000
6
bds
|
5
ba
|
4,463
sqft
|
built
2010
10848 S 95th East Ave, Tulsa, OK 74133
$-1,585
Cash flow
-11.4%
Cash-on-Cash Return
3.6%
Cap rate
0.6%
Rent to Value Ratio

Active
$162,500
3
bds
|
2
ba
|
1,118
sqft
|
built
1946
332 E Zion St, Tulsa, OK 74106
$-61
Cash flow
-2.0%
Cash-on-Cash Return
5.8%
Cap rate
0.9%
Rent to Value Ratio

Active
$152,500
3
bds
|
2
ba
|
1,278
sqft
|
built
1910
1406 W Admiral Blvd, Tulsa, OK 74127
$9
Cash flow
0.3%
Cash-on-Cash Return
6.3%
Cap rate
0.9%
Rent to Value Ratio

Active
$675,000
4
bds
|
4
ba
|
4,409
sqft
|
built
1955
3121 E 33rd St, Tulsa, OK 74105
$-1,378
Cash flow
-10.7%
Cash-on-Cash Return
3.8%
Cap rate
0.6%
Rent to Value Ratio

Pending
$169,750
3
bds
|
2
ba
|
1,066
sqft
|
built
1953
3154 E Woodrow Pl, Tulsa, OK 74110
$-91
Cash flow
-2.8%
Cash-on-Cash Return
5.6%
Cap rate
0.7%
Rent to Value Ratio

Active
$217,000
3
bds
|
2
ba
|
1,619
sqft
|
built
1982
1803 S 84th East Ave, Tulsa, OK 74112
$-318
Cash flow
-7.6%
Cash-on-Cash Return
4.5%
Cap rate
0.6%
Rent to Value Ratio

Active
$1,750,000
5
bds
|
8
ba
|
8,237
sqft
|
built
1996
11503 S Granite Ave, Tulsa, OK 74137
$-7,994
Cash flow
-23.8%
Cash-on-Cash Return
0.8%
Cap rate
0.3%
Rent to Value Ratio

Active
$349,900
4
bds
|
3
ba
|
2,369
sqft
|
built
1935
5770 W 41st St, Tulsa, OK 74107
$-939
Cash flow
-14.0%
Cash-on-Cash Return
3.0%
Cap rate
0.5%
Rent to Value Ratio

Active
$265,000
4
bds
|
3
ba
|
1,964
sqft
|
built
1964
1647 E 61st St, Tulsa, OK 74136
$-315
Cash flow
-6.2%
Cash-on-Cash Return
4.8%
Cap rate
0.6%
Rent to Value Ratio

Active
$415,000
4
bds
|
5
ba
|
4,133
sqft
|
built
1967
6924 S Knoxville Ave, Tulsa, OK 74136
$-679
Cash flow
-8.5%
Cash-on-Cash Return
4.3%
Cap rate
0.7%
Rent to Value Ratio

Active
$215,000
3
bds
|
2
ba
|
1,635
sqft
|
built
1974
10117 E 34th St, Tulsa, OK 74146
$-361
Cash flow
-8.8%
Cash-on-Cash Return
4.2%
Cap rate
0.7%
Rent to Value Ratio
Active
$65,000
3
bds
|
1
ba
|
1,298
sqft
|
built
1960
542 E 59th St N, Tulsa, OK 74126
$791
Cash flow
14.2%
Cash-on-Cash Return
14.6%
Cap rate
1.8%
Rent to Value Ratio

Active
$212,500
3
bds
|
2
ba
|
1,682
sqft
|
built
1965
2107 E 52nd Pl, Tulsa, OK 74105
$-45
Cash flow
-1.1%
Cash-on-Cash Return
6.0%
Cap rate
0.8%
Rent to Value Ratio

Active
$232,500
3
bds
|
2
ba
|
1,444
sqft
|
built
2022
53 N Gillette Ave, Tulsa, OK 74110
$-440
Cash flow
-9.9%
Cash-on-Cash Return
4.0%
Cap rate
0.7%
Rent to Value Ratio

Active
$304,000
5
bds
|
3
ba
|
3,061
sqft
|
built
1965
6508 W Cameron St, Tulsa, OK 74127
$-179
Cash flow
-3.1%
Cash-on-Cash Return
5.6%
Cap rate
0.8%
Rent to Value Ratio

Active
$182,500
4
bds
|
2
ba
|
1,629
sqft
|
built
1974
12802 E 31st Ct, Tulsa, OK 74146
$-117
Cash flow
-3.3%
Cash-on-Cash Return
5.5%
Cap rate
0.8%
Rent to Value Ratio