Texas Investment Properties for Sale
Browse homes for sale and investment properties in Texas. Refine your search by price, property type, or more.
Best cash flowing properties in Texas
Active
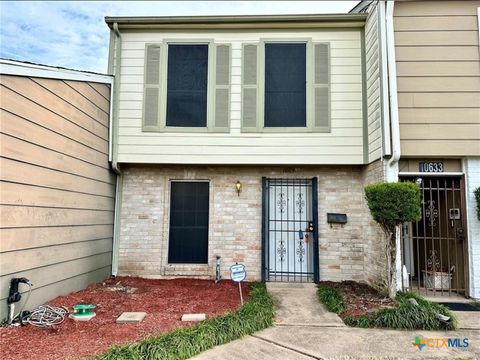
$190,000
2
bds
|
3
ba
|
1,728
sqft
|
built
1973
10631 Sandpiper Dr, Houston, TX 77096
$481
Cash flow
13.2%
Cash-on-Cash Return
8.7%
Cap rate
1.1%
Rent to Value Ratio

Active
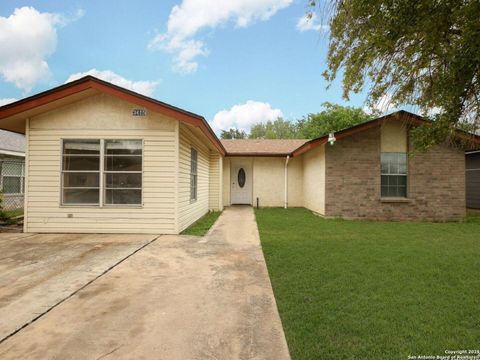
$85,000
3
bds
|
1
ba
|
984
sqft
|
built
1940
102 S Rosillo, San Antonio, TX 78207
$210
Cash flow
12.9%
Cash-on-Cash Return
8.6%
Cap rate
1.4%
Rent to Value Ratio
10,000 out of 90,392 properties for sale in Texas
Limited Results Shown
Create a free account, or log in to reveal all property listings and enjoy the complete experience.

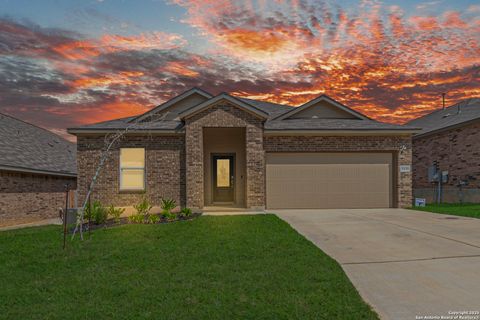
Active
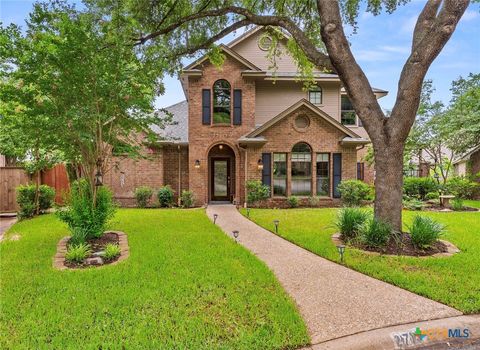
$285,000
3
bds
|
3
ba
|
1,918
sqft
|
built
2018
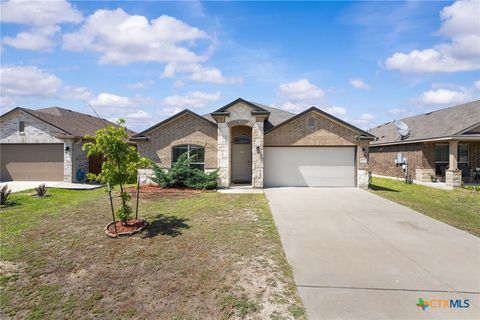
2059 Wind Chime Way, New Braunfels, TX 78130
$-448
Cash flow
-8.2%
Cash-on-Cash Return
3.8%
Cap rate
0.7%
Rent to Value Ratio

Active
$315,000
4
bds
|
2
ba
|
1,696
sqft
|
built
1925
634 Bailey Ave, San Antonio, TX 78210
$-737
Cash flow
-12.2%
Cash-on-Cash Return
2.9%
Cap rate
0.6%
Rent to Value Ratio

Active under contract
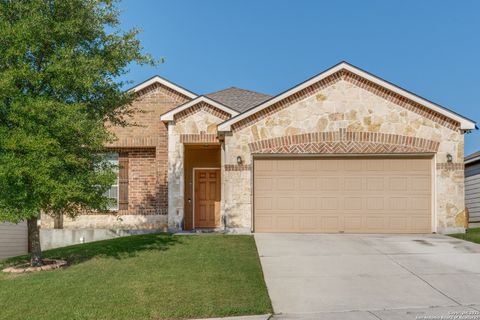
$284,999
3
bds
|
2
ba
|
1,149
sqft
|
built
1984
12068 Stoney Brg, San Antonio, TX 78247
$-680
Cash flow
-12.4%
Cash-on-Cash Return
2.8%
Cap rate
0.6%
Rent to Value Ratio

Active
$339,000
5
bds
|
3
ba
|
2,630
sqft
|
built
2021
195 Cuban Emerald, San Antonio, TX 78253
$-144
Cash flow
-2.2%
Cash-on-Cash Return
5.2%
Cap rate
0.6%
Rent to Value Ratio

Active
$130,000
3
bds
|
2
ba
|
1,803
sqft
|
built
1953
215 W Academy St, San Antonio, TX 78226
$160
Cash flow
6.4%
Cash-on-Cash Return
7.2%
Cap rate
1.2%
Rent to Value Ratio
Active
$179,999
3
bds
|
2
ba
|
1,267
sqft
|
built
1986
3415 Twining Dr, San Antonio, TX 78211
$-246
Cash flow
-7.1%
Cash-on-Cash Return
4.0%
Cap rate
0.8%
Rent to Value Ratio

Active
$995,000
4
bds
|
5
ba
|
4,356
sqft
|
built
2003
22418 Roan Frst, San Antonio, TX 78259
$-3,020
Cash flow
-15.8%
Cash-on-Cash Return
2.0%
Cap rate
0.5%
Rent to Value Ratio
Active
$190,000
2
bds
|
3
ba
|
1,728
sqft
|
built
1973
10631 Sandpiper Dr, Houston, TX 77096
$481
Cash flow
13.2%
Cash-on-Cash Return
8.7%
Cap rate
1.1%
Rent to Value Ratio
Active
$480,000
3
bds
|
3
ba
|
2,243
sqft
|
built
1993
2717 Canyon Oaks Ct, Temple, TX 76502
$-1,046
Cash flow
-11.4%
Cash-on-Cash Return
3.1%
Cap rate
0.6%
Rent to Value Ratio
Active
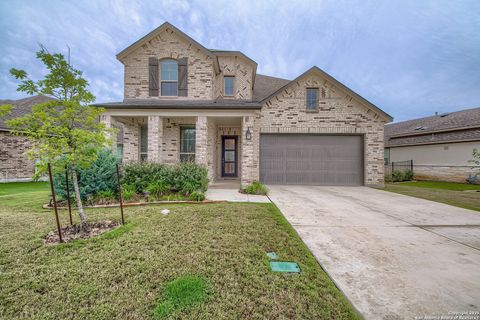
$319,900
3
bds
|
2
ba
|
1,919
sqft
|
built
2013
15923 Silver Rose, Selma, TX 78154
$-668
Cash flow
-10.9%
Cash-on-Cash Return
3.2%
Cap rate
0.6%
Rent to Value Ratio

Active
$235,000
3
bds
|
2
ba
|
1,312
sqft
|
built
1957
167 Fennel Dr, San Antonio, TX 78213
$-397
Cash flow
-8.8%
Cash-on-Cash Return
3.7%
Cap rate
0.7%
Rent to Value Ratio
Active
$265,000
3
bds
|
2
ba
|
1,519
sqft
|
built
2019
222 High More Ct, Temple, TX 76502
$-490
Cash flow
-9.6%
Cash-on-Cash Return
3.5%
Cap rate
0.7%
Rent to Value Ratio
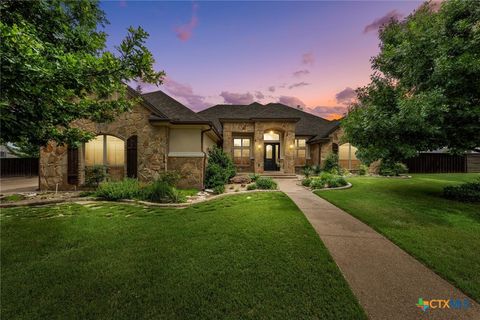
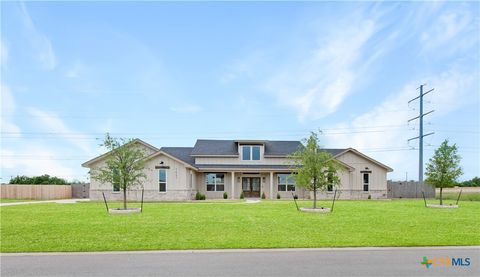
Active
$640,000
5
bds
|
4
ba
|
3,100
sqft
|
built
2023
501 Huntwick Dr, Boerne, TX 78006
$-1,213
Cash flow
-9.9%
Cash-on-Cash Return
3.4%
Cap rate
0.6%
Rent to Value Ratio

Active
$620,000
4
bds
|
3
ba
|
2,781
sqft
|
built
2022
8114 Waterman Bch, San Antonio, TX 78255
$-1,493
Cash flow
-12.6%
Cash-on-Cash Return
2.8%
Cap rate
0.5%
Rent to Value Ratio

Active
$167,000
3
bds
|
2
ba
|
1,412
sqft
|
built
1962
3001 Hummingbird St, Victoria, TX 77901
$63
Cash flow
2.0%
Cash-on-Cash Return
6.1%
Cap rate
1.0%
Rent to Value Ratio

Active
$358,750
3
bds
|
3
ba
|
2,356
sqft
|
built
2001
7126 Linkcrest, San Antonio, TX 78240
$-744
Cash flow
-10.8%
Cash-on-Cash Return
3.2%
Cap rate
0.6%
Rent to Value Ratio
Active
$650,000
4
bds
|
3
ba
|
2,486
sqft
|
built
2014
35 Richland Dr, Belton, TX 76513
$-2,415
Cash flow
-19.4%
Cash-on-Cash Return
1.2%
Cap rate
0.4%
Rent to Value Ratio
Active
$340,000
4
bds
|
3
ba
|
2,166
sqft
|
built
1975
3309 Cottonwood Ln, Temple, TX 76502
$-732
Cash flow
-11.2%
Cash-on-Cash Return
3.1%
Cap rate
0.6%
Rent to Value Ratio

Active
$325,000
3
bds
|
3
ba
|
1,955
sqft
|
built
2003
5327 Missouri Bnd, San Antonio, TX 78247
$-779
Cash flow
-12.5%
Cash-on-Cash Return
2.8%
Cap rate
0.6%
Rent to Value Ratio

Active
$449,900
3
bds
|
2
ba
|
2,068
sqft
|
built
2014
12438 Suncatcher, San Antonio, TX 78253
$-1,198
Cash flow
-13.9%
Cash-on-Cash Return
2.5%
Cap rate
0.6%
Rent to Value Ratio

Active
$269,000
4
bds
|
3
ba
|
1,501
sqft
|
built
1986
6158 Valley Clf, San Antonio, TX 78250
$-513
Cash flow
-9.9%
Cash-on-Cash Return
3.4%
Cap rate
0.7%
Rent to Value Ratio

Active under contract
$560,000
4
bds
|
4
ba
|
3,368
sqft
|
built
2005
106 Stonewall Bnd, San Antonio, TX 78256
$-1,355
Cash flow
-12.6%
Cash-on-Cash Return
2.8%
Cap rate
0.6%
Rent to Value Ratio
Active
$580,000
3
bds
|
3
ba
|
2,598
sqft
|
built
2022
1431 King Ranch Rd, Salado, TX 76571
$-1,150
Cash flow
-10.3%
Cash-on-Cash Return
3.3%
Cap rate
0.6%
Rent to Value Ratio
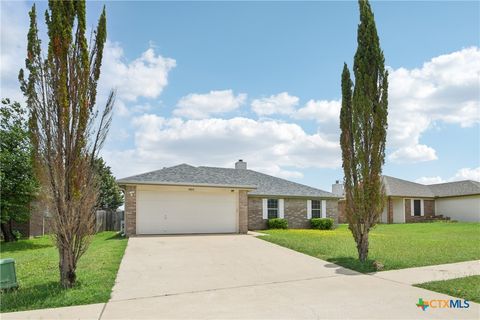
Pending
$230,000
4
bds
|
2
ba
|
1,636
sqft
|
built
2007
3804 John Haedge Dr, Killeen, TX 76549
$-341
Cash flow
-7.7%
Cash-on-Cash Return
3.9%
Cap rate
0.7%
Rent to Value Ratio
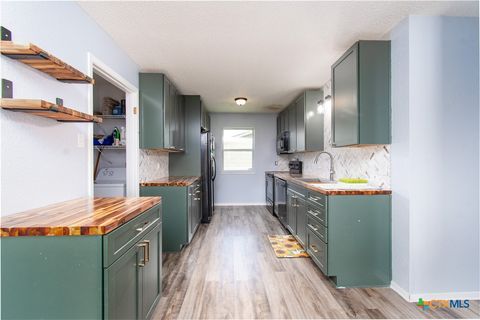
Active
$85,000
3
bds
|
1
ba
|
984
sqft
|
built
1940
102 S Rosillo, San Antonio, TX 78207
$210
Cash flow
12.9%
Cash-on-Cash Return
8.6%
Cap rate
1.4%
Rent to Value Ratio
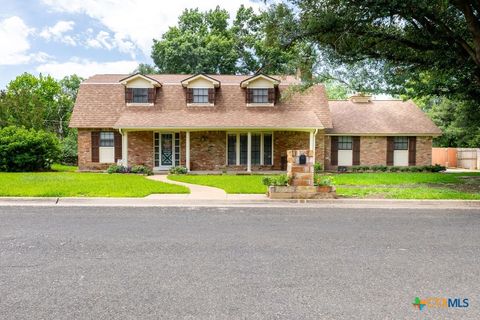
Active
$384,900
4
bds
|
3
ba
|
2,651
sqft
|
built
1976
2257 River Valley Dr, West Columbia, TX 77486
$-401
Cash flow
-5.4%
Cash-on-Cash Return
4.4%
Cap rate
0.7%
Rent to Value Ratio

Active
$225,000
3
bds
|
2
ba
|
1,274
sqft
|
built
1962
2614 Lovelace Blvd, San Antonio, TX 78217
$-389
Cash flow
-9.0%
Cash-on-Cash Return
3.6%
Cap rate
0.7%
Rent to Value Ratio
Active
$395,000
5
bds
|
5
ba
|
2,934
sqft
|
built
1971
309 Crestwind Dr, Windcrest, TX 78239
$-981
Cash flow
-13.0%
Cash-on-Cash Return
2.7%
Cap rate
0.6%
Rent to Value Ratio
Active
$999,921
3
bds
|
3
ba
|
3,255
sqft
|
built
2022
1893 Cheyenne Pass, Salado, TX 76571
$-3,931
Cash flow
-20.5%
Cash-on-Cash Return
1.0%
Cap rate
0.3%
Rent to Value Ratio

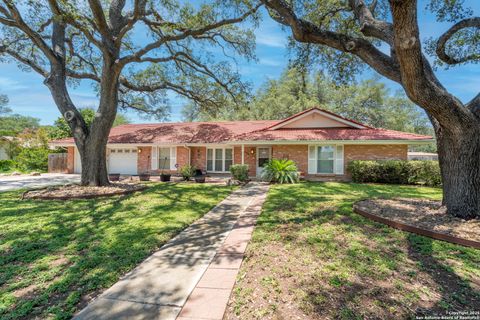
Active under contract
$225,000
3
bds
|
2
ba
|
1,651
sqft
|
built
1948
702 John Adams Dr, San Antonio, TX 78228
$-256
Cash flow
-5.9%
Cash-on-Cash Return
4.3%
Cap rate
0.7%
Rent to Value Ratio

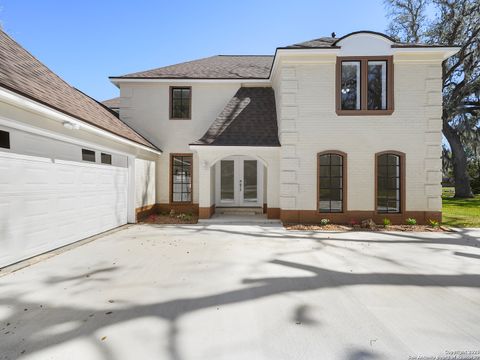
Active under contract
$215,000
4
bds
|
3
ba
|
2,135
sqft
|
built
1974
6403 Port Royal St, San Antonio, TX 78244
$-197
Cash flow
-4.8%
Cash-on-Cash Return
4.6%
Cap rate
0.8%
Rent to Value Ratio
Active
$249,000
4
bds
|
2
ba
|
1,872
sqft
|
built
2013
703 Cosper Creek Dr, Killeen, TX 76542
$-377
Cash flow
-7.9%
Cash-on-Cash Return
3.9%
Cap rate
0.7%
Rent to Value Ratio

Active
$759,000
5
bds
|
4
ba
|
3,408
sqft
|
built
1991
23613 Grayling Ln, San Antonio, TX 78259
$-2,476
Cash flow
-17.0%
Cash-on-Cash Return
1.8%
Cap rate
0.4%
Rent to Value Ratio
Active
$209,900
3
bds
|
2
ba
|
1,416
sqft
|
built
1987
4812 Pepper Mill Holw, Killeen, TX 76542
$-329
Cash flow
-8.2%
Cash-on-Cash Return
3.8%
Cap rate
0.7%
Rent to Value Ratio
Active
$369,999
4
bds
|
3
ba
|
2,123
sqft
|
built
2021
2660 Cowgirl Trl, Belton, TX 76513
$-924
Cash flow
-13.0%
Cash-on-Cash Return
2.7%
Cap rate
0.5%
Rent to Value Ratio

Active
$540,000
4
bds
|
3
ba
|
2,838
sqft
|
built
2012
723 Viento Pt, San Antonio, TX 78260
$-1,300
Cash flow
-12.6%
Cash-on-Cash Return
2.8%
Cap rate
0.6%
Rent to Value Ratio

Active
$339,500
3
bds
|
2
ba
|
1,549
sqft
|
built
1985
10707 Lake Path Dr, San Antonio, TX 78217
$-933
Cash flow
-14.3%
Cash-on-Cash Return
2.4%
Cap rate
0.5%
Rent to Value Ratio

Pending
$350,000
4
bds
|
3
ba
|
2,170
sqft
|
built
1998
3303 Falling Crk, San Antonio, TX 78259
$-914
Cash flow
-13.6%
Cash-on-Cash Return
2.5%
Cap rate
0.6%
Rent to Value Ratio
Active
$385,000
4
bds
|
3
ba
|
0
sqft
|
built
2024
5939 American Elm, Bulverde, TX 78163
$-259
Cash flow
-3.5%
Cash-on-Cash Return
4.9%
Cap rate
0.6%
Rent to Value Ratio
Active
$200,000
3
bds
|
2
ba
|
1,400
sqft
|
built
1985
3605 Pleasing Cir, Killeen, TX 76542
$-285
Cash flow
-7.4%
Cash-on-Cash Return
4.0%
Cap rate
0.7%
Rent to Value Ratio