Bellingham, MA Investment Properties for Sale
Browse homes for sale and investment properties in Bellingham, MA. Refine your search by price, property type, or more.
Best cash flowing properties in Bellingham, MA
Active
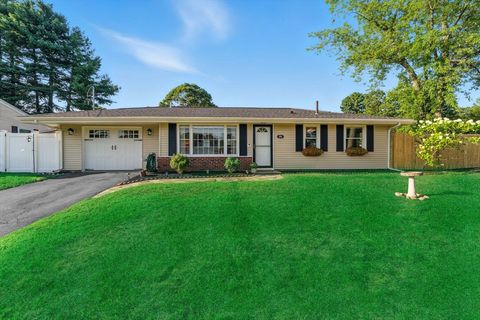
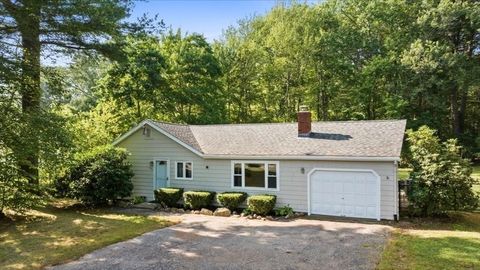
$469,900
3
bds
|
2
ba
|
1,652
sqft
|
built
1974
20 Bertine St, Bellingham, MA 02019
$-200
Cash flow
-2.2%
Cash-on-Cash Return
5.2%
Cap rate
0.8%
Rent to Value Ratio
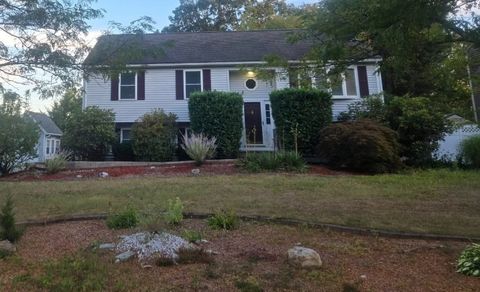
Active
$459,900
3
bds
|
1
ba
|
1,072
sqft
|
built
1965
180 Patricia Dr, Bellingham, MA 02019
$-401
Cash flow
-4.5%
Cash-on-Cash Return
4.6%
Cap rate
0.7%
Rent to Value Ratio
8 out of 14 properties for sale in Bellingham, MA
Limited Results Shown
Create a free account, or log in to reveal all property listings and enjoy the complete experience.
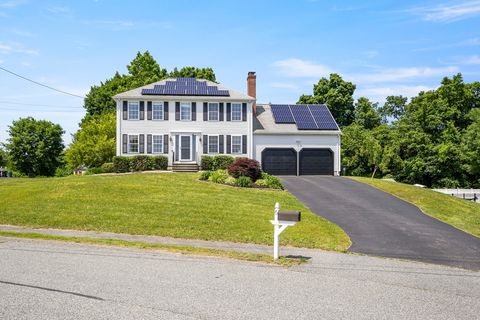
Active
$550,000
3
bds
|
1
ba
|
1,584
sqft
|
built
1990
5 Florence St, Bellingham, MA 02019
$-869
Cash flow
-8.2%
Cash-on-Cash Return
3.8%
Cap rate
0.6%
Rent to Value Ratio
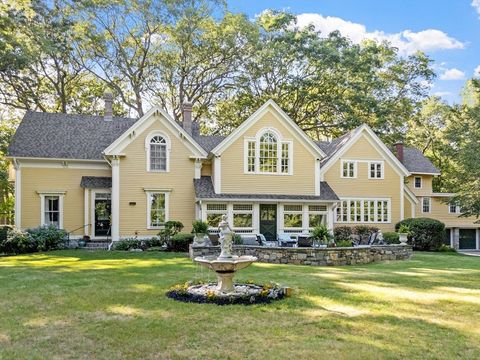
Active
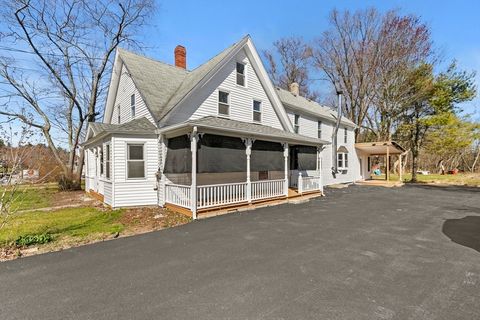
$1,299,000
5
bds
|
5
ba
|
3,937
sqft
|
built
1885
202 Paine St, Bellingham, MA 02019
$-2,728
Cash flow
-11.0%
Cash-on-Cash Return
3.2%
Cap rate
0.5%
Rent to Value Ratio
Active
$459,000
2
bds
|
1
ba
|
816
sqft
|
built
1945
926 S Main St, Bellingham, MA 02019
$-646
Cash flow
-7.3%
Cash-on-Cash Return
4.0%
Cap rate
0.6%
Rent to Value Ratio
Active
$650,000
5
bds
|
3
ba
|
2,503
sqft
|
built
1900
359 Hartford Ave, Bellingham, MA 02019
$-554
Cash flow
-4.4%
Cash-on-Cash Return
4.7%
Cap rate
0.7%
Rent to Value Ratio
Active
$779,900
3
bds
|
3
ba
|
2,294
sqft
|
built
1997
6 Fleuette Dr, Bellingham, MA 02019
$-1,579
Cash flow
-10.6%
Cash-on-Cash Return
3.2%
Cap rate
0.5%
Rent to Value Ratio

Active
$490,000
3
bds
|
1
ba
|
1,296
sqft
|
built
1992
202 Hartford Ave, Bellingham, MA 02019
$-500
Cash flow
-5.3%
Cash-on-Cash Return
4.5%
Cap rate
0.7%
Rent to Value Ratio