Boynton Beach, FL Investment Properties for Sale
Browse homes for sale and investment properties in Boynton Beach, FL. Refine your search by price, property type, or more.
Best cash flowing properties in Boynton Beach, FL

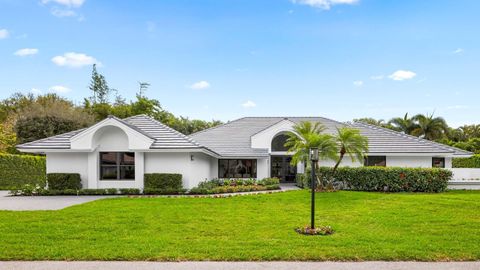
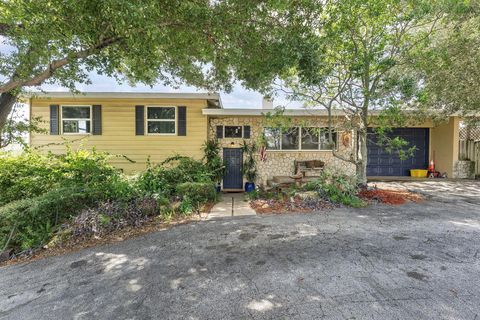
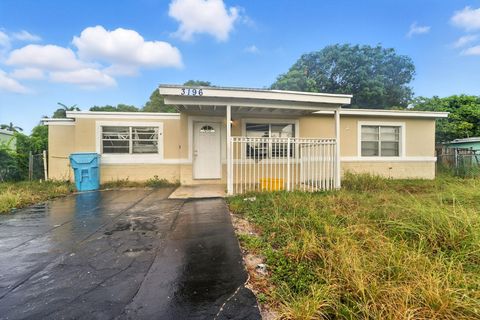
Active
$299,900
3
bds
|
3
ba
|
1,809
sqft
|
built
1988
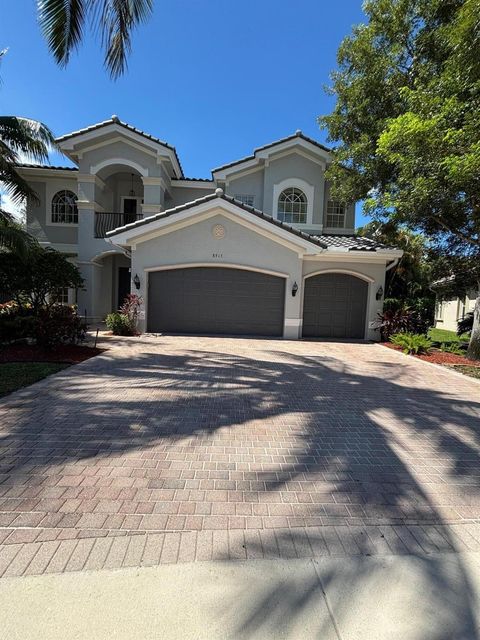
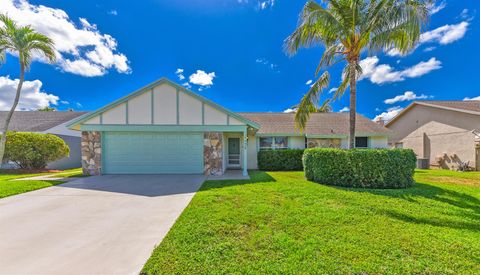
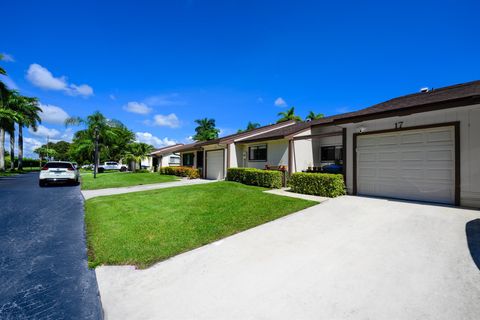
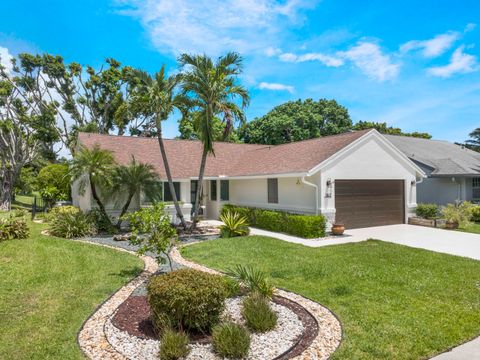
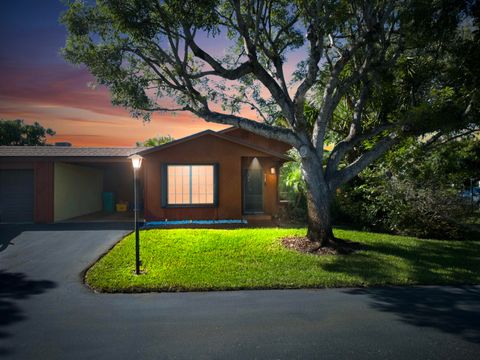
6932 Bitterbush Pl, Boynton Beach, FL 33472
$-37
Cash flow
-0.6%
Cash-on-Cash Return
6.0%
Cap rate
1.2%
Rent to Value Ratio
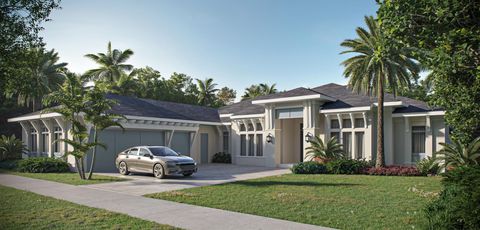
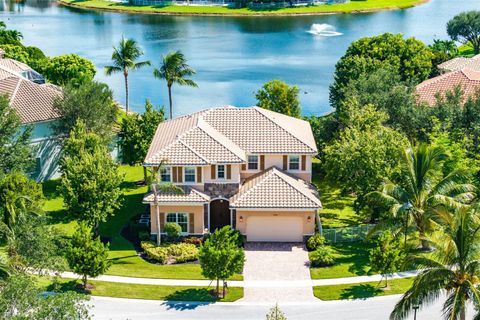
Active
$1,069,000
5
bds
|
4
ba
|
4,039
sqft
|
built
2005
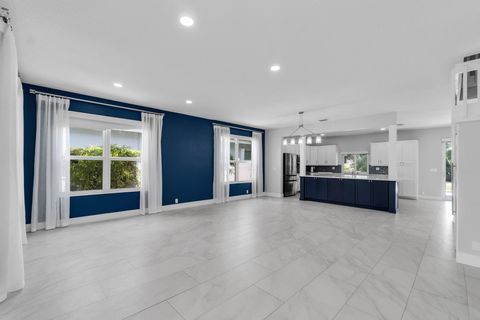
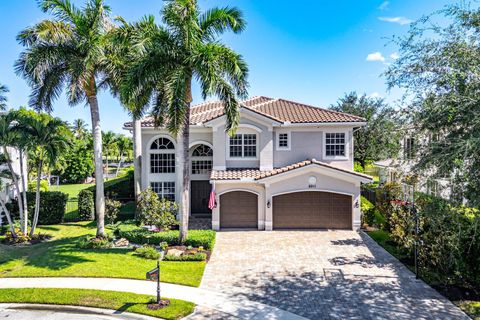
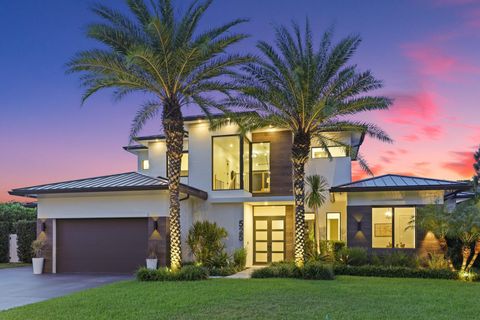
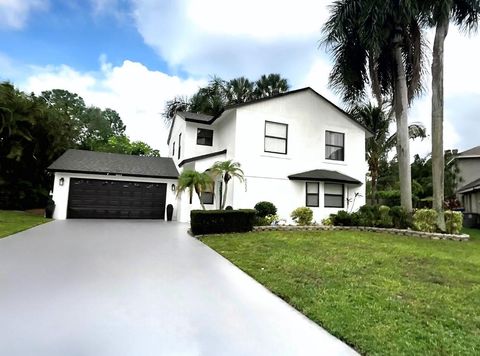
8915 Heartsong Ter, Boynton Beach, FL 33473
$-140
Cash flow
-0.7%
Cash-on-Cash Return
6.0%
Cap rate
0.9%
Rent to Value Ratio
409 out of 483 properties for sale in Boynton Beach, FL
Limited Results Shown
Create a free account, or log in to reveal all property listings and enjoy the complete experience.
Active
$620,000
3
bds
|
3
ba
|
2,584
sqft
|
built
1983
2451 SW 23rd Cranbrook Dr, Boynton Beach, FL 33436
$-1,241
Cash flow
-10.4%
Cash-on-Cash Return
3.7%
Cap rate
0.6%
Rent to Value Ratio
Active
$634,900
5
bds
|
4
ba
|
3,119
sqft
|
built
2005
1061 Grove Park Cir, Boynton Beach, FL 33436
$-1,688
Cash flow
-13.9%
Cash-on-Cash Return
3.0%
Cap rate
0.6%
Rent to Value Ratio
Active
$185,500
3
bds
|
2
ba
|
1,115
sqft
|
built
1993
5155 Europa Dr, Boynton Beach, FL 33437
$-391
Cash flow
-11.0%
Cash-on-Cash Return
3.6%
Cap rate
1.3%
Rent to Value Ratio
Active
$599,990
4
bds
|
2
ba
|
1,764
sqft
|
built
1987
10687 Katmandu Ct, Boynton Beach, FL 33437
$-1,038
Cash flow
-9.0%
Cash-on-Cash Return
4.1%
Cap rate
0.6%
Rent to Value Ratio
Active
$899,000
5
bds
|
4
ba
|
3,540
sqft
|
built
1994
9192 Picot Ct, Boynton Beach, FL 33472
$-321
Cash flow
-1.9%
Cash-on-Cash Return
5.7%
Cap rate
0.8%
Rent to Value Ratio
Active
$275,000
3
bds
|
2
ba
|
1,333
sqft
|
built
1993
5147 Europa Dr, Boynton Beach, FL 33437
$-520
Cash flow
-9.9%
Cash-on-Cash Return
3.9%
Cap rate
1.1%
Rent to Value Ratio
Active
$355,000
3
bds
|
3
ba
|
1,454
sqft
|
built
2004
306 SE 23rd Ave, Boynton Beach, FL 33435
$-471
Cash flow
-6.9%
Cash-on-Cash Return
4.6%
Cap rate
0.7%
Rent to Value Ratio
Active
$245,000
2
bds
|
2
ba
|
1,137
sqft
|
built
2007
1690 Renaissance Commons Blvd, Boynton Beach, FL 33426
$-934
Cash flow
-19.9%
Cash-on-Cash Return
1.6%
Cap rate
0.9%
Rent to Value Ratio
Active
$1,243,000
3
bds
|
3
ba
|
1,908
sqft
|
built
1958
714 SW 25th Ave, Boynton Beach, FL 33435
$-3,627
Cash flow
-15.2%
Cash-on-Cash Return
2.6%
Cap rate
0.5%
Rent to Value Ratio
Active
$465,000
3
bds
|
2
ba
|
1,865
sqft
|
built
1987
7632 Forest Green Ln, Boynton Beach, FL 33436
$-1,085
Cash flow
-12.2%
Cash-on-Cash Return
3.3%
Cap rate
0.6%
Rent to Value Ratio
Active
$769,900
4
bds
|
3
ba
|
2,515
sqft
|
built
2007
8921 Morgan Landing Way, Boynton Beach, FL 33473
$-1,759
Cash flow
-11.9%
Cash-on-Cash Return
3.4%
Cap rate
0.6%
Rent to Value Ratio
Active
$1,750,000
4
bds
|
4
ba
|
3,336
sqft
|
built
1983
4606 Gleneagles Dr, Boynton Beach, FL 33436
$-5,352
Cash flow
-16.0%
Cash-on-Cash Return
2.5%
Cap rate
0.4%
Rent to Value Ratio
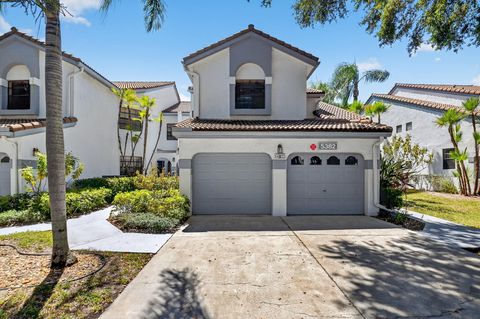
Active
$250,000
2
bds
|
2
ba
|
1,576
sqft
|
built
1990
5382 Venetia Ct, Boynton Beach, FL 33437
$-825
Cash flow
-17.2%
Cash-on-Cash Return
2.2%
Cap rate
1.0%
Rent to Value Ratio
Active
$325,000
4
bds
|
1
ba
|
968
sqft
|
built
1957
3136 N Seacrest Blvd, Boynton Beach, FL 33435
$-374
Cash flow
-6.0%
Cash-on-Cash Return
4.8%
Cap rate
0.7%
Rent to Value Ratio
Active
$218,000
2
bds
|
2
ba
|
864
sqft
|
built
1987
22 Crossings Cir, Boynton Beach, FL 33435
$-376
Cash flow
-9.0%
Cash-on-Cash Return
4.1%
Cap rate
0.9%
Rent to Value Ratio
Active
$398,000
2
bds
|
2
ba
|
1,343
sqft
|
built
1985
17 Mayfair Ln, Boynton Beach, FL 33426
$-1,159
Cash flow
-15.2%
Cash-on-Cash Return
2.7%
Cap rate
0.6%
Rent to Value Ratio
Active
$1,349,900
5
bds
|
3
ba
|
3,337
sqft
|
built
2005
8911 Rockridge Glen Cv, Boynton Beach, FL 33473
$-4,002
Cash flow
-15.5%
Cash-on-Cash Return
2.6%
Cap rate
0.4%
Rent to Value Ratio
Active
$234,999
3
bds
|
2
ba
|
1,578
sqft
|
built
1995
5135 Floria Dr, Boynton Beach, FL 33437
$-378
Cash flow
-8.4%
Cash-on-Cash Return
4.2%
Cap rate
1.1%
Rent to Value Ratio
Active
$79,000
2
bds
|
2
ba
|
1,429
sqft
|
built
1981
28 Stratford Ln W, Boynton Beach, FL 33436
$-401
Cash flow
-26.5%
Cash-on-Cash Return
0.1%
Cap rate
2.5%
Rent to Value Ratio
Active
$700,000
4
bds
|
3
ba
|
2,457
sqft
|
built
1961
116 SE 28th Ave, Boynton Beach, FL 33435
$-1,521
Cash flow
-11.3%
Cash-on-Cash Return
3.5%
Cap rate
0.6%
Rent to Value Ratio
Active
$3,999,000
4
bds
|
5
ba
|
3,907
sqft
|
built
2026
4915 King Palm Cir, Boynton Beach, FL 33436
$-16,510
Cash flow
-21.5%
Cash-on-Cash Return
1.2%
Cap rate
0.2%
Rent to Value Ratio
Active
$250,000
2
bds
|
2
ba
|
1,008
sqft
|
built
1984
9780 Pineapple Tree Dr, Boynton Beach, FL 33436
$-620
Cash flow
-12.9%
Cash-on-Cash Return
3.2%
Cap rate
0.8%
Rent to Value Ratio
Active
$1,115,000
4
bds
|
3
ba
|
2,407
sqft
|
built
1999
9525 Cross Creek Dr, Boynton Beach, FL 33436
$-3,098
Cash flow
-14.5%
Cash-on-Cash Return
2.8%
Cap rate
0.4%
Rent to Value Ratio
Active
$559,000
3
bds
|
2
ba
|
1,296
sqft
|
built
1988
1812 Edgewater Dr, Boynton Beach, FL 33436
$-1,106
Cash flow
-10.3%
Cash-on-Cash Return
3.8%
Cap rate
0.6%
Rent to Value Ratio
Active
$3,725,000
5
bds
|
6
ba
|
3,732
sqft
|
built
2020
525 Whispering Pines Rd, Boynton Beach, FL 33435
$-15,927
Cash flow
-22.3%
Cash-on-Cash Return
1.0%
Cap rate
0.3%
Rent to Value Ratio
Active
$220,000
2
bds
|
2
ba
|
921
sqft
|
built
1986
1104 Meadows Cir, Boynton Beach, FL 33436
$-702
Cash flow
-16.6%
Cash-on-Cash Return
2.3%
Cap rate
0.9%
Rent to Value Ratio
Active
$225,000
3
bds
|
2
ba
|
1,447
sqft
|
built
1995
5133 Brisata Cir, Boynton Beach, FL 33437
$-361
Cash flow
-8.4%
Cash-on-Cash Return
4.2%
Cap rate
1.1%
Rent to Value Ratio
Active
$327,000
3
bds
|
2
ba
|
1,108
sqft
|
built
1957
3196 N Seacrest Blvd, Boynton Beach, FL 33435
$-308
Cash flow
-4.9%
Cash-on-Cash Return
5.0%
Cap rate
0.8%
Rent to Value Ratio
Active
$929,900
5
bds
|
5
ba
|
3,958
sqft
|
built
2007
10024 Cobblestone Creek Dr, Boynton Beach, FL 33472
$-2,729
Cash flow
-15.3%
Cash-on-Cash Return
2.6%
Cap rate
0.5%
Rent to Value Ratio

Active
$499,900
2
bds
|
2
ba
|
1,525
sqft
|
built
1984
801 SW 1st Ct, Boynton Beach, FL 33426
$-925
Cash flow
-9.7%
Cash-on-Cash Return
3.9%
Cap rate
0.6%
Rent to Value Ratio
Active
$329,000
2
bds
|
3
ba
|
1,650
sqft
|
built
1980
1425 Oxford Ln, Boynton Beach, FL 33426
$-381
Cash flow
-6.0%
Cash-on-Cash Return
4.8%
Cap rate
1.0%
Rent to Value Ratio
Active
$460,000
2
bds
|
2
ba
|
1,404
sqft
|
built
1986
22 Baytree Cir, Boynton Beach, FL 33436
$-841
Cash flow
-9.5%
Cash-on-Cash Return
4.0%
Cap rate
0.6%
Rent to Value Ratio
Active
$320,000
2
bds
|
2
ba
|
1,321
sqft
|
built
1979
517 SE 27th Ter, Boynton Beach, FL 33435
$-892
Cash flow
-14.5%
Cash-on-Cash Return
2.8%
Cap rate
0.8%
Rent to Value Ratio
Active
$780,000
4
bds
|
3
ba
|
2,422
sqft
|
built
1994
6223 Jaipur Ct, Boynton Beach, FL 33437
$-1,948
Cash flow
-13.0%
Cash-on-Cash Return
3.2%
Cap rate
0.5%
Rent to Value Ratio
Active
$599,900
3
bds
|
3
ba
|
1,890
sqft
|
built
1957
117 SE 22nd Ave, Boynton Beach, FL 33435
$-1,150
Cash flow
-10.0%
Cash-on-Cash Return
3.8%
Cap rate
0.6%
Rent to Value Ratio

Active
$489,000
4
bds
|
3
ba
|
1,917
sqft
|
built
1987
17 Paxford Ln, Boynton Beach, FL 33426
$-1,070
Cash flow
-11.4%
Cash-on-Cash Return
3.5%
Cap rate
0.7%
Rent to Value Ratio
Active
$408,000
2
bds
|
2
ba
|
960
sqft
|
built
1985
5628 Pebble Brook Ln, Boynton Beach, FL 33472
$-821
Cash flow
-10.5%
Cash-on-Cash Return
3.7%
Cap rate
0.6%
Rent to Value Ratio
Active
$459,000
2
bds
|
2
ba
|
1,206
sqft
|
built
2006
625 Casa Loma Blvd, Boynton Beach, FL 33435
$-374
Cash flow
-4.3%
Cash-on-Cash Return
5.2%
Cap rate
1.2%
Rent to Value Ratio