Falmouth, MA Investment Properties for Sale
Browse homes for sale and investment properties in Falmouth, MA. Refine your search by price, property type, or more.
Best cash flowing properties in Falmouth, MA
Active
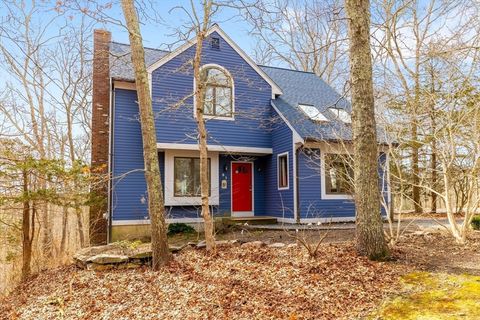
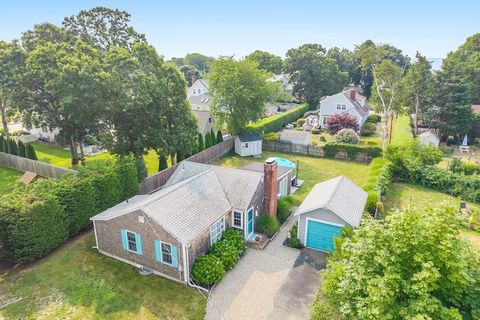
$625,000
3
bds
|
2
ba
|
1,708
sqft
|
built
1988
21 Braeside Rd, Falmouth, MA 02540
$-819
Cash flow
-6.8%
Cash-on-Cash Return
4.1%
Cap rate
0.6%
Rent to Value Ratio
Active
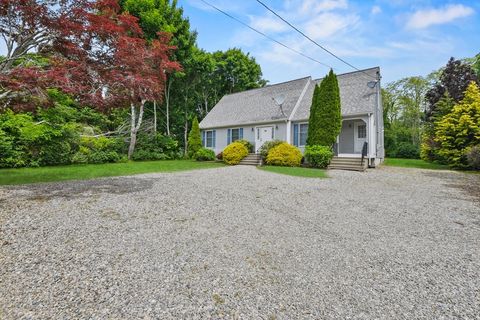
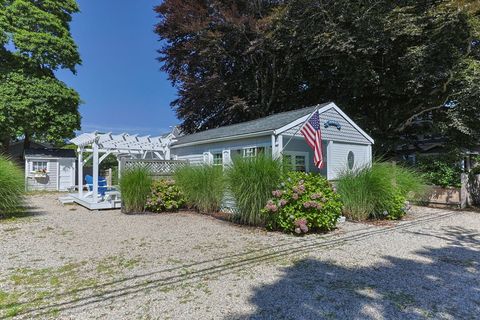
$724,999
3
bds
|
2
ba
|
1,710
sqft
|
built
2006
94 Jones Rd, Falmouth, MA 02540
$-1,545
Cash flow
-11.1%
Cash-on-Cash Return
3.1%
Cap rate
0.4%
Rent to Value Ratio
16 out of 40 properties for sale in Falmouth, MA
Limited Results Shown
Create a free account, or log in to reveal all property listings and enjoy the complete experience.
Active
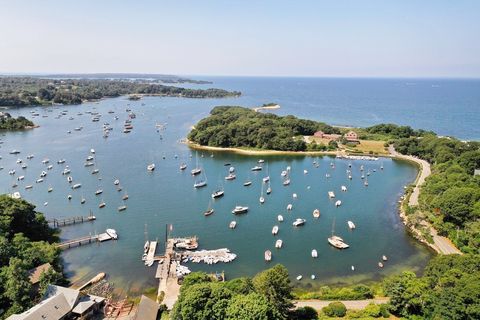
$5,295,000
4
bds
|
4
ba
|
3,166
sqft
|
built
1986
44 Carey Ln, Falmouth, MA 02540
$-21,336
Cash flow
-21.0%
Cash-on-Cash Return
0.8%
Cap rate
0.2%
Rent to Value Ratio
Active
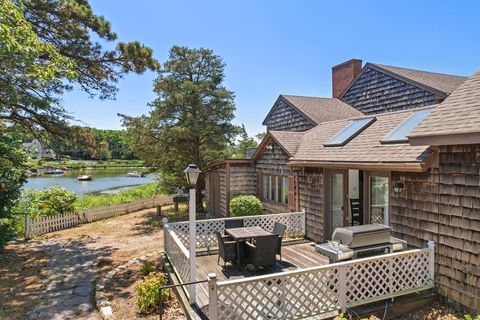
$2,790,000
3
bds
|
3
ba
|
3,816
sqft
|
built
1930
102 Nashawena St, Falmouth, MA 02540
$-8,259
Cash flow
-15.4%
Cash-on-Cash Return
2.1%
Cap rate
0.3%
Rent to Value Ratio
Active
$1,195,000
3
bds
|
2
ba
|
1,006
sqft
|
built
1954
9 Ginwal St, Falmouth, MA 02540
$-3,610
Cash flow
-15.8%
Cash-on-Cash Return
2.1%
Cap rate
0.3%
Rent to Value Ratio
Active
$899,900
2
bds
|
1
ba
|
640
sqft
|
built
1946
17 Elysian Ave, Falmouth, MA 02540
$-2,643
Cash flow
-15.3%
Cash-on-Cash Return
2.2%
Cap rate
0.3%
Rent to Value Ratio
Active
$1,100,000
3
bds
|
3
ba
|
2,964
sqft
|
built
1985
126 Ambleside Dr, Falmouth, MA 02540
$-2,868
Cash flow
-13.6%
Cash-on-Cash Return
2.6%
Cap rate
0.4%
Rent to Value Ratio
Active
$1,195,000
4
bds
|
3
ba
|
2,697
sqft
|
built
1950
908 W Falmouth Hwy, Falmouth, MA 02540
$-3,018
Cash flow
-13.2%
Cash-on-Cash Return
2.6%
Cap rate
0.4%
Rent to Value Ratio
Active
$1,495,000
3
bds
|
2
ba
|
2,133
sqft
|
built
1962
27 Upland Ave, Falmouth, MA 02540
$-4,716
Cash flow
-16.5%
Cash-on-Cash Return
1.9%
Cap rate
0.3%
Rent to Value Ratio
Active
$995,000
3
bds
|
3
ba
|
2,793
sqft
|
built
1985
106 Ambleside Dr, Falmouth, MA 02540
$-2,395
Cash flow
-12.6%
Cash-on-Cash Return
2.8%
Cap rate
0.4%
Rent to Value Ratio
Active
$2,750,000
5
bds
|
4
ba
|
3,624
sqft
|
built
1999
82 Harbor Hill Rd, Falmouth, MA 02543
$-9,045
Cash flow
-17.2%
Cash-on-Cash Return
1.7%
Cap rate
0.3%
Rent to Value Ratio
Active
$955,000
3
bds
|
3
ba
|
2,222
sqft
|
built
1870
480 Main St, Falmouth, MA 02540
$-3,145
Cash flow
-17.2%
Cash-on-Cash Return
1.7%
Cap rate
0.4%
Rent to Value Ratio
Active
$2,800,000
4
bds
|
3
ba
|
3,465
sqft
|
built
1900
10 Quissett Ave, Falmouth, MA 02543
$-10,470
Cash flow
-19.5%
Cash-on-Cash Return
1.2%
Cap rate
0.2%
Rent to Value Ratio
Active
$1,695,000
4
bds
|
3
ba
|
3,046
sqft
|
built
2023
4 Charles Ln, Falmouth, MA 02540
$-5,288
Cash flow
-16.3%
Cash-on-Cash Return
1.9%
Cap rate
0.3%
Rent to Value Ratio
Active
$1,250,000
4
bds
|
3
ba
|
2,376
sqft
|
built
1973
15 Marvin Cir, Falmouth, MA 02540
$-3,968
Cash flow
-16.6%
Cash-on-Cash Return
1.9%
Cap rate
0.3%
Rent to Value Ratio
Active
$999,999
2
bds
|
1
ba
|
1,008
sqft
|
built
1950
133 Mariners Ln, Falmouth, MA 02540
$-3,004
Cash flow
-15.7%
Cash-on-Cash Return
2.1%
Cap rate
0.3%
Rent to Value Ratio