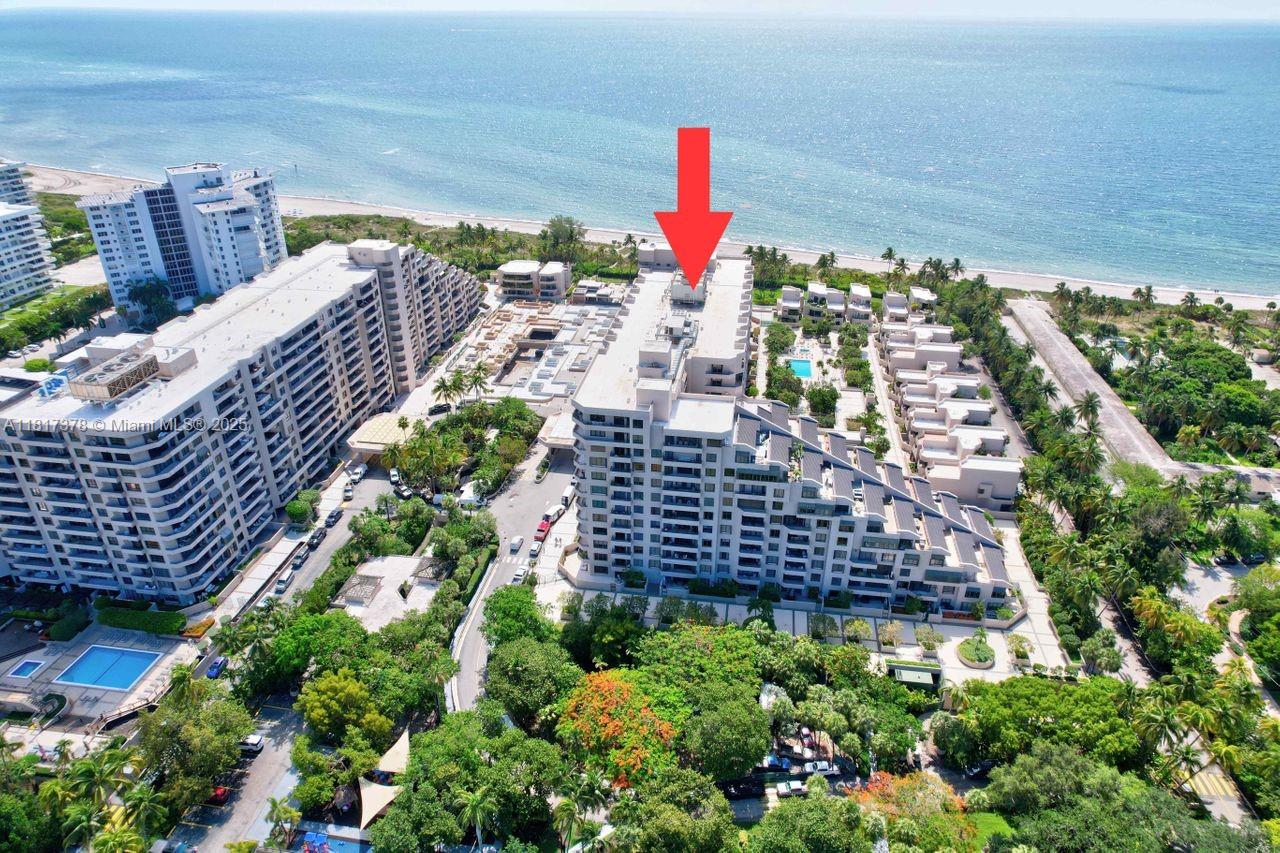
Key Biscayne, FL Investment Properties for Sale
Browse homes for sale and investment properties in Key Biscayne, FL. Refine your search by price, property type, or more.
Best cash flowing properties in Key Biscayne, FL

Active
$499,000
1
bds
|
1
ba
|
690
sqft
|
built
1969
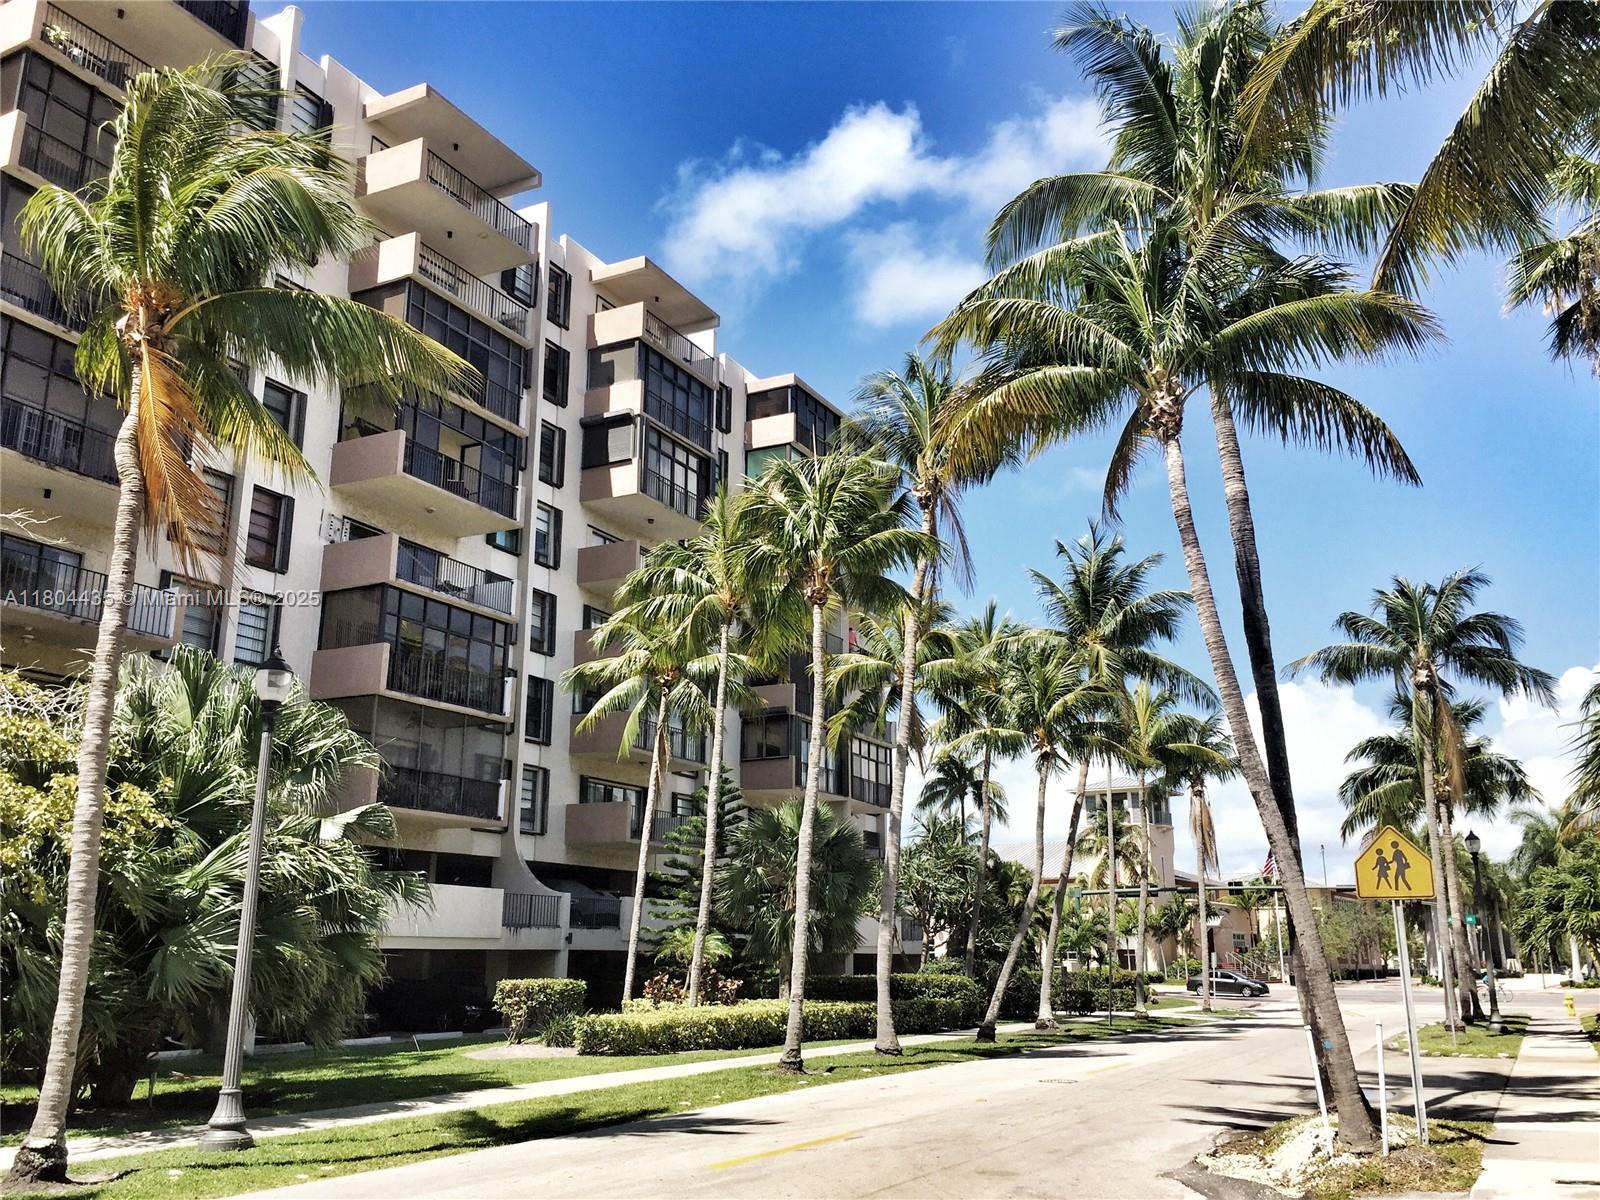
200 Galen Dr, Key Biscayne, FL 33149
$-1,054
Cash flow
-11.0%
Cash-on-Cash Return
3.7%
Cap rate
0.7%
Rent to Value Ratio

Active
$915,000
2
bds
|
2
ba
|
1,311
sqft
|
built
1975
575 Crandon Blvd, Key Biscayne, FL 33149
$-2,811
Cash flow
-16.0%
Cash-on-Cash Return
2.6%
Cap rate
0.6%
Rent to Value Ratio
158 out of 165 properties for sale in Key Biscayne, FL
Limited Results Shown
Create a free account, or log in to reveal all property listings and enjoy the complete experience.
Active
$1,900,000
3
bds
|
3
ba
|
2,169
sqft
|
built
1978
201 Crandon Blvd, Key Biscayne, FL 33149
$-20,503
Cash flow
-56.3%
Cash-on-Cash Return
-6.7%
Cap rate
0.5%
Rent to Value Ratio
Active
$915,000
2
bds
|
2
ba
|
1,311
sqft
|
built
1975
575 Crandon Blvd, Key Biscayne, FL 33149
$-2,811
Cash flow
-16.0%
Cash-on-Cash Return
2.6%
Cap rate
0.6%
Rent to Value Ratio
Active
$820,000
2
bds
|
2
ba
|
1,231
sqft
|
built
1974
77 Crandon Blvd, Key Biscayne, FL 33149
$-2,912
Cash flow
-18.5%
Cash-on-Cash Return
2.0%
Cap rate
0.6%
Rent to Value Ratio
Active
$1,300,000
3
bds
|
2
ba
|
1,715
sqft
|
built
1981
141 Crandon Blvd, Key Biscayne, FL 33149
$-2,871
Cash flow
-11.5%
Cash-on-Cash Return
3.6%
Cap rate
0.5%
Rent to Value Ratio
Active
$1,420,000
2
bds
|
2
ba
|
1,506
sqft
|
built
1980
151 Crandon Blvd, Key Biscayne, FL 33149
$-5,533
Cash flow
-20.3%
Cash-on-Cash Return
1.6%
Cap rate
0.5%
Rent to Value Ratio
Active
$1,450,000
2
bds
|
2
ba
|
1,409
sqft
|
built
1972
1111 Crandon Blvd, Key Biscayne, FL 33149
$-4,983
Cash flow
-17.9%
Cash-on-Cash Return
2.2%
Cap rate
0.4%
Rent to Value Ratio
Active under contract
$3,900,000
4
bds
|
3
ba
|
3,004
sqft
|
built
1951
345 Harbor Ln, Key Biscayne, FL 33149
$-16,913
Cash flow
-22.6%
Cash-on-Cash Return
1.1%
Cap rate
0.2%
Rent to Value Ratio
Active
$2,600,000
2
bds
|
2
ba
|
1,450
sqft
|
built
1997
713 Crandon Blvd, Key Biscayne, FL 33149
$-10,563
Cash flow
-21.2%
Cash-on-Cash Return
1.4%
Cap rate
0.3%
Rent to Value Ratio
Active
$25,000,000
4
bds
|
5
ba
|
3,241
sqft
|
built
1965
699 N Mashta Dr, Key Biscayne, FL 33149
$-133,111
Cash flow
-27.8%
Cash-on-Cash Return
-0.1%
Cap rate
0.0%
Rent to Value Ratio
Active
$2,399,000
4
bds
|
4
ba
|
1,750
sqft
|
built
2024
200 Sunrise Dr, Key Biscayne, FL 33149
$-10,417
Cash flow
-22.7%
Cash-on-Cash Return
1.1%
Cap rate
0.2%
Rent to Value Ratio
Active
$1,425,000
3
bds
|
2
ba
|
1,600
sqft
|
built
1981
181 Crandon Blvd, Key Biscayne, FL 33149
$-5,174
Cash flow
-18.9%
Cash-on-Cash Return
1.9%
Cap rate
0.5%
Rent to Value Ratio
Active
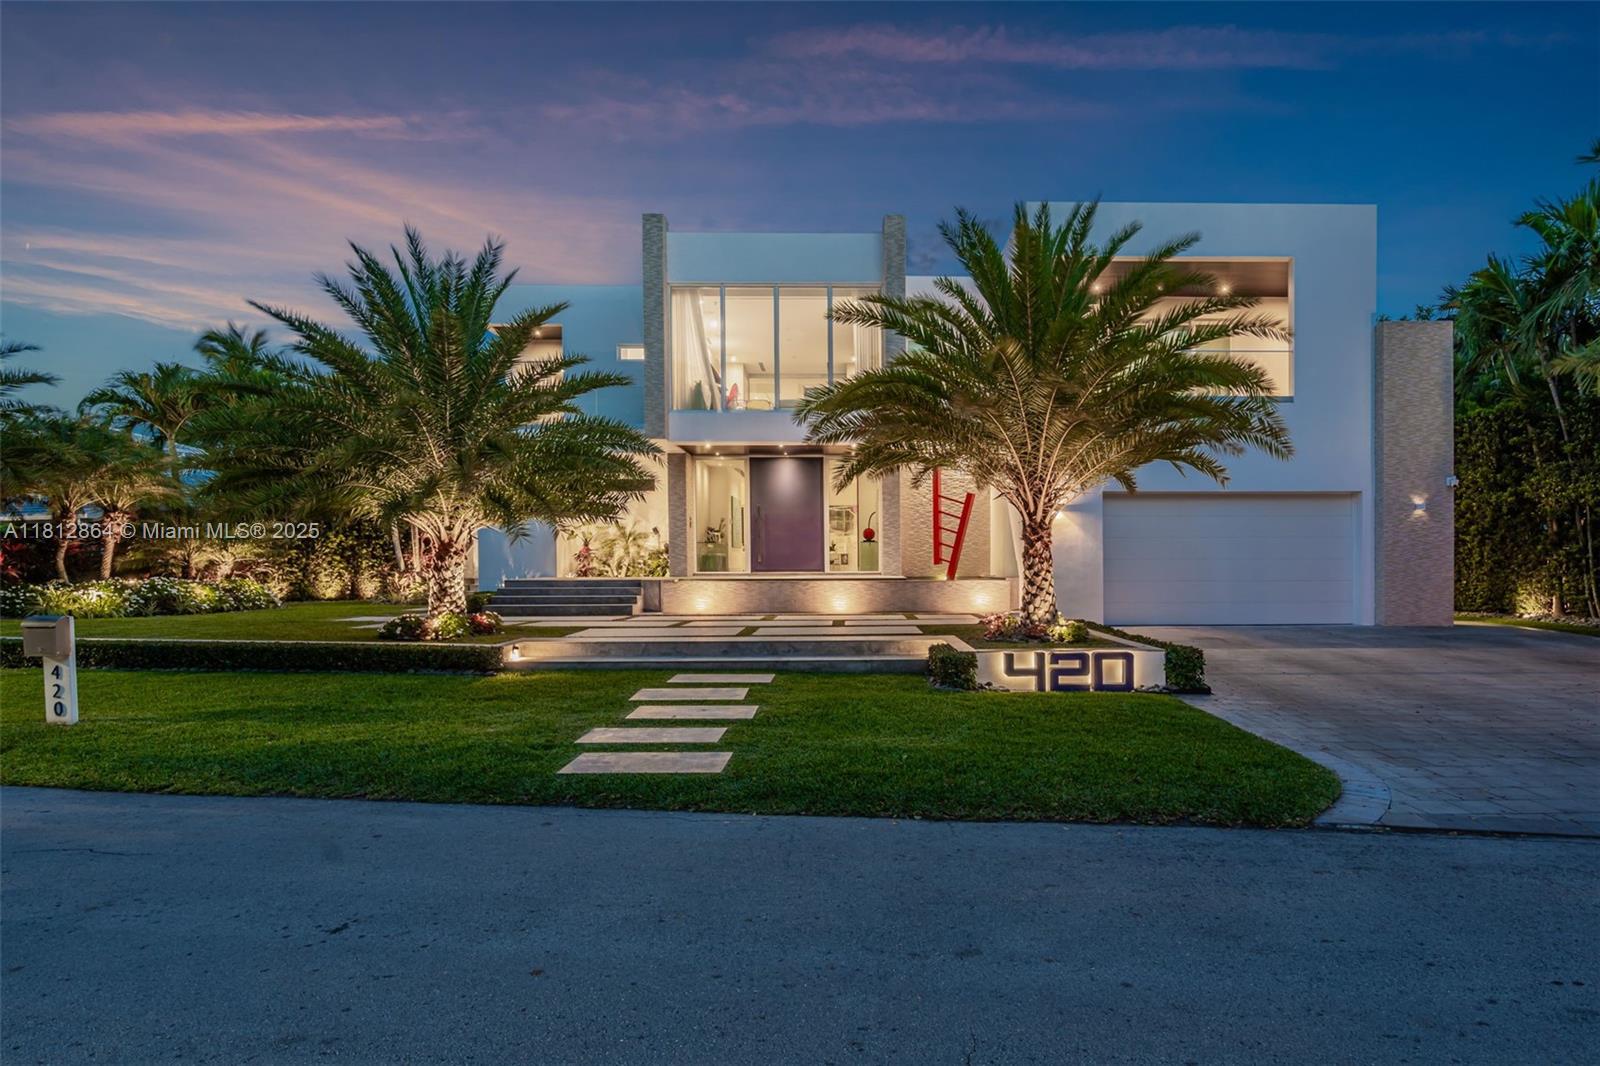
$14,000,000
6
bds
|
8
ba
|
6,405
sqft
|
built
2017
420 Island Dr, Key Biscayne, FL 33149
$-74,431
Cash flow
-27.7%
Cash-on-Cash Return
-0.1%
Cap rate
0.1%
Rent to Value Ratio
Active
$1,300,000
2
bds
|
2
ba
|
1,547
sqft
|
built
1980
151 Crandon Blvd, Key Biscayne, FL 33149
$-5,387
Cash flow
-21.6%
Cash-on-Cash Return
1.3%
Cap rate
0.5%
Rent to Value Ratio
Active
$915,000
2
bds
|
2
ba
|
1,311
sqft
|
built
1975
575 Crandon Blvd, Key Biscayne, FL 33149
$-5,057
Cash flow
-28.8%
Cash-on-Cash Return
-0.3%
Cap rate
0.5%
Rent to Value Ratio

Active
$1,495,000
2
bds
|
2
ba
|
1,541
sqft
|
built
1978
201 Crandon Blvd, Key Biscayne, FL 33149
$-6,059
Cash flow
-21.1%
Cash-on-Cash Return
1.4%
Cap rate
0.5%
Rent to Value Ratio
Active
$3,399,000
3
bds
|
3
ba
|
3,120
sqft
|
built
1971
881 Ocean Dr, Key Biscayne, FL 33149
$-16,563
Cash flow
-25.4%
Cash-on-Cash Return
0.4%
Cap rate
0.3%
Rent to Value Ratio
Active
$4,750,000
6
bds
|
6
ba
|
4,132
sqft
|
built
2003
400 Woodcrest Rd, Key Biscayne, FL 33149
$-22,690
Cash flow
-24.9%
Cash-on-Cash Return
0.6%
Cap rate
0.1%
Rent to Value Ratio

Active
$1,650,000
2
bds
|
2
ba
|
1,531
sqft
|
built
1978
201 Crandon Blvd, Key Biscayne, FL 33149
$-4,506
Cash flow
-14.2%
Cash-on-Cash Return
3.0%
Cap rate
0.5%
Rent to Value Ratio
Active
$1,100,000
2
bds
|
2
ba
|
1,532
sqft
|
built
1979
251 Crandon Blvd, Key Biscayne, FL 33149
$-3,320
Cash flow
-15.7%
Cash-on-Cash Return
2.7%
Cap rate
0.6%
Rent to Value Ratio
Active
$1,180,000
3
bds
|
2
ba
|
1,715
sqft
|
built
1981
161 Crandon Blvd, Key Biscayne, FL 33149
$-4,059
Cash flow
-17.9%
Cash-on-Cash Return
2.2%
Cap rate
0.6%
Rent to Value Ratio
Active
$2,990,000
3
bds
|
2
ba
|
1,391
sqft
|
built
1953
250 Fernwood Rd, Key Biscayne, FL 33149
$-13,707
Cash flow
-23.9%
Cash-on-Cash Return
0.8%
Cap rate
0.2%
Rent to Value Ratio
Active
$5,500,000
5
bds
|
5
ba
|
3,595
sqft
|
built
2000
164 W Mashta Dr, Key Biscayne, FL 33149
$-25,524
Cash flow
-24.2%
Cash-on-Cash Return
0.7%
Cap rate
0.2%
Rent to Value Ratio

Active
$1,295,000
2
bds
|
2
ba
|
1,532
sqft
|
built
1980
151 Crandon Blvd, Key Biscayne, FL 33149
$-5,595
Cash flow
-22.5%
Cash-on-Cash Return
1.1%
Cap rate
0.5%
Rent to Value Ratio
Active
$1,850,000
3
bds
|
3
ba
|
1,550
sqft
|
built
2024
204 Sunrise Dr, Key Biscayne, FL 33149
$-5,054
Cash flow
-14.3%
Cash-on-Cash Return
3.0%
Cap rate
0.5%
Rent to Value Ratio
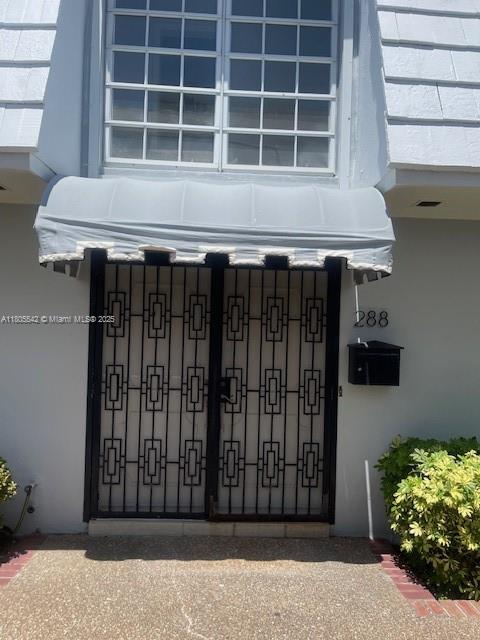
Active
$1,825,000
2
bds
|
3
ba
|
1,800
sqft
|
built
1970
288 Sea View Dr, Key Biscayne, FL 33149
$-8,031
Cash flow
-23.0%
Cash-on-Cash Return
1.0%
Cap rate
0.4%
Rent to Value Ratio

Active
$2,985,000
4
bds
|
3
ba
|
1,817
sqft
|
built
1951
310 Woodcrest Rd, Key Biscayne, FL 33149
$-9,937
Cash flow
-17.4%
Cash-on-Cash Return
2.3%
Cap rate
0.3%
Rent to Value Ratio

Active
$2,150,000
3
bds
|
3
ba
|
1,830
sqft
|
built
1998
701 Crandon Blvd, Key Biscayne, FL 33149
$-8,224
Cash flow
-20.0%
Cash-on-Cash Return
1.7%
Cap rate
0.5%
Rent to Value Ratio
Active
$499,000
1
bds
|
1
ba
|
690
sqft
|
built
1969
200 Galen Dr, Key Biscayne, FL 33149
$-1,054
Cash flow
-11.0%
Cash-on-Cash Return
3.7%
Cap rate
0.7%
Rent to Value Ratio
Active
$749,000
3
bds
|
2
ba
|
1,100
sqft
|
built
1967
240 Galen Dr, Key Biscayne, FL 33149
$-2,818
Cash flow
-19.6%
Cash-on-Cash Return
1.8%
Cap rate
0.5%
Rent to Value Ratio

Active
$1,100,000
3
bds
|
2
ba
|
1,273
sqft
|
built
1964
290 Sunrise Dr, Key Biscayne, FL 33149
$-4,356
Cash flow
-20.7%
Cash-on-Cash Return
1.5%
Cap rate
0.4%
Rent to Value Ratio

Active
$4,995,000
6
bds
|
7
ba
|
3,646
sqft
|
built
2013
689 Glenridge Rd, Key Biscayne, FL 33149
$-22,420
Cash flow
-23.4%
Cash-on-Cash Return
0.9%
Cap rate
0.2%
Rent to Value Ratio
Active
$1,695,000
2
bds
|
2
ba
|
1,782
sqft
|
built
1971
1121 Crandon Blvd, Key Biscayne, FL 33149
$-7,231
Cash flow
-22.3%
Cash-on-Cash Return
1.2%
Cap rate
0.5%
Rent to Value Ratio
Active
$6,345,000
6
bds
|
6
ba
|
3,854
sqft
|
built
2020
310 Redwood Ln, Key Biscayne, FL 33149
$-30,256
Cash flow
-24.9%
Cash-on-Cash Return
0.6%
Cap rate
0.2%
Rent to Value Ratio
Active
$2,870,000
3
bds
|
3
ba
|
2,667
sqft
|
built
2002
727 Crandon Blvd, Key Biscayne, FL 33149
$-10,967
Cash flow
-19.9%
Cash-on-Cash Return
1.7%
Cap rate
0.4%
Rent to Value Ratio
Active
$4,500,000
3
bds
|
3
ba
|
2,927
sqft
|
built
1964
141 Island Dr, Key Biscayne, FL 33149
$-18,550
Cash flow
-21.5%
Cash-on-Cash Return
1.3%
Cap rate
0.2%
Rent to Value Ratio
Active
$10,500,000
5
bds
|
6
ba
|
4,810
sqft
|
built
1996
445 Grand Bay Dr, Key Biscayne, FL 33149
$-64,396
Cash flow
-32.0%
Cash-on-Cash Return
-1.1%
Cap rate
0.1%
Rent to Value Ratio

Active
$1,450,000
3
bds
|
2
ba
|
1,541
sqft
|
built
1978
201 Crandon Blvd, Key Biscayne, FL 33149
$-4,630
Cash flow
-16.7%
Cash-on-Cash Return
2.5%
Cap rate
0.5%
Rent to Value Ratio

Active
$3,650,000
4
bds
|
3
ba
|
2,177
sqft
|
built
1953
255 Ridgewood Rd, Key Biscayne, FL 33149
$-13,513
Cash flow
-19.3%
Cash-on-Cash Return
1.8%
Cap rate
0.3%
Rent to Value Ratio
Active
$5,390,000
7
bds
|
6
ba
|
3,888
sqft
|
built
1951
635 Curtiswood Dr, Key Biscayne, FL 33149
$-23,745
Cash flow
-23.0%
Cash-on-Cash Return
1.0%
Cap rate
0.2%
Rent to Value Ratio
Active
$875,000
2
bds
|
2
ba
|
1,260
sqft
|
built
1973
155 Ocean Lane Dr, Key Biscayne, FL 33149
$-2,879
Cash flow
-17.2%
Cash-on-Cash Return
2.3%
Cap rate
0.7%
Rent to Value Ratio