Mandeville, LA Investment Properties for Sale
Browse homes for sale and investment properties in Mandeville, LA. Refine your search by price, property type, or more.
Best cash flowing properties in Mandeville, LA
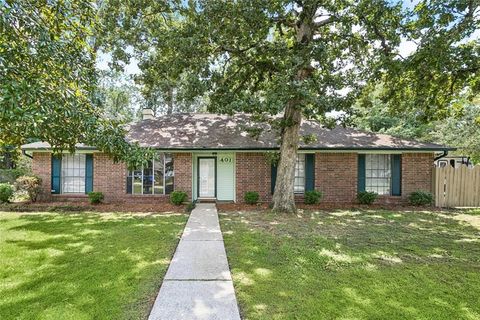
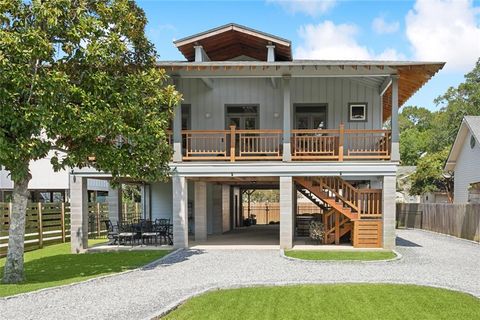
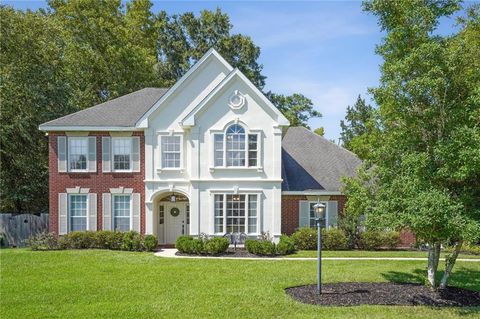
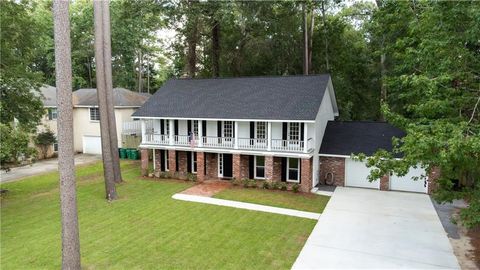
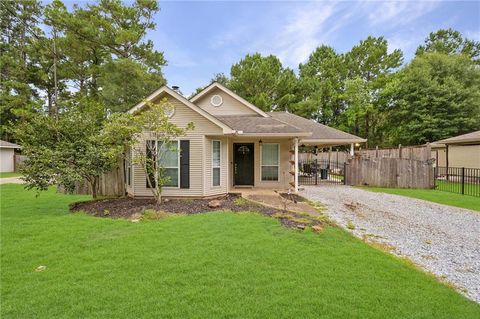
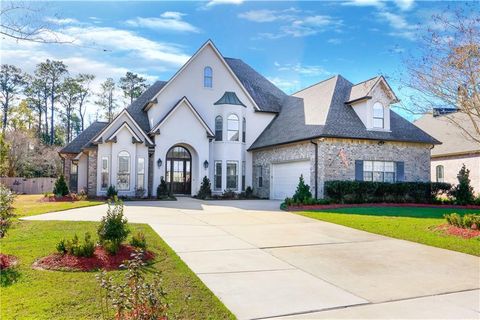
Active
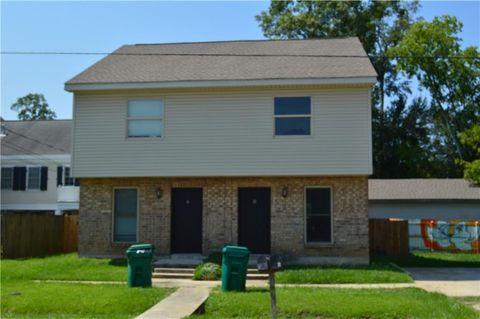
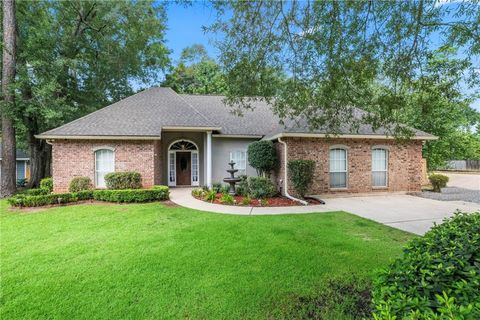
$275,000
3
bds
|
2
ba
|
2,065
sqft
|
built
1979
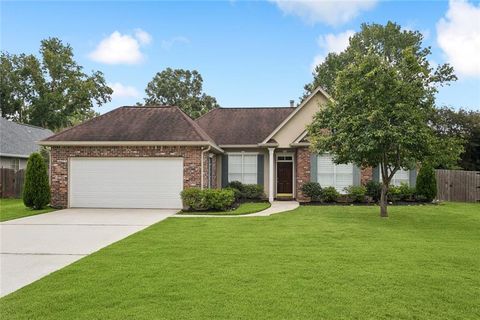
401 Water Oak Ln, Mandeville, LA 70471
$416
Cash flow
7.9%
Cash-on-Cash Return
7.5%
Cap rate
0.9%
Rent to Value Ratio
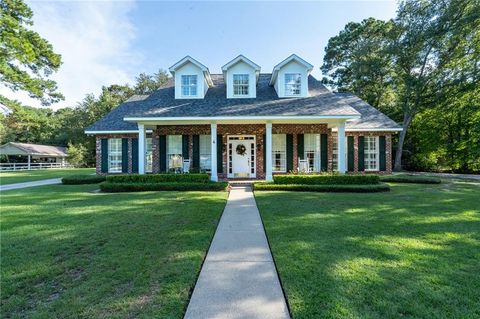
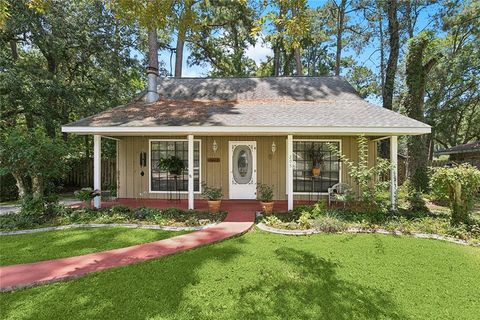
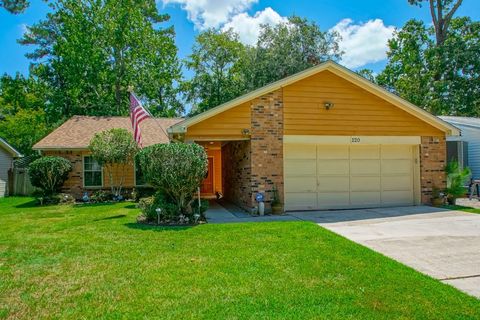
Active
$289,000
4
bds
|
2
ba
|
1,860
sqft
|
built
1978
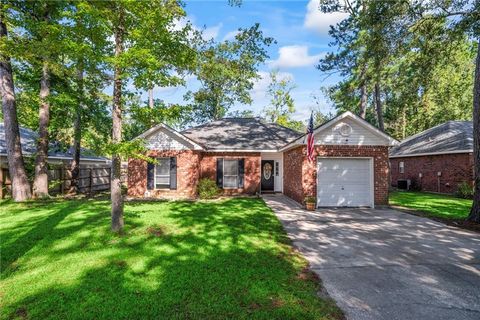
1930 Dupard St, Mandeville, LA 70448
$357
Cash flow
6.4%
Cash-on-Cash Return
7.2%
Cap rate
0.9%
Rent to Value Ratio
128 out of 154 properties for sale in Mandeville, LA
Limited Results Shown
Create a free account, or log in to reveal all property listings and enjoy the complete experience.
Active
$574,999
4
bds
|
3
ba
|
2,444
sqft
|
built
2006
100 Chacahoula Ln, Mandeville, LA 70471
$-733
Cash flow
-6.7%
Cash-on-Cash Return
4.1%
Cap rate
0.6%
Rent to Value Ratio
Active
$550,000
3
bds
|
3
ba
|
2,239
sqft
|
built
2022
67562 Antioch Dr, Mandeville, LA 70471
$-20
Cash flow
-0.2%
Cash-on-Cash Return
5.6%
Cap rate
0.7%
Rent to Value Ratio
Active
$599,000
3
bds
|
2
ba
|
1,404
sqft
|
built
2015
238 Lamarque St, Mandeville, LA 70448
$-1,455
Cash flow
-12.7%
Cash-on-Cash Return
2.8%
Cap rate
0.3%
Rent to Value Ratio
Active
$799,000
4
bds
|
4
ba
|
3,376
sqft
|
built
1992
4 Rene Ct, Mandeville, LA 70471
$-1,366
Cash flow
-8.9%
Cash-on-Cash Return
3.6%
Cap rate
0.4%
Rent to Value Ratio
Active
$489,000
5
bds
|
3
ba
|
2,984
sqft
|
built
1998
265 Remington Dr, Mandeville, LA 70448
$62
Cash flow
0.7%
Cash-on-Cash Return
5.8%
Cap rate
0.7%
Rent to Value Ratio
Active
$250,000
4
bds
|
3
ba
|
1,927
sqft
|
built
1979
625 Ridgewood Dr, Mandeville, LA 70471
$128
Cash flow
2.7%
Cash-on-Cash Return
6.3%
Cap rate
0.8%
Rent to Value Ratio
Active
$399,900
4
bds
|
3
ba
|
2,300
sqft
|
built
1989
2020 Madison St, Mandeville, LA 70448
$-581
Cash flow
-7.6%
Cash-on-Cash Return
3.9%
Cap rate
0.5%
Rent to Value Ratio
Active
$710,000
5
bds
|
4
ba
|
2,781
sqft
|
built
2022
1763 Hazel Dr, Mandeville, LA 70448
$-339
Cash flow
-2.5%
Cash-on-Cash Return
5.1%
Cap rate
0.6%
Rent to Value Ratio
Active
$325,000
3
bds
|
2
ba
|
1,094
sqft
|
built
1925
2036 Monroe St, Mandeville, LA 70448
$-434
Cash flow
-7.0%
Cash-on-Cash Return
4.1%
Cap rate
0.5%
Rent to Value Ratio
Active
$637,000
4
bds
|
3
ba
|
3,540
sqft
|
built
2005
348 Sandalwood Dr, Mandeville, LA 70448
$335
Cash flow
2.7%
Cash-on-Cash Return
6.3%
Cap rate
0.8%
Rent to Value Ratio
Active
$725,000
5
bds
|
3
ba
|
3,662
sqft
|
built
1997
1394 Stillwater Dr, Mandeville, LA 70471
$-1,088
Cash flow
-7.8%
Cash-on-Cash Return
3.9%
Cap rate
0.5%
Rent to Value Ratio
Active
$224,900
3
bds
|
2
ba
|
1,529
sqft
|
built
1981
205 Surgi Dr, Mandeville, LA 70448
$247
Cash flow
5.7%
Cash-on-Cash Return
7.0%
Cap rate
0.8%
Rent to Value Ratio
Active
$494,400
4
bds
|
3
ba
|
2,821
sqft
|
built
1983
102 Chickamaw Pl, Mandeville, LA 70471
$-649
Cash flow
-6.8%
Cash-on-Cash Return
4.1%
Cap rate
0.6%
Rent to Value Ratio
Active
$490,900
4
bds
|
3
ba
|
2,605
sqft
|
built
2004
1246 Carroll St, Mandeville, LA 70448
$-391
Cash flow
-4.2%
Cash-on-Cash Return
4.7%
Cap rate
0.6%
Rent to Value Ratio
Active
$330,000
3
bds
|
2
ba
|
1,669
sqft
|
built
1999
1353 Albert St, Mandeville, LA 70448
$-199
Cash flow
-3.1%
Cash-on-Cash Return
5.0%
Cap rate
0.6%
Rent to Value Ratio
Active
$250,000
3
bds
|
2
ba
|
1,455
sqft
|
built
1995
2018 Steven St, Mandeville, LA 70448
$128
Cash flow
2.7%
Cash-on-Cash Return
6.3%
Cap rate
0.8%
Rent to Value Ratio
Active
$980,000
5
bds
|
4
ba
|
3,944
sqft
|
built
1985
258 Evangeline Dr, Mandeville, LA 70471
$-2,359
Cash flow
-12.6%
Cash-on-Cash Return
2.8%
Cap rate
0.4%
Rent to Value Ratio
Active
$489,000
4
bds
|
3
ba
|
3,080
sqft
|
built
1993
7013 Edgewater Dr, Mandeville, LA 70471
$-106
Cash flow
-1.1%
Cash-on-Cash Return
5.4%
Cap rate
0.7%
Rent to Value Ratio
Active
$415,000
5
bds
|
3
ba
|
2,289
sqft
|
built
2002
330 Westwood Dr, Mandeville, LA 70471
$-114
Cash flow
-1.4%
Cash-on-Cash Return
5.3%
Cap rate
0.7%
Rent to Value Ratio
Active
$440,000
4
bds
|
3
ba
|
2,525
sqft
|
built
1976
390 Azalea Dr, Mandeville, LA 70471
$-155
Cash flow
-1.8%
Cash-on-Cash Return
5.3%
Cap rate
0.6%
Rent to Value Ratio
Active
$539,900
4
bds
|
2
ba
|
2,105
sqft
|
built
1994
414 Westwood Dr, Mandeville, LA 70471
$-429
Cash flow
-4.1%
Cash-on-Cash Return
4.7%
Cap rate
0.6%
Rent to Value Ratio
Active
$200,000
3
bds
|
2
ba
|
1,554
sqft
|
built
1982
701 Armand St, Mandeville, LA 70448
$296
Cash flow
7.7%
Cash-on-Cash Return
7.5%
Cap rate
0.9%
Rent to Value Ratio
Active
$550,000
4
bds
|
3
ba
|
2,762
sqft
|
built
1984
111 Shaunell Dr, Mandeville, LA 70448
$-1,020
Cash flow
-9.7%
Cash-on-Cash Return
3.5%
Cap rate
0.4%
Rent to Value Ratio
Active
$765,000
5
bds
|
3
ba
|
3,681
sqft
|
built
1975
202 Doby Dr, Mandeville, LA 70448
$-860
Cash flow
-5.9%
Cash-on-Cash Return
4.3%
Cap rate
0.5%
Rent to Value Ratio
Active
$700,000
5
bds
|
4
ba
|
3,627
sqft
|
built
2003
127 Morningside Dr, Mandeville, LA 70448
$-930
Cash flow
-6.9%
Cash-on-Cash Return
4.1%
Cap rate
0.5%
Rent to Value Ratio
Active
$383,500
4
bds
|
2
ba
|
2,121
sqft
|
built
1994
817 Harmony Ln, Mandeville, LA 70471
$-148
Cash flow
-2.0%
Cash-on-Cash Return
5.2%
Cap rate
0.7%
Rent to Value Ratio
Active
$448,000
5
bds
|
5
ba
|
3,264
sqft
|
built
2005
1207 Rue Degas, Mandeville, LA 70471
$-138
Cash flow
-1.6%
Cash-on-Cash Return
5.3%
Cap rate
0.7%
Rent to Value Ratio
Active
$209,000
3
bds
|
2
ba
|
1,187
sqft
|
built
1990
1315 America St, Mandeville, LA 70448
$115
Cash flow
2.9%
Cash-on-Cash Return
6.3%
Cap rate
0.8%
Rent to Value Ratio
Active
$390,000
4
bds
|
3
ba
|
2,491
sqft
|
built
1992
106 Frenchmen Dr, Mandeville, LA 70448
$293
Cash flow
3.9%
Cash-on-Cash Return
6.6%
Cap rate
0.8%
Rent to Value Ratio
Active
$465,000
4
bds
|
3
ba
|
2,469
sqft
|
built
1994
157 Remington Dr, Mandeville, LA 70448
$-377
Cash flow
-4.2%
Cash-on-Cash Return
4.7%
Cap rate
0.6%
Rent to Value Ratio
Active
$224,500
3
bds
|
2
ba
|
1,225
sqft
|
built
2007
1619 Clover St, Mandeville, LA 70448
$42
Cash flow
1.0%
Cash-on-Cash Return
5.9%
Cap rate
0.7%
Rent to Value Ratio
Active
$245,000
2
bds
|
3
ba
|
1,478
sqft
|
built
1987
607 Colbert St, Mandeville, LA 70448
$83
Cash flow
1.8%
Cash-on-Cash Return
6.1%
Cap rate
0.7%
Rent to Value Ratio
Active
$249,500
3
bds
|
2
ba
|
1,559
sqft
|
built
1985
220 Forest Loop, Mandeville, LA 70471
$61
Cash flow
1.3%
Cash-on-Cash Return
6.0%
Cap rate
0.7%
Rent to Value Ratio
Active
$270,000
3
bds
|
2
ba
|
1,640
sqft
|
built
1990
2183 Rue Pickney, Mandeville, LA 70448
$102
Cash flow
2.0%
Cash-on-Cash Return
6.1%
Cap rate
0.7%
Rent to Value Ratio
Active
$975,000
5
bds
|
5
ba
|
4,442
sqft
|
built
2004
235 Morningside Dr, Mandeville, LA 70448
$-770
Cash flow
-4.1%
Cash-on-Cash Return
4.7%
Cap rate
0.6%
Rent to Value Ratio
Active
$348,000
4
bds
|
2
ba
|
1,977
sqft
|
built
1982
403 Evergreen Dr, Mandeville, LA 70471
$68
Cash flow
1.0%
Cash-on-Cash Return
5.9%
Cap rate
0.7%
Rent to Value Ratio
Active
$215,000
3
bds
|
3
ba
|
1,428
sqft
|
built
1984
704 Colbert St, Mandeville, LA 70448
$294
Cash flow
7.1%
Cash-on-Cash Return
7.3%
Cap rate
0.9%
Rent to Value Ratio
Active
$360,000
2
bds
|
2
ba
|
1,234
sqft
|
built
1984
2340 Mathis St, Mandeville, LA 70448
$-600
Cash flow
-8.7%
Cash-on-Cash Return
3.7%
Cap rate
0.4%
Rent to Value Ratio