Milford, CT Investment Properties for Sale
Browse homes for sale and investment properties in Milford, CT. Refine your search by price, property type, or more.
Best cash flowing properties in Milford, CT
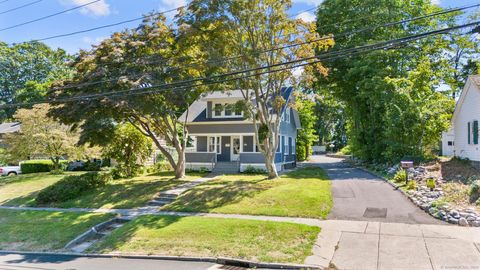
Active
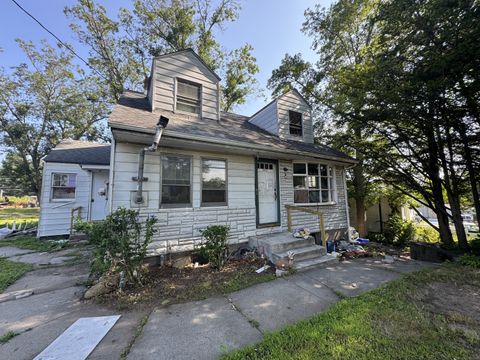
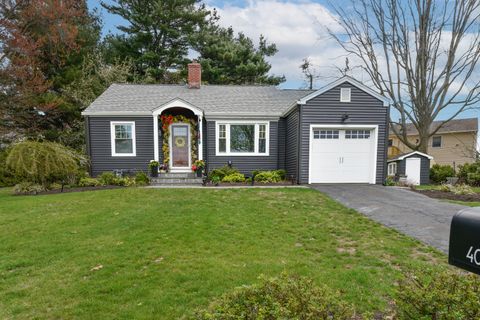
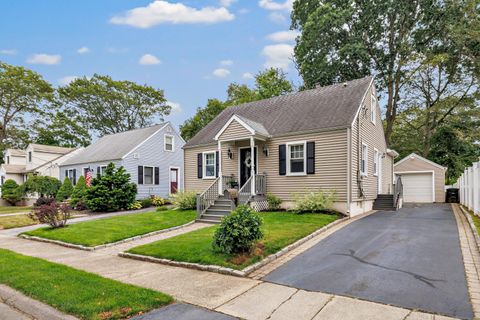
$319,999
3
bds
|
1
ba
|
1,360
sqft
|
built
1942
583 Anderson Ave, Milford, CT 06460
$64
Cash flow
1.0%
Cash-on-Cash Return
5.9%
Cap rate
0.9%
Rent to Value Ratio
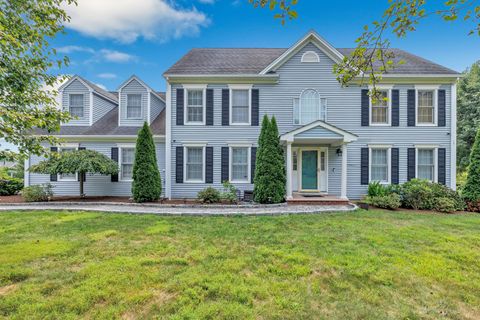
Active
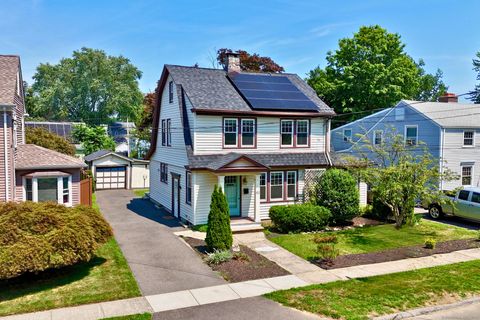
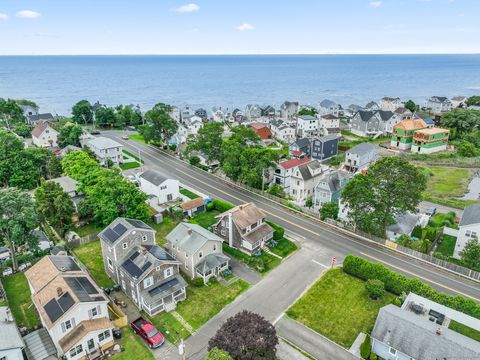
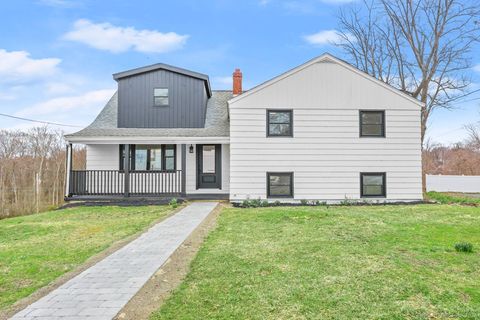
$434,900
3
bds
|
1
ba
|
1,770
sqft
|
built
1923
43 Judson Pl, Milford, CT 06461
$-194
Cash flow
-2.3%
Cash-on-Cash Return
5.1%
Cap rate
0.8%
Rent to Value Ratio
42 out of 55 properties for sale in Milford, CT
Limited Results Shown
Create a free account, or log in to reveal all property listings and enjoy the complete experience.
Active
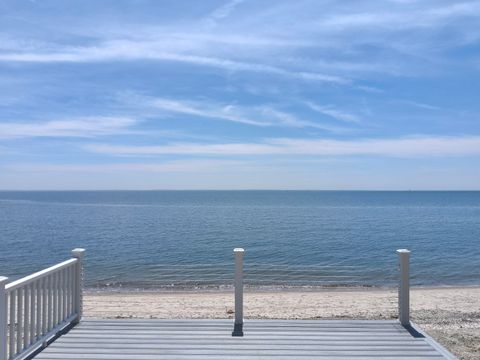
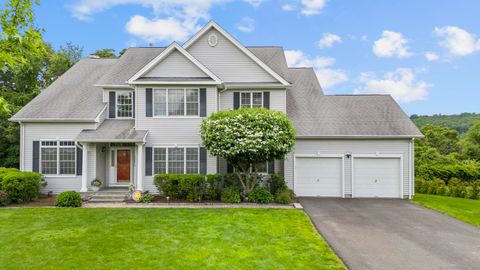
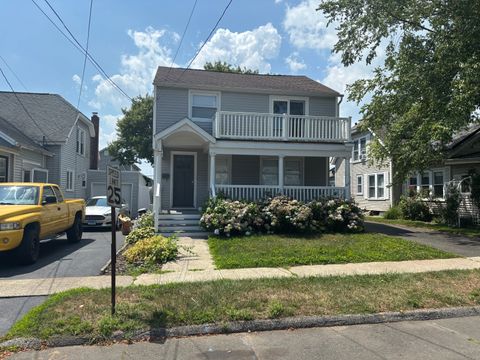
$1,850,000
4
bds
|
3
ba
|
1,744
sqft
|
built
1916
43 Melba St, Milford, CT 06460
$-6,584
Cash flow
-18.6%
Cash-on-Cash Return
1.4%
Cap rate
0.3%
Rent to Value Ratio
Active
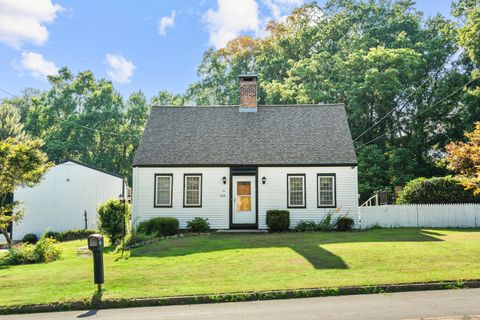
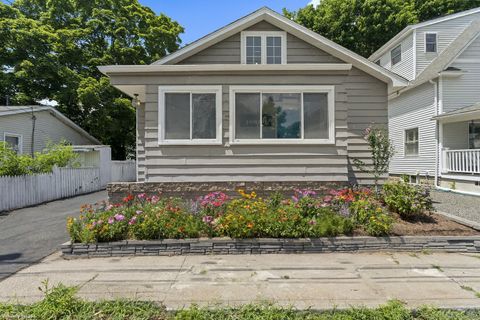
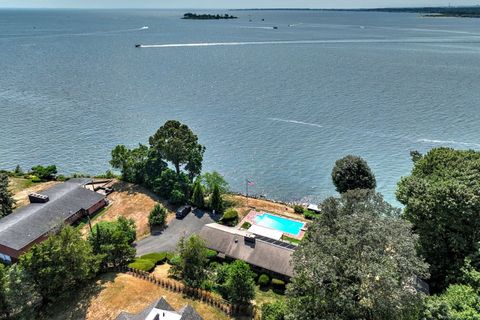
$529,000
3
bds
|
2
ba
|
1,760
sqft
|
built
1968
324 Wheelers Farms Rd, Milford, CT 06461
$-767
Cash flow
-7.6%
Cash-on-Cash Return
3.9%
Cap rate
0.7%
Rent to Value Ratio
Active
$499,900
3
bds
|
3
ba
|
1,360
sqft
|
built
1979
822 New Haven Ave, Milford, CT 06460
$-816
Cash flow
-8.5%
Cash-on-Cash Return
3.7%
Cap rate
0.6%
Rent to Value Ratio
Active
$499,999
3
bds
|
3
ba
|
1,540
sqft
|
built
1978
25 Summer Pl, Milford, CT 06460
$-714
Cash flow
-7.5%
Cash-on-Cash Return
4.0%
Cap rate
0.6%
Rent to Value Ratio
Active
$614,900
3
bds
|
2
ba
|
2,992
sqft
|
built
1953
36 Kenwood Rd, Milford, CT 06460
$-636
Cash flow
-5.4%
Cash-on-Cash Return
4.4%
Cap rate
0.7%
Rent to Value Ratio
Active
$749,000
3
bds
|
2
ba
|
1,020
sqft
|
built
1907
8 Waterbury Ave, Milford, CT 06460
$-2,432
Cash flow
-16.9%
Cash-on-Cash Return
1.8%
Cap rate
0.4%
Rent to Value Ratio
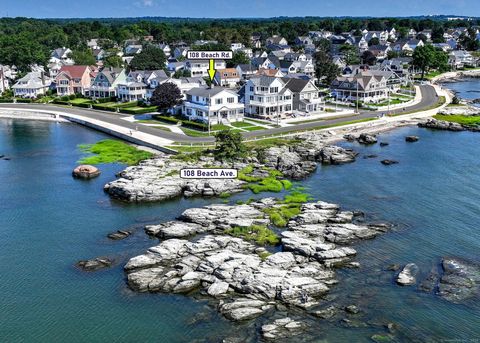
Active
$2,349,000
5
bds
|
4
ba
|
4,731
sqft
|
built
1910
108 Beach Ave, Milford, CT 06460
$-10,552
Cash flow
-23.4%
Cash-on-Cash Return
0.3%
Cap rate
0.2%
Rent to Value Ratio
Active
$680,000
3
bds
|
2
ba
|
1,110
sqft
|
built
1925
155 Broadway, Milford, CT 06460
$-1,727
Cash flow
-13.3%
Cash-on-Cash Return
2.6%
Cap rate
0.4%
Rent to Value Ratio
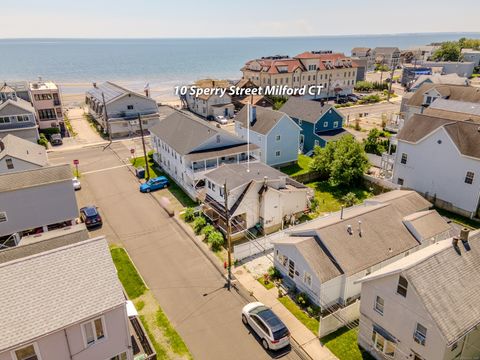
Active
$428,500
2
bds
|
2
ba
|
1,022
sqft
|
built
1928
10 Sperry St, Milford, CT 06460
$-365
Cash flow
-4.4%
Cash-on-Cash Return
4.7%
Cap rate
0.7%
Rent to Value Ratio
Active
$599,900
3
bds
|
2
ba
|
902
sqft
|
built
1910
119 Melba St, Milford, CT 06460
$-1,836
Cash flow
-16.0%
Cash-on-Cash Return
2.0%
Cap rate
0.4%
Rent to Value Ratio

Active
$1,975,000
4
bds
|
4
ba
|
3,869
sqft
|
built
1954
91 Shelter Cove Rd, Milford, CT 06460
$-7,867
Cash flow
-20.8%
Cash-on-Cash Return
0.9%
Cap rate
0.3%
Rent to Value Ratio
Active
$523,000
2
bds
|
2
ba
|
1,143
sqft
|
built
2021
40 Washington St, Milford, CT 06460
$-956
Cash flow
-9.5%
Cash-on-Cash Return
3.5%
Cap rate
0.6%
Rent to Value Ratio
Active
$450,000
3
bds
|
2
ba
|
1,169
sqft
|
built
1925
5 Vine St, Milford, CT 06460
$-628
Cash flow
-7.3%
Cash-on-Cash Return
4.0%
Cap rate
0.6%
Rent to Value Ratio
Active
$819,000
4
bds
|
3
ba
|
3,487
sqft
|
built
2002
81 Masters Ln, Milford, CT 06461
$-1,476
Cash flow
-9.4%
Cash-on-Cash Return
3.5%
Cap rate
0.6%
Rent to Value Ratio
Active
$540,000
3
bds
|
2
ba
|
1,580
sqft
|
built
1923
9 Willow St, Milford, CT 06460
$-374
Cash flow
-3.6%
Cash-on-Cash Return
4.8%
Cap rate
0.7%
Rent to Value Ratio
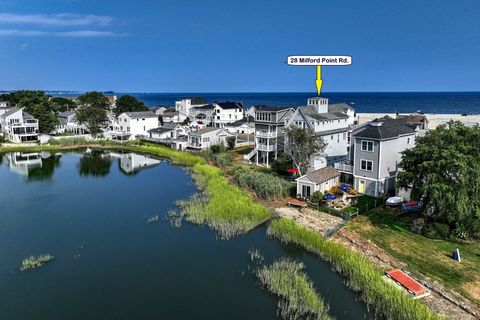
Active
$1,529,000
3
bds
|
4
ba
|
2,451
sqft
|
built
2004
28 Milford Point Rd, Milford, CT 06460
$-3,162
Cash flow
-10.8%
Cash-on-Cash Return
3.2%
Cap rate
0.5%
Rent to Value Ratio
Active
$1,890,000
4
bds
|
6
ba
|
6,572
sqft
|
built
1915
139 Rogers Ave, Milford, CT 06460
$-5,667
Cash flow
-15.6%
Cash-on-Cash Return
2.1%
Cap rate
0.4%
Rent to Value Ratio
Active
$435,900
2
bds
|
1
ba
|
912
sqft
|
built
1954
26 Riverdale Rd, Milford, CT 06460
$-799
Cash flow
-9.6%
Cash-on-Cash Return
3.5%
Cap rate
0.6%
Rent to Value Ratio
Active
$565,000
3
bds
|
2
ba
|
1,680
sqft
|
built
1938
51 Sachem St, Milford, CT 06461
$-845
Cash flow
-7.8%
Cash-on-Cash Return
3.9%
Cap rate
0.6%
Rent to Value Ratio
Active
$589,900
2
bds
|
3
ba
|
2,103
sqft
|
built
1942
10 Eastern Pkwy, Milford, CT 06460
$-1,234
Cash flow
-10.9%
Cash-on-Cash Return
3.2%
Cap rate
0.5%
Rent to Value Ratio
Active
$799,900
5
bds
|
3
ba
|
1,691
sqft
|
built
1958
141 Ridgewood Dr, Milford, CT 06460
$-1,224
Cash flow
-8.0%
Cash-on-Cash Return
3.8%
Cap rate
0.6%
Rent to Value Ratio
Active
$450,000
3
bds
|
1
ba
|
1,128
sqft
|
built
1937
38 Atwater St, Milford, CT 06460
$-263
Cash flow
-3.0%
Cash-on-Cash Return
5.0%
Cap rate
0.8%
Rent to Value Ratio
Active
$3,249,000
3
bds
|
2
ba
|
1,732
sqft
|
built
1956
39 Point Lookout, Milford, CT 06460
$-15,625
Cash flow
-25.1%
Cash-on-Cash Return
-0.1%
Cap rate
0.1%
Rent to Value Ratio
Active
$679,000
2
bds
|
2
ba
|
1,365
sqft
|
built
2001
1 Merwin Ave, Milford, CT 06460
$-2,170
Cash flow
-16.7%
Cash-on-Cash Return
1.8%
Cap rate
0.6%
Rent to Value Ratio
Active
$649,900
3
bds
|
2
ba
|
1,120
sqft
|
built
1928
32 Lawrence Ave, Milford, CT 06460
$-1,567
Cash flow
-12.6%
Cash-on-Cash Return
2.8%
Cap rate
0.5%
Rent to Value Ratio
Active
$675,000
4
bds
|
3
ba
|
1,344
sqft
|
built
1979
29 Magellan Dr, Milford, CT 06460
$-1,665
Cash flow
-12.9%
Cash-on-Cash Return
2.7%
Cap rate
0.5%
Rent to Value Ratio

Active
$399,000
3
bds
|
1
ba
|
1,456
sqft
|
built
1930
261 Bridgeport Ave, Milford, CT 06460
$-567
Cash flow
-7.4%
Cash-on-Cash Return
4.0%
Cap rate
0.7%
Rent to Value Ratio
Active
$439,900
3
bds
|
1
ba
|
1,142
sqft
|
built
1954
20 York St, Milford, CT 06460
$-570
Cash flow
-6.8%
Cash-on-Cash Return
4.1%
Cap rate
0.7%
Rent to Value Ratio
Active
$810,000
3
bds
|
3
ba
|
3,080
sqft
|
built
1996
335 Herbert St, Milford, CT 06461
$-2,157
Cash flow
-13.9%
Cash-on-Cash Return
2.5%
Cap rate
0.5%
Rent to Value Ratio
Active
$579,900
3
bds
|
3
ba
|
1,476
sqft
|
built
1910
299 W Main St, Milford, CT 06460
$-1,090
Cash flow
-9.8%
Cash-on-Cash Return
3.4%
Cap rate
0.6%
Rent to Value Ratio
Active
$439,900
4
bds
|
1
ba
|
1,120
sqft
|
built
1942
13 Harkness Dr, Milford, CT 06460
$-591
Cash flow
-7.0%
Cash-on-Cash Return
4.1%
Cap rate
0.7%
Rent to Value Ratio
Active
$650,000
3
bds
|
3
ba
|
2,165
sqft
|
built
1768
571 Pond Point Ave, Milford, CT 06460
$-1,088
Cash flow
-8.7%
Cash-on-Cash Return
3.7%
Cap rate
0.6%
Rent to Value Ratio
Active
$1,199,000
4
bds
|
4
ba
|
2,963
sqft
|
built
2014
40 Devine Pl, Milford, CT 06460
$-3,689
Cash flow
-16.1%
Cash-on-Cash Return
2.0%
Cap rate
0.4%
Rent to Value Ratio
Active
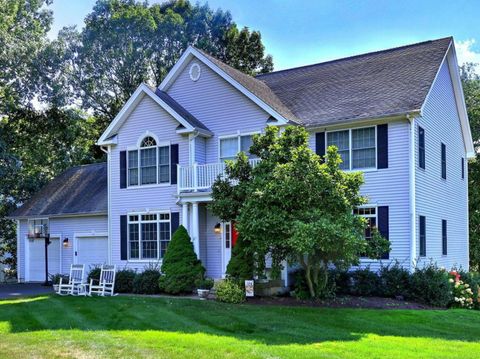
$859,000
4
bds
|
3
ba
|
3,176
sqft
|
built
2002
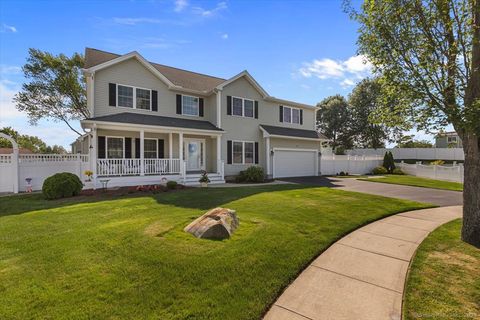
183 Centennial Dr, Milford, CT 06461
$-1,942
Cash flow
-11.8%
Cash-on-Cash Return
3.0%
Cap rate
0.5%
Rent to Value Ratio
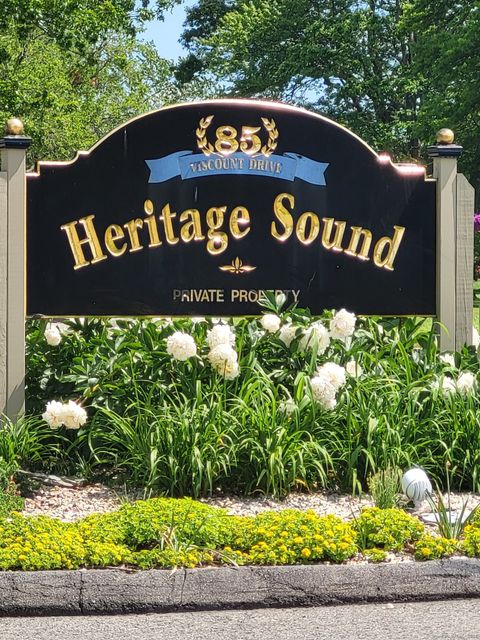
Active
$549,000
2
bds
|
3
ba
|
1,140
sqft
|
built
1974
85 Viscount Dr, Milford, CT 06460
$-1,555
Cash flow
-14.8%
Cash-on-Cash Return
2.3%
Cap rate
0.6%
Rent to Value Ratio
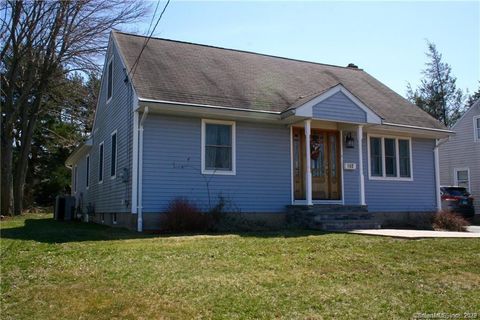
Active
$599,900
4
bds
|
4
ba
|
2,475
sqft
|
built
1953
647 New Haven Ave, Milford, CT 06460
$-816
Cash flow
-7.1%
Cash-on-Cash Return
4.0%
Cap rate
0.7%
Rent to Value Ratio
Active
$789,000
4
bds
|
3
ba
|
2,920
sqft
|
built
1951
25 Lucille Dr, Milford, CT 06460
$-1,893
Cash flow
-12.5%
Cash-on-Cash Return
2.8%
Cap rate
0.5%
Rent to Value Ratio
Active
$799,900
2
bds
|
1
ba
|
1,368
sqft
|
built
1929
10 Point Beach Dr, Milford, CT 06460
$-2,417
Cash flow
-15.8%
Cash-on-Cash Return
2.1%
Cap rate
0.4%
Rent to Value Ratio