Mulberry, FL Investment Properties for Sale
Browse homes for sale and investment properties in Mulberry, FL. Refine your search by price, property type, or more.
Best cash flowing properties in Mulberry, FL
Active
$156,500
2
bds
|
2
ba
|
968
sqft
|
built
1983
4243 Oak Loop, Mulberry, FL 33860
$161
Cash flow
5.4%
Cash-on-Cash Return
7.4%
Cap rate
1.0%
Rent to Value Ratio
Active
$140,000
2
bds
|
1
ba
|
720
sqft
|
built
1961
2293 Pump Rd, Mulberry, FL 33860
$135
Cash flow
5.0%
Cash-on-Cash Return
7.3%
Cap rate
1.0%
Rent to Value Ratio
32 out of 37 properties for sale in Mulberry, FL
Limited Results Shown
Create a free account, or log in to reveal all property listings and enjoy the complete experience.
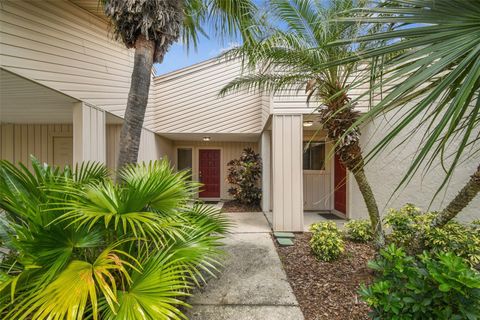
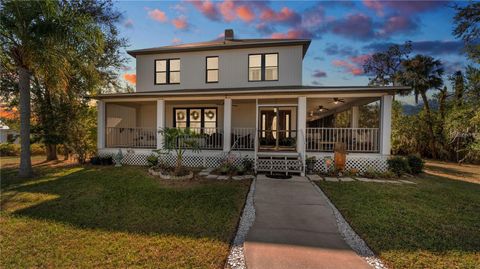
Active
$264,500
3
bds
|
2
ba
|
1,260
sqft
|
built
2014
330 Diesel Rd, Mulberry, FL 33860
$-198
Cash flow
-3.9%
Cash-on-Cash Return
5.2%
Cap rate
0.7%
Rent to Value Ratio
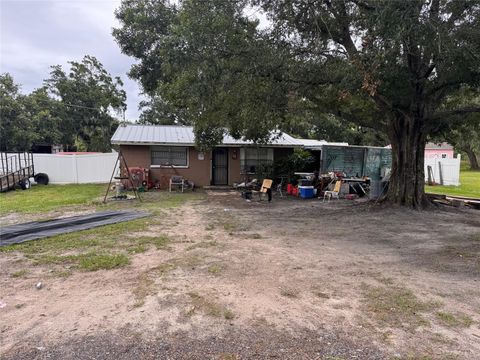
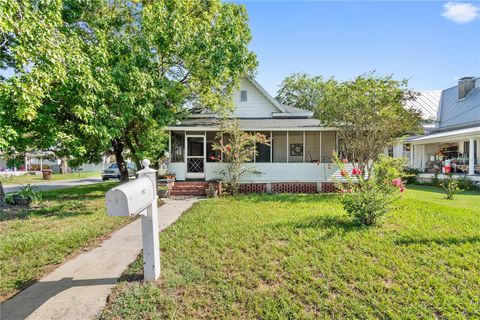
Active
$250,000
3
bds
|
2
ba
|
1,172
sqft
|
built
1967
311 SW 3rd Ave, Mulberry, FL 33860
$-505
Cash flow
-10.5%
Cash-on-Cash Return
3.7%
Cap rate
0.6%
Rent to Value Ratio
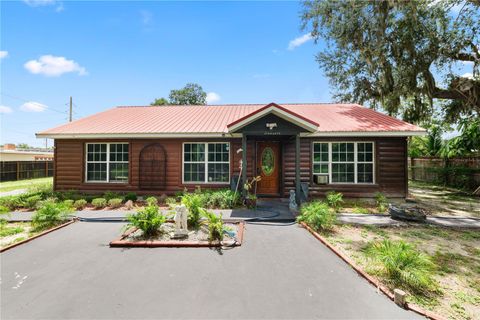
Active
$369,000
3
bds
|
2
ba
|
1,757
sqft
|
built
2009
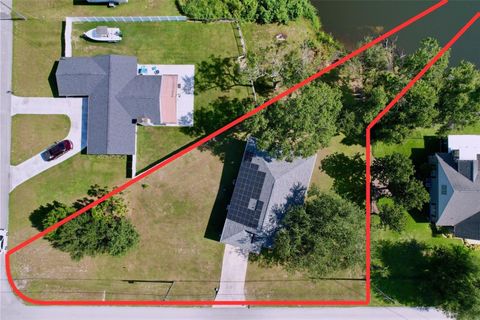
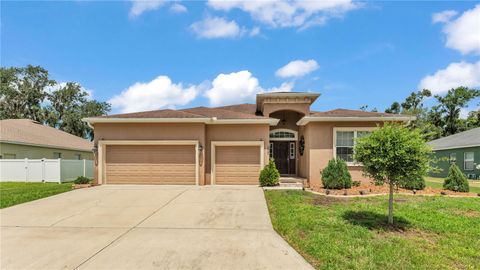
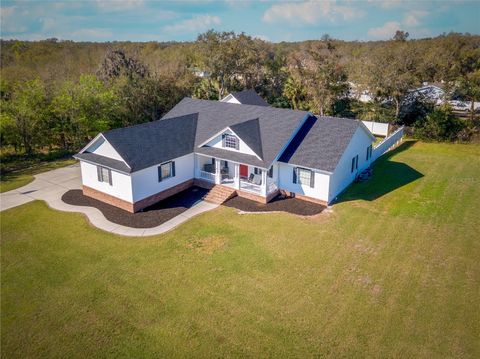
4285 Meadowood Dr, Mulberry, FL 33860
$-319
Cash flow
-4.5%
Cash-on-Cash Return
5.1%
Cap rate
0.7%
Rent to Value Ratio
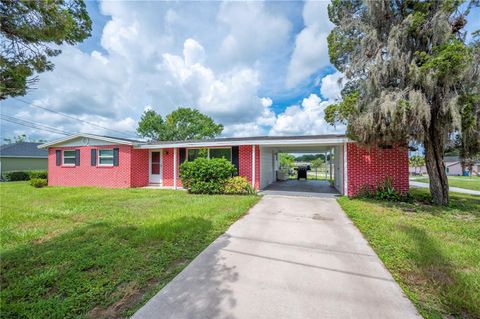
Active
$364,999
4
bds
|
2
ba
|
1,946
sqft
|
built
2009
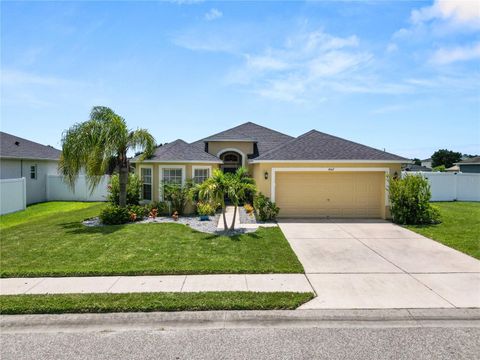
4662 Harts Brook Ln, Mulberry, FL 33860
$-448
Cash flow
-6.4%
Cash-on-Cash Return
4.7%
Cap rate
0.7%
Rent to Value Ratio
Active
$340,000
4
bds
|
3
ba
|
2,184
sqft
|
built
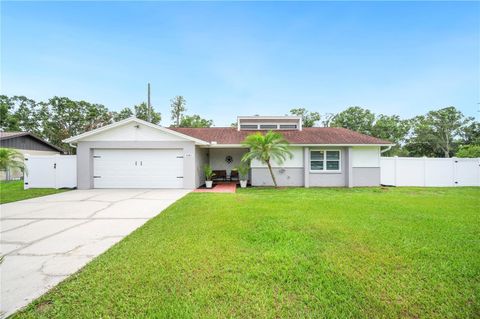
1973
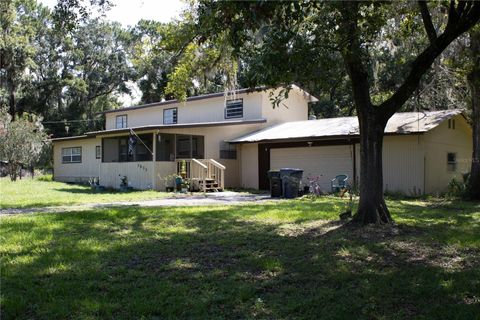
5635 Kimball Rd, Mulberry, FL 33860
$-514
Cash flow
-7.9%
Cash-on-Cash Return
4.3%
Cap rate
0.7%
Rent to Value Ratio
Active
$244,000
3
bds
|
2
ba
|
1,107
sqft
|
built
1980
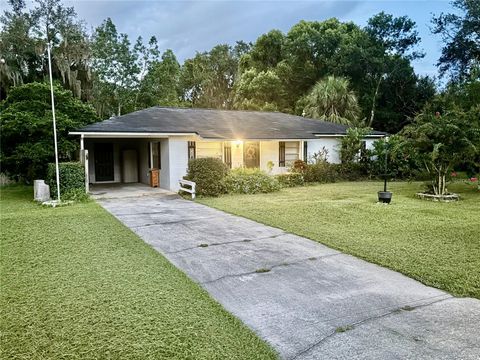
2955 Howard St, Mulberry, FL 33860
$-81
Cash flow
-1.7%
Cash-on-Cash Return
5.7%
Cap rate
0.7%
Rent to Value Ratio
Active
$449,999
4
bds
|
4
ba
|
2,411
sqft
|
built
1923
504 NW 9th St, Mulberry, FL 33860
$-617
Cash flow
-7.2%
Cash-on-Cash Return
4.5%
Cap rate
0.7%
Rent to Value Ratio
Active
$240,000
3
bds
|
2
ba
|
1,562
sqft
|
built
1920
202 E Badcock Blvd, Mulberry, FL 33860
$-34
Cash flow
-0.7%
Cash-on-Cash Return
6.0%
Cap rate
0.9%
Rent to Value Ratio
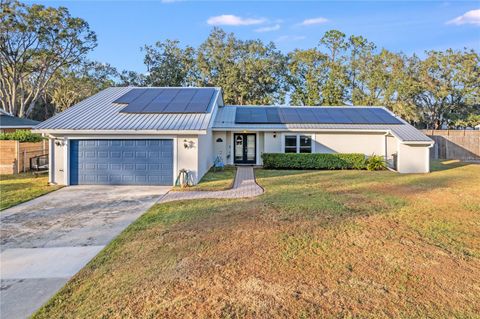
Active
$350,000
4
bds
|
2
ba
|
1,828
sqft
|
built
2019
228 St Thomas Dr, Mulberry, FL 33860
$-457
Cash flow
-6.8%
Cash-on-Cash Return
4.6%
Cap rate
0.7%
Rent to Value Ratio
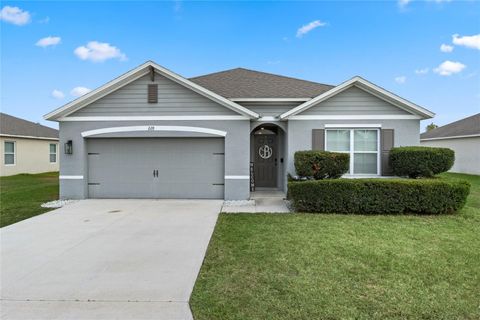
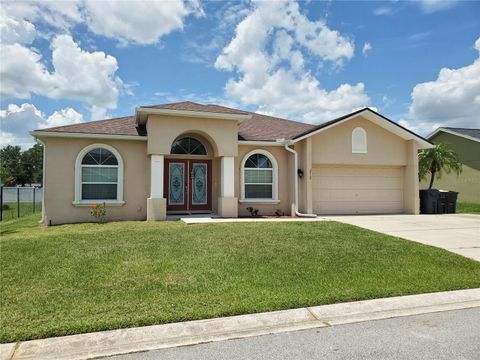
Active
$330,000
3
bds
|
2
ba
|
1,690
sqft
|
built
2019
198 St Thomas Dr, Mulberry, FL 33860
$-476
Cash flow
-7.5%
Cash-on-Cash Return
4.4%
Cap rate
0.7%
Rent to Value Ratio
Active
$355,000
4
bds
|
3
ba
|
2,822
sqft
|
built
2003
2228 Blackwood Dr, Mulberry, FL 33860
$-274
Cash flow
-4.0%
Cash-on-Cash Return
5.2%
Cap rate
0.8%
Rent to Value Ratio
Active
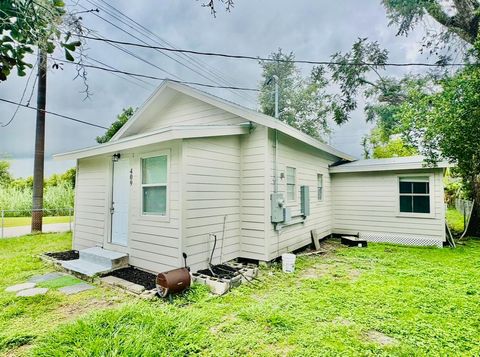
$195,000
3
bds
|
1
ba
|
860
sqft
|
built
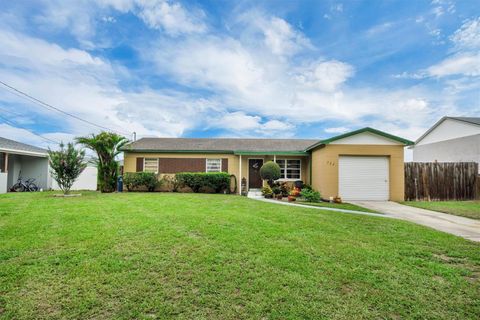
1939
409 SW 2nd Ave, Mulberry, FL 33860
$-101
Cash flow
-2.7%
Cash-on-Cash Return
5.5%
Cap rate
0.8%
Rent to Value Ratio

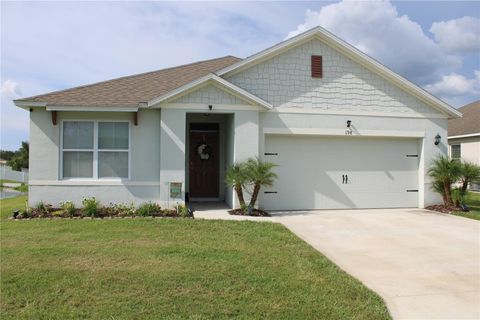
Active
$379,990
3
bds
|
2
ba
|
2,025
sqft
|
built
2022
134 St Thomas Dr, Mulberry, FL 33860
$-627
Cash flow
-8.6%
Cash-on-Cash Return
4.2%
Cap rate
0.7%
Rent to Value Ratio
Active
$339,000
3
bds
|
2
ba
|
1,525
sqft
|
built
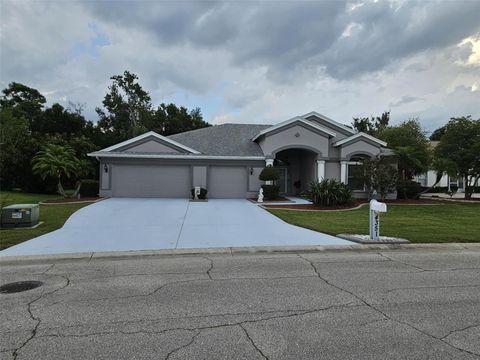
2010
4458 Creekside Dr, Mulberry, FL 33860
$-591
Cash flow
-9.1%
Cash-on-Cash Return
4.1%
Cap rate
0.6%
Rent to Value Ratio

Active
$164,000
2
bds
|
2
ba
|
1,080
sqft
|
built
1983
4241 Oak Loop, Mulberry, FL 33860
$113
Cash flow
3.6%
Cash-on-Cash Return
7.0%
Cap rate
1.0%
Rent to Value Ratio
Active
$359,000
3
bds
|
3
ba
|
2,620
sqft
|
built
2007
3112 Kearns Rd, Mulberry, FL 33860
$-298
Cash flow
-4.3%
Cash-on-Cash Return
5.2%
Cap rate
0.7%
Rent to Value Ratio

Active
$300,000
4
bds
|
3
ba
|
1,612
sqft
|
built
1960
150 North Ave, Mulberry, FL 33860
$-492
Cash flow
-8.6%
Cash-on-Cash Return
4.2%
Cap rate
0.6%
Rent to Value Ratio
Active
$454,900
4
bds
|
3
ba
|
2,673
sqft
|
built
2013
2932 Blackwater Oaks Dr, Mulberry, FL 33860
$-712
Cash flow
-8.2%
Cash-on-Cash Return
4.3%
Cap rate
0.6%
Rent to Value Ratio
Active
$292,500
2
bds
|
2
ba
|
1,315
sqft
|
built
1979
3080 Cross Fox Dr, Mulberry, FL 33860
$-162
Cash flow
-2.9%
Cash-on-Cash Return
5.5%
Cap rate
0.8%
Rent to Value Ratio
Active
$263,000
3
bds
|
2
ba
|
1,197
sqft
|
built
1956
322 NE 9th St, Mulberry, FL 33860
$-209
Cash flow
-4.1%
Cash-on-Cash Return
5.2%
Cap rate
0.7%
Rent to Value Ratio
Active
$550,000
4
bds
|
3
ba
|
2,865
sqft
|
built
1996
4351 Winding Oaks Cir, Mulberry, FL 33860
$-1,316
Cash flow
-12.5%
Cash-on-Cash Return
3.3%
Cap rate
0.6%
Rent to Value Ratio
Active
$525,000
4
bds
|
3
ba
|
2,283
sqft
|
built
2012
2933 Blackwater Oaks Dr, Mulberry, FL 33860
$-1,154
Cash flow
-11.5%
Cash-on-Cash Return
3.5%
Cap rate
0.5%
Rent to Value Ratio
Active
$329,900
3
bds
|
3
ba
|
2,535
sqft
|
built
2005
2415 Brownwood Dr, Mulberry, FL 33860
$-564
Cash flow
-8.9%
Cash-on-Cash Return
4.1%
Cap rate
0.7%
Rent to Value Ratio
Active
$450,690
4
bds
|
3
ba
|
3,353
sqft
|
built
1979
34 Misty Meadow Ln, Mulberry, FL 33860
$-619
Cash flow
-7.2%
Cash-on-Cash Return
4.5%
Cap rate
0.6%
Rent to Value Ratio

Active
$850,000
3
bds
|
1
ba
|
1,376
sqft
|
built
1960
2020 State Road 37 S, Mulberry, FL 33860
$-2,989
Cash flow
-18.3%
Cash-on-Cash Return
1.9%
Cap rate
0.3%
Rent to Value Ratio

Active
$518,900
5
bds
|
3
ba
|
2,827
sqft
|
built
2022
149 St Thomas Dr, Mulberry, FL 33860
$-1,013
Cash flow
-10.2%
Cash-on-Cash Return
3.8%
Cap rate
0.6%
Rent to Value Ratio
Active
$525,000
3
bds
|
2
ba
|
2,354
sqft
|
built
1967
2220 2nd St, Mulberry, FL 33860
$-1,820
Cash flow
-18.1%
Cash-on-Cash Return
2.0%
Cap rate
0.3%
Rent to Value Ratio
Active
$750,000
4
bds
|
3
ba
|
3,713
sqft
|
built
2006
5118 Norriswood Dr, Mulberry, FL 33860
$-1,913
Cash flow
-13.3%
Cash-on-Cash Return
3.1%
Cap rate
0.5%
Rent to Value Ratio
Active
$383,500
3
bds
|
2
ba
|
1,705
sqft
|
built
1979
4210 Old Colony Rd, Mulberry, FL 33860
$-268
Cash flow
-3.6%
Cash-on-Cash Return
5.3%
Cap rate
0.8%
Rent to Value Ratio
Active
$388,000
4
bds
|
2
ba
|
2,002
sqft
|
built
2011
2712 Oak Hammock Loop, Mulberry, FL 33860
$-472
Cash flow
-6.3%
Cash-on-Cash Return
4.7%
Cap rate
0.6%
Rent to Value Ratio