Nolanville, TX Investment Properties for Sale
Browse homes for sale and investment properties in Nolanville, TX. Refine your search by price, property type, or more.
Best cash flowing properties in Nolanville, TX
Active
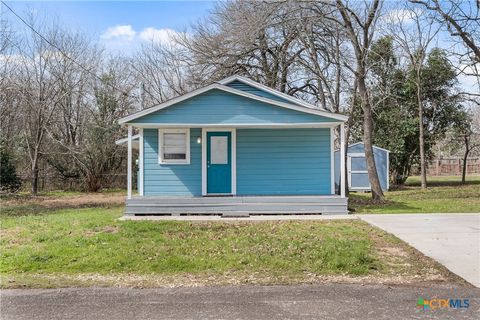
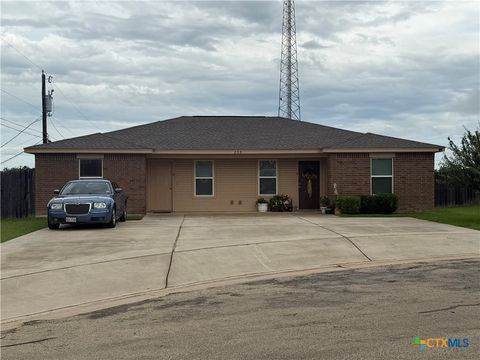
$120,000
2
bds
|
1
ba
|
880
sqft
|
built
1930
503 N Main St, Nolanville, TX 76559
$208
Cash flow
9.0%
Cash-on-Cash Return
7.8%
Cap rate
1.2%
Rent to Value Ratio
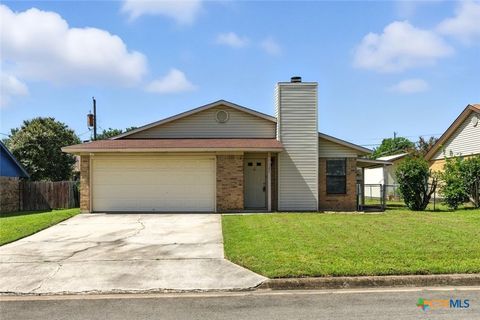
Active
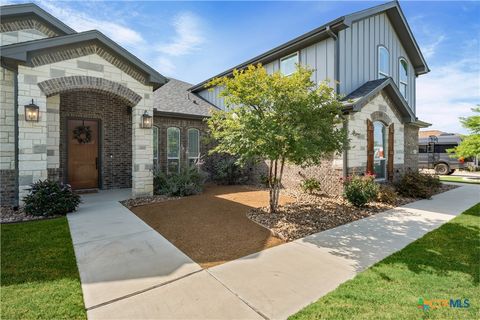
$194,900
3
bds
|
2
ba
|
1,128
sqft
|
built
1986
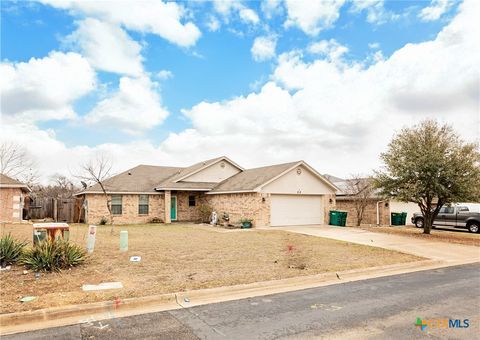
127 Jordan Loop, Nolanville, TX 76559
$-229
Cash flow
-6.1%
Cash-on-Cash Return
4.3%
Cap rate
0.7%
Rent to Value Ratio
26 out of 44 properties for sale in Nolanville, TX
Limited Results Shown
Create a free account, or log in to reveal all property listings and enjoy the complete experience.
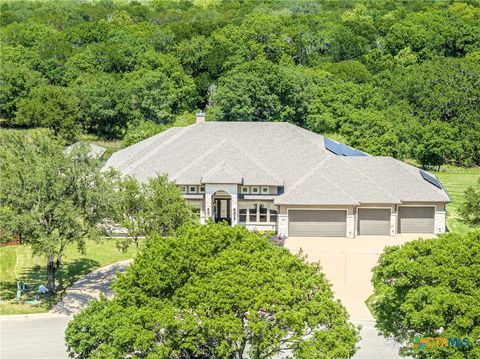
Active
$1,040,000
4
bds
|
5
ba
|
3,182
sqft
|
built
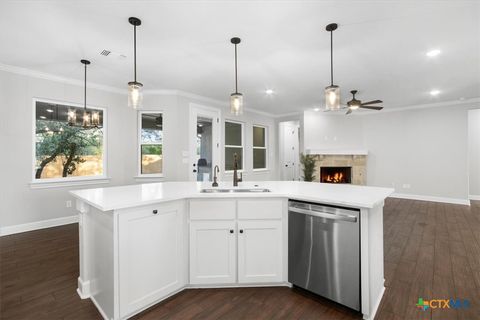
2021
4013 Turning Leaf Dr, Nolanville, TX 76559
$-4,384
Cash flow
-22.0%
Cash-on-Cash Return
0.6%
Cap rate
0.2%
Rent to Value Ratio
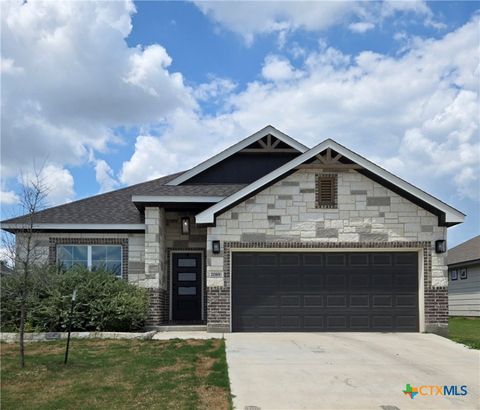
Active
$302,500
4
bds
|
2
ba
|
1,671
sqft
|
built
2023
2089 Mercer St, Nolanville, TX 76559
$-378
Cash flow
-6.5%
Cash-on-Cash Return
4.2%
Cap rate
0.7%
Rent to Value Ratio
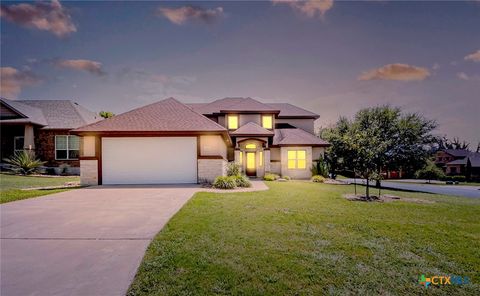
Active
$430,000
4
bds
|
3
ba
|
2,494
sqft
|
built
2010
3014 Bent Tree Dr, Nolanville, TX 76559
$-1,258
Cash flow
-15.3%
Cash-on-Cash Return
2.2%
Cap rate
0.5%
Rent to Value Ratio
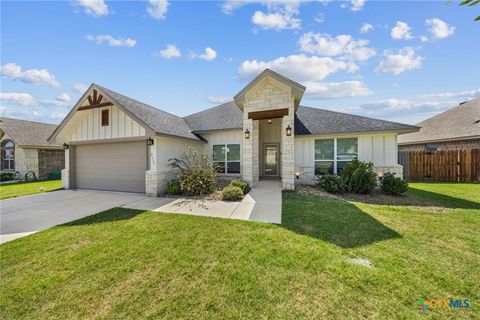
Active
$305,000
4
bds
|
2
ba
|
2,199
sqft
|
built
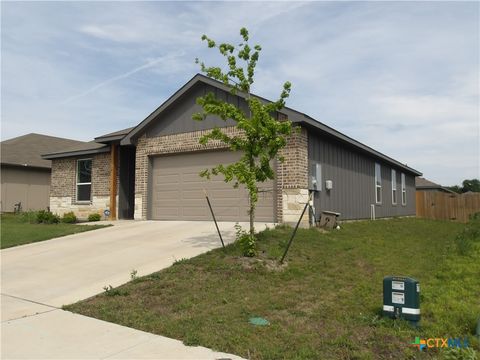
2022
770 Freedom Cir, Nolanville, TX 76559
$-293
Cash flow
-5.0%
Cash-on-Cash Return
4.5%
Cap rate
0.8%
Rent to Value Ratio
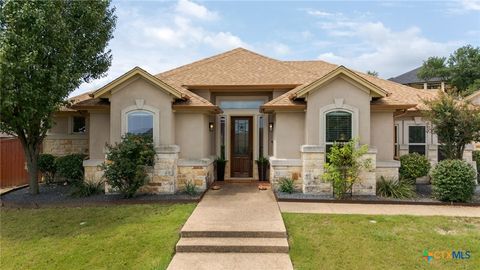
Active
$259,000
4
bds
|
2
ba
|
1,668
sqft
|
built
2005
112 Cedar Ridge Dr, Nolanville, TX 76559
$-431
Cash flow
-8.7%
Cash-on-Cash Return
3.7%
Cap rate
0.7%
Rent to Value Ratio
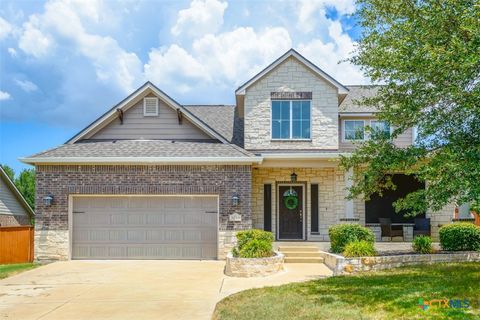
Active
$635,000
4
bds
|
3
ba
|
3,188
sqft
|
built
2023
914 High Plains Dr, Nolanville, TX 76559
$-1,615
Cash flow
-13.3%
Cash-on-Cash Return
2.6%
Cap rate
0.6%
Rent to Value Ratio
Active
$374,000
4
bds
|
3
ba
|
2,307
sqft
|
built
2015
3001 Bent Tree Dr, Nolanville, TX 76559
$-939
Cash flow
-13.1%
Cash-on-Cash Return
2.7%
Cap rate
0.6%
Rent to Value Ratio
Active
$399,000
4
bds
|
3
ba
|
2,233
sqft
|
built
2022
2117 Mercer St, Nolanville, TX 76559
$-539
Cash flow
-7.0%
Cash-on-Cash Return
4.1%
Cap rate
0.7%
Rent to Value Ratio
Active
$529,000
4
bds
|
3
ba
|
2,822
sqft
|
built
2008
1135 Redleaf Dr, Nolanville, TX 76559
$-1,524
Cash flow
-15.0%
Cash-on-Cash Return
2.2%
Cap rate
0.5%
Rent to Value Ratio
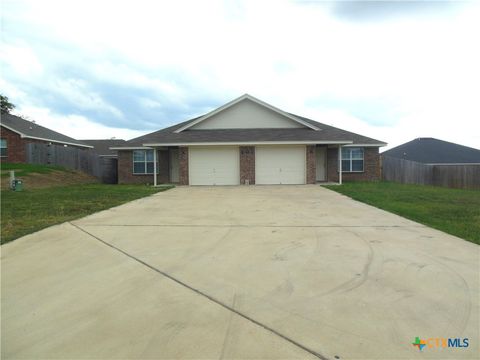
Active
$305,000
bds
|
0
ba
|
2,265
sqft
|
built
2007
403 W Dale Ave, Nolanville, TX 76559
$-1,077
Cash flow
-18.4%
Cash-on-Cash Return
1.4%
Cap rate
0.3%
Rent to Value Ratio
Active
$850,000
6
bds
|
4
ba
|
3,855
sqft
|
built
2019
2037 Heritage Loop, Nolanville, TX 76559
$-2,478
Cash flow
-15.2%
Cash-on-Cash Return
2.2%
Cap rate
0.4%
Rent to Value Ratio
Active
$277,000
3
bds
|
2
ba
|
1,572
sqft
|
built
2021
766 Freedom Cir, Nolanville, TX 76559
$-331
Cash flow
-6.2%
Cash-on-Cash Return
4.2%
Cap rate
0.7%
Rent to Value Ratio
Active
$269,000
4
bds
|
0
ba
|
1,790
sqft
|
built
2017
209 Ryan Cir, Nolanville, TX 76559
$-376
Cash flow
-7.3%
Cash-on-Cash Return
4.0%
Cap rate
0.5%
Rent to Value Ratio
Active
$520,000
3
bds
|
3
ba
|
2,258
sqft
|
built
2011
1127 Redleaf Dr, Nolanville, TX 76559
$-1,622
Cash flow
-16.3%
Cash-on-Cash Return
1.9%
Cap rate
0.4%
Rent to Value Ratio
Active
$320,000
4
bds
|
2
ba
|
2,034
sqft
|
built
2022
714 Freedom Cir, Nolanville, TX 76559
$-591
Cash flow
-9.6%
Cash-on-Cash Return
3.5%
Cap rate
0.6%
Rent to Value Ratio
Active
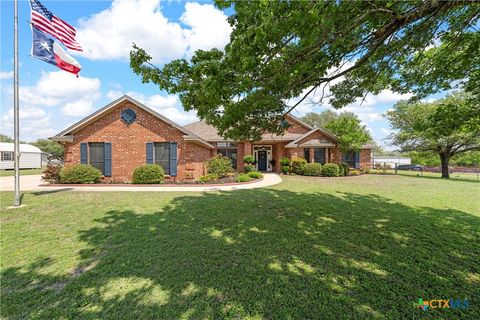
$885,000
5
bds
|
3
ba
|
2,818
sqft
|
built
1996
1250 Old Nolanville Rd, Nolanville, TX 76559
$-2,901
Cash flow
-17.1%
Cash-on-Cash Return
1.7%
Cap rate
0.4%
Rent to Value Ratio
Active
$250,000
4
bds
|
2
ba
|
1,901
sqft
|
built
2005
212 Oak Ridge Dr, Nolanville, TX 76559
$-360
Cash flow
-7.5%
Cash-on-Cash Return
4.0%
Cap rate
0.7%
Rent to Value Ratio
Active
$534,500
4
bds
|
3
ba
|
2,397
sqft
|
built
2024
4117 Turning Leaf Dr, Nolanville, TX 76559
$-597
Cash flow
-5.8%
Cash-on-Cash Return
4.3%
Cap rate
0.5%
Rent to Value Ratio
Active
$534,500
4
bds
|
3
ba
|
2,397
sqft
|
built
2024
4113 Turning Leaf Dr, Nolanville, TX 76559
$-528
Cash flow
-5.2%
Cash-on-Cash Return
4.5%
Cap rate
0.5%
Rent to Value Ratio
Active
$534,500
4
bds
|
3
ba
|
2,397
sqft
|
built
2024
4121 Turning Leaf Dr, Nolanville, TX 76559
$-390
Cash flow
-3.8%
Cash-on-Cash Return
4.8%
Cap rate
0.6%
Rent to Value Ratio
Active
$465,000
4
bds
|
3
ba
|
2,794
sqft
|
built
2008
8006 Ridgeway Ct, Nolanville, TX 76559
$-883
Cash flow
-9.9%
Cash-on-Cash Return
3.4%
Cap rate
0.6%
Rent to Value Ratio
Active
$449,977
4
bds
|
3
ba
|
2,153
sqft
|
built
2023
1014 Winchester Dr, Nolanville, TX 76559
$-237
Cash flow
-2.7%
Cash-on-Cash Return
5.0%
Cap rate
0.6%
Rent to Value Ratio
Active
$457,808
4
bds
|
3
ba
|
2,272
sqft
|
built
2023
1018 Winchester Dr, Nolanville, TX 76559
$-274
Cash flow
-3.1%
Cash-on-Cash Return
5.0%
Cap rate
0.6%
Rent to Value Ratio

Active
$451,000
4
bds
|
3
ba
|
2,168
sqft
|
built
2023
1027 Winchester Dr, Nolanville, TX 76559
$-242
Cash flow
-2.8%
Cash-on-Cash Return
5.0%
Cap rate
0.6%
Rent to Value Ratio