Woodland Park, CO Investment Properties for Sale
Browse homes for sale and investment properties in Woodland Park, CO. Refine your search by price, property type, or more.
Best cash flowing properties in Woodland Park, CO
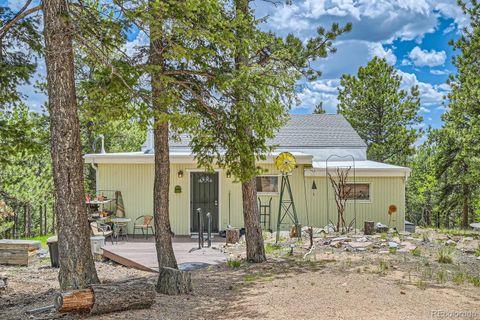
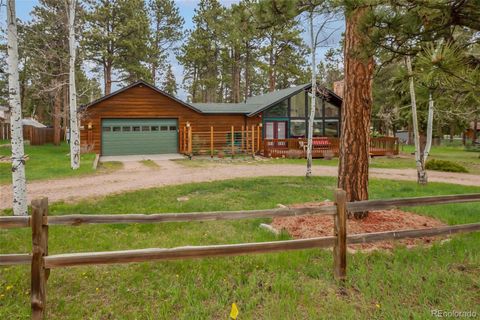
Active
$250,000
2
bds
|
1
ba
|
1,330
sqft
|
built
1960
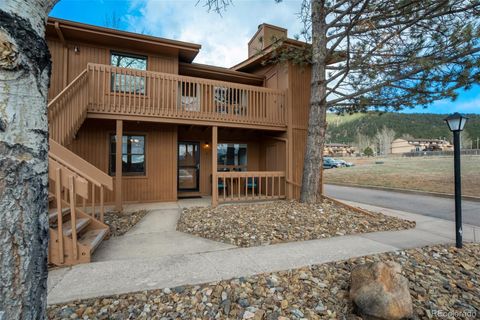
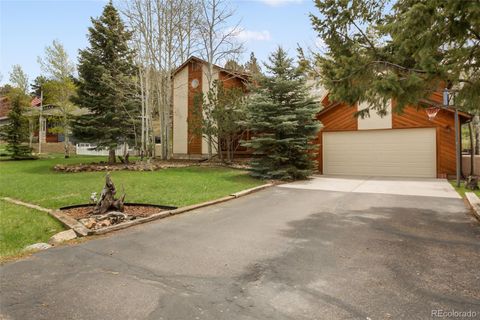
376 Gardenia Rd, Woodland Park, CO 80863
$239
Cash flow
5.0%
Cash-on-Cash Return
6.8%
Cap rate
0.9%
Rent to Value Ratio

Active
$250,000
2
bds
|
1
ba
|
728
sqft
|
built
1982
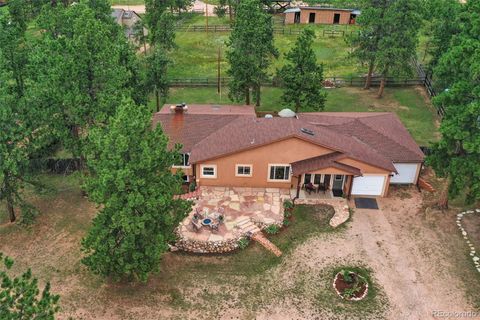
310 Blossom Rd, Woodland Park, CO 80863
$-85
Cash flow
-1.8%
Cash-on-Cash Return
5.3%
Cap rate
0.6%
Rent to Value Ratio
60 out of 63 properties for sale in Woodland Park, CO
Limited Results Shown
Create a free account, or log in to reveal all property listings and enjoy the complete experience.

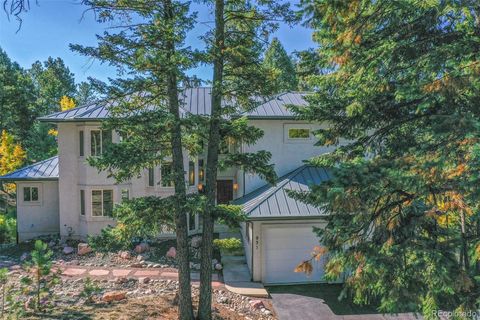
Active
$415,000
2
bds
|
2
ba
|
1,188
sqft
|
built
2008
399 Gardenia Rd, Woodland Park, CO 80863
$-695
Cash flow
-8.7%
Cash-on-Cash Return
4.3%
Cap rate
0.6%
Rent to Value Ratio
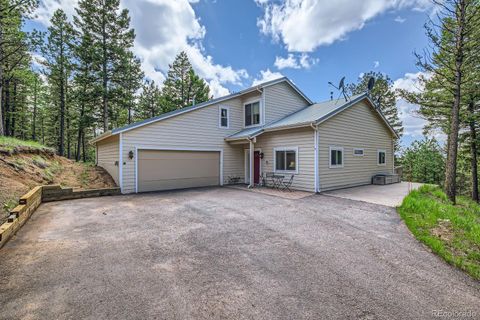
Active
$425,000
2
bds
|
0
ba
|
816
sqft
|
built
2002
429 Gentian Rd, Woodland Park, CO 80863
$-795
Cash flow
-9.8%
Cash-on-Cash Return
4.0%
Cap rate
0.5%
Rent to Value Ratio

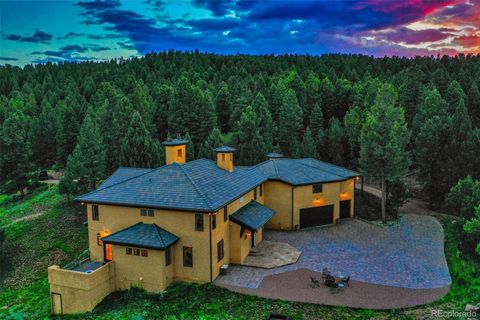
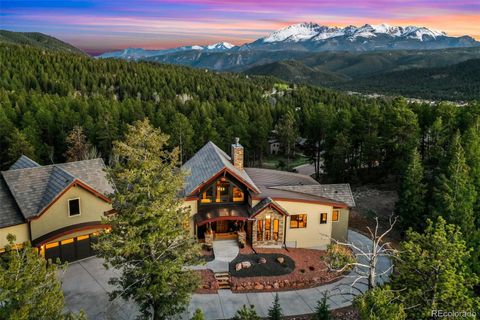
Active
$2,248,000
4
bds
|
2
ba
|
4,852
sqft
|
built
1980
2120 Lee Circle Dr, Woodland Park, CO 80863
$-9,222
Cash flow
-21.4%
Cash-on-Cash Return
1.3%
Cap rate
0.2%
Rent to Value Ratio

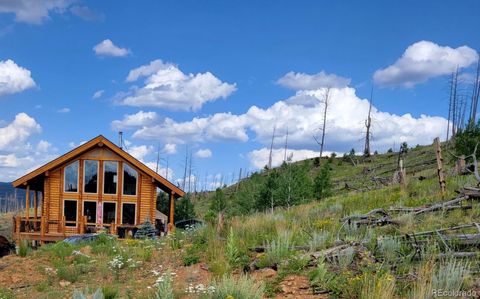
Active
$1,189,000
5
bds
|
6
ba
|
6,523
sqft
|
built
1996
725 Sun Valley Dr, Woodland Park, CO 80863
$-3,964
Cash flow
-17.4%
Cash-on-Cash Return
2.3%
Cap rate
0.3%
Rent to Value Ratio

Active
$535,000
3
bds
|
3
ba
|
2,118
sqft
|
built
2002
310 Evergreen St, Woodland Park, CO 80863
$-1,284
Cash flow
-12.5%
Cash-on-Cash Return
3.4%
Cap rate
0.5%
Rent to Value Ratio
Active
$1,075,000
3
bds
|
3
ba
|
2,734
sqft
|
built
2001
11690 Rampart Range Rd, Woodland Park, CO 80863
$-3,201
Cash flow
-15.5%
Cash-on-Cash Return
2.7%
Cap rate
0.4%
Rent to Value Ratio

Active
$650,000
4
bds
|
3
ba
|
2,360
sqft
|
built
1977
2169 Spruce Rd, Woodland Park, CO 80863
$-1,766
Cash flow
-14.2%
Cash-on-Cash Return
3.0%
Cap rate
0.4%
Rent to Value Ratio
Active
$505,000
4
bds
|
2
ba
|
1,868
sqft
|
built
1974
418 N Baldwin St, Woodland Park, CO 80863
$-1,634
Cash flow
-16.9%
Cash-on-Cash Return
2.4%
Cap rate
0.3%
Rent to Value Ratio
Active
$599,900
3
bds
|
2
ba
|
1,092
sqft
|
built
1971
500 W Kelly Rd, Woodland Park, CO 80863
$-1,522
Cash flow
-13.2%
Cash-on-Cash Return
3.2%
Cap rate
0.4%
Rent to Value Ratio

Active
$295,550
1
bds
|
1
ba
|
672
sqft
|
built
2002
345 Klitowya Trl, Woodland Park, CO 80863
$-390
Cash flow
-6.9%
Cash-on-Cash Return
4.7%
Cap rate
0.6%
Rent to Value Ratio
Active
$850,000
3
bds
|
4
ba
|
3,784
sqft
|
built
2003
931 Heather Ct, Woodland Park, CO 80863
$-1,607
Cash flow
-9.9%
Cash-on-Cash Return
4.0%
Cap rate
0.5%
Rent to Value Ratio
Active
$550,000
3
bds
|
2
ba
|
2,160
sqft
|
built
1994
2206 Spruce Rd, Woodland Park, CO 80863
$-1,086
Cash flow
-10.3%
Cash-on-Cash Return
3.9%
Cap rate
0.5%
Rent to Value Ratio
Active
$744,900
3
bds
|
2
ba
|
1,595
sqft
|
built
2019
14077 S State Highway 67, Woodland Park, CO 80863
$-1,716
Cash flow
-12.0%
Cash-on-Cash Return
3.5%
Cap rate
0.5%
Rent to Value Ratio
Active
$289,900
2
bds
|
0
ba
|
1,012
sqft
|
built
1981
401 Forest Edge Rd, Woodland Park, CO 80863
$-733
Cash flow
-13.2%
Cash-on-Cash Return
3.2%
Cap rate
0.6%
Rent to Value Ratio
Active
$510,000
3
bds
|
2
ba
|
1,786
sqft
|
built
1996
411 W Bowman Ave, Woodland Park, CO 80863
$-1,099
Cash flow
-11.2%
Cash-on-Cash Return
3.7%
Cap rate
0.5%
Rent to Value Ratio
Active
$620,000
4
bds
|
4
ba
|
2,208
sqft
|
built
1983
900 Ponderosa Way, Woodland Park, CO 80863
$-1,570
Cash flow
-13.2%
Cash-on-Cash Return
3.2%
Cap rate
0.5%
Rent to Value Ratio
Active
$230,000
2
bds
|
2
ba
|
1,012
sqft
|
built
1981
401 Forest Edge Rd, Woodland Park, CO 80863
$-443
Cash flow
-10.0%
Cash-on-Cash Return
4.0%
Cap rate
0.7%
Rent to Value Ratio
Active
$2,999,900
6
bds
|
8
ba
|
9,097
sqft
|
built
2004
419 Lucky Lady Dr, Woodland Park, CO 80863
$-13,077
Cash flow
-22.7%
Cash-on-Cash Return
1.0%
Cap rate
0.2%
Rent to Value Ratio

Active
$750,000
3
bds
|
3
ba
|
2,141
sqft
|
built
1990
2601 Vista Glen Ct, Woodland Park, CO 80863
$-1,950
Cash flow
-13.6%
Cash-on-Cash Return
3.1%
Cap rate
0.4%
Rent to Value Ratio
Active
$495,000
3
bds
|
2
ba
|
1,832
sqft
|
built
1957
150 Apache Trl, Woodland Park, CO 80863
$-879
Cash flow
-9.3%
Cash-on-Cash Return
4.1%
Cap rate
0.5%
Rent to Value Ratio
Active
$355,000
2
bds
|
2
ba
|
1,500
sqft
|
built
1985
590 Greenway Ct, Woodland Park, CO 80863
$-980
Cash flow
-14.4%
Cash-on-Cash Return
3.0%
Cap rate
0.6%
Rent to Value Ratio
Active
$519,000
3
bds
|
2
ba
|
1,778
sqft
|
built
2003
635 Wakanda Trl, Woodland Park, CO 80863
$-1,151
Cash flow
-11.6%
Cash-on-Cash Return
3.6%
Cap rate
0.5%
Rent to Value Ratio
Active
$2,250,000
4
bds
|
6
ba
|
5,143
sqft
|
built
2016
290 Thunder Ridge Dr, Woodland Park, CO 80863
$-10,186
Cash flow
-23.6%
Cash-on-Cash Return
0.8%
Cap rate
0.2%
Rent to Value Ratio
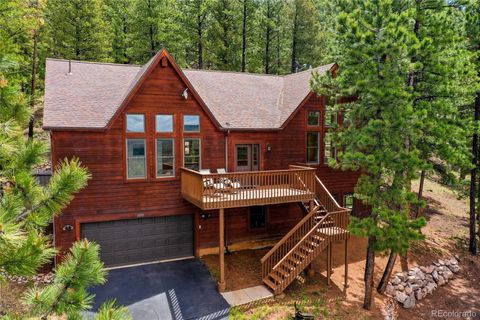
Active
$775,000
3
bds
|
3
ba
|
3,306
sqft
|
built
1996
1321 Forest Edge Rd, Woodland Park, CO 80863
$-2,068
Cash flow
-13.9%
Cash-on-Cash Return
3.1%
Cap rate
0.4%
Rent to Value Ratio
Active
$789,000
3
bds
|
3
ba
|
3,486
sqft
|
built
1998
319 Summit Rd, Woodland Park, CO 80863
$-2,007
Cash flow
-13.3%
Cash-on-Cash Return
3.2%
Cap rate
0.4%
Rent to Value Ratio
Active
$499,900
3
bds
|
2
ba
|
1,632
sqft
|
built
1977
1321 W Midland Ave, Woodland Park, CO 80863
$-1,250
Cash flow
-13.0%
Cash-on-Cash Return
3.3%
Cap rate
0.4%
Rent to Value Ratio
Active
$2,395,000
4
bds
|
5
ba
|
4,984
sqft
|
built
2013
201 Fox Mountain Dr, Woodland Park, CO 80863
$-9,688
Cash flow
-21.1%
Cash-on-Cash Return
1.4%
Cap rate
0.2%
Rent to Value Ratio
Active
$1,250,000
3
bds
|
3
ba
|
3,415
sqft
|
built
1999
111 E Lovell Gulch Rd, Woodland Park, CO 80863
$-4,092
Cash flow
-17.1%
Cash-on-Cash Return
2.3%
Cap rate
0.3%
Rent to Value Ratio
Active
$779,900
4
bds
|
2
ba
|
2,496
sqft
|
built
2020
1378 Millstone Ln, Woodland Park, CO 80863
$-1,605
Cash flow
-10.7%
Cash-on-Cash Return
3.2%
Cap rate
0.4%
Rent to Value Ratio
Active
$650,000
3
bds
|
2
ba
|
2,000
sqft
|
built
2017
1136 Ptarmigan Dr, Woodland Park, CO 80863
$-1,745
Cash flow
-14.0%
Cash-on-Cash Return
3.0%
Cap rate
0.4%
Rent to Value Ratio
Active
$625,000
3
bds
|
2
ba
|
1,803
sqft
|
built
1986
1955 Valley View Dr, Woodland Park, CO 80863
$-1,594
Cash flow
-13.3%
Cash-on-Cash Return
3.2%
Cap rate
0.4%
Rent to Value Ratio

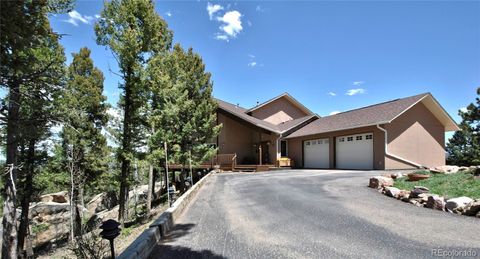
Active
$465,000
3
bds
|
3
ba
|
2,163
sqft
|
built
1979
720 Northwoods Dr W, Woodland Park, CO 80863
$-884
Cash flow
-9.9%
Cash-on-Cash Return
4.0%
Cap rate
0.5%
Rent to Value Ratio

Active
$500,000
4
bds
|
2
ba
|
2,170
sqft
|
built
1985
120 Red Rock Ct, Woodland Park, CO 80863
$-1,020
Cash flow
-10.6%
Cash-on-Cash Return
3.8%
Cap rate
0.5%
Rent to Value Ratio

Active
$830,000
4
bds
|
3
ba
|
3,051
sqft
|
built
1997
1321 Masters Dr, Woodland Park, CO 80863
$-1,832
Cash flow
-11.5%
Cash-on-Cash Return
3.6%
Cap rate
0.5%
Rent to Value Ratio
Active
$729,900
4
bds
|
3
ba
|
2,876
sqft
|
built
1980
120 Blue Sky Ave, Woodland Park, CO 80863
$-1,856
Cash flow
-13.3%
Cash-on-Cash Return
3.2%
Cap rate
0.4%
Rent to Value Ratio

Active
$498,500
3
bds
|
3
ba
|
2,041
sqft
|
built
1973
95 Club Dr, Woodland Park, CO 80863
$-777
Cash flow
-8.1%
Cash-on-Cash Return
4.4%
Cap rate
0.6%
Rent to Value Ratio

Active
$570,000
3
bds
|
2
ba
|
1,428
sqft
|
built
1985
1300 Thomas Cir, Woodland Park, CO 80863
$-1,357
Cash flow
-12.4%
Cash-on-Cash Return
3.4%
Cap rate
0.5%
Rent to Value Ratio

Active
$695,000
3
bds
|
4
ba
|
3,883
sqft
|
built
2000
352 Gray Horse Cir, Woodland Park, CO 80863
$-1,151
Cash flow
-8.6%
Cash-on-Cash Return
4.3%
Cap rate
0.6%
Rent to Value Ratio