Jackson County Investment Properties for Sale
Browse homes for sale and investment properties in Jackson County. Refine your search by price, property type, or more.
Best cash flowing properties in Jackson County
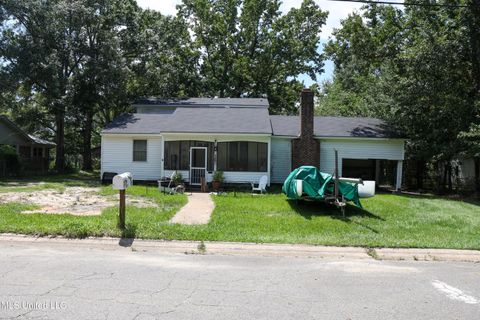
Active
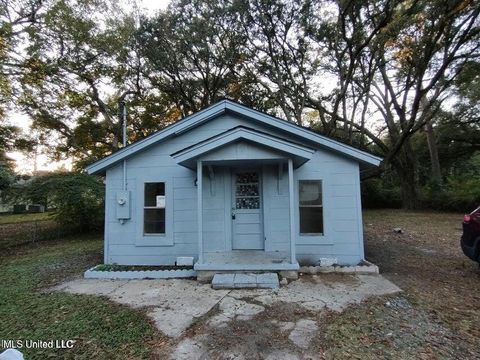
$59,900
3
bds
|
1
ba
|
0
sqft
|
built
1959
4607 Briggs St, Moss Point, MS 39563
$577
Cash flow
11.2%
Cash-on-Cash Return
11.6%
Cap rate
1.5%
Rent to Value Ratio
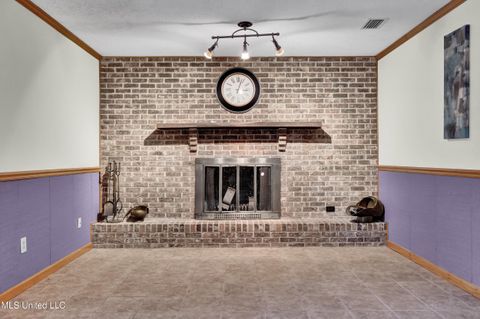
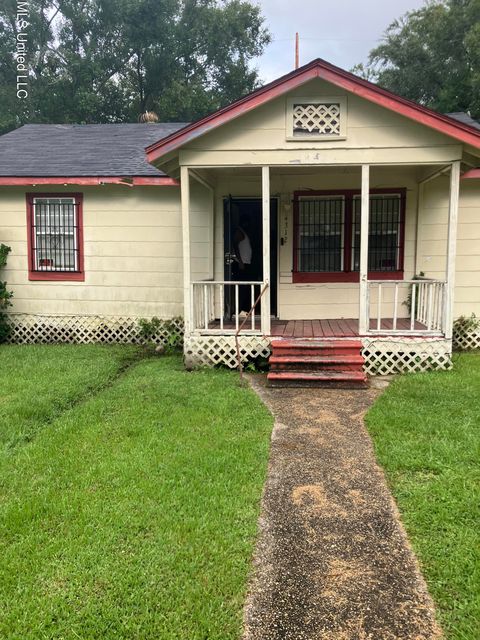
Active
$170,000
3
bds
|
2
ba
|
0
sqft
|
built
1973
2413 Northridge Dr, Gautier, MS 39553
$557
Cash flow
17.1%
Cash-on-Cash Return
9.6%
Cap rate
1.2%
Rent to Value Ratio
244 out of 263 properties for sale in Jackson County
Limited Results Shown
Create a free account, or log in to reveal all property listings and enjoy the complete experience.
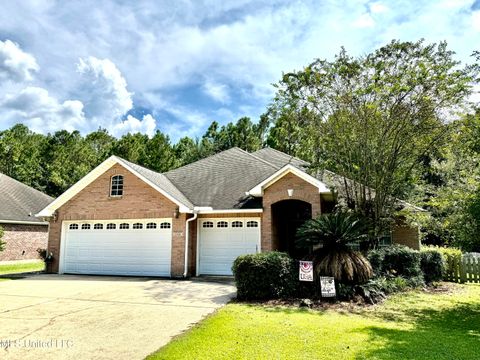
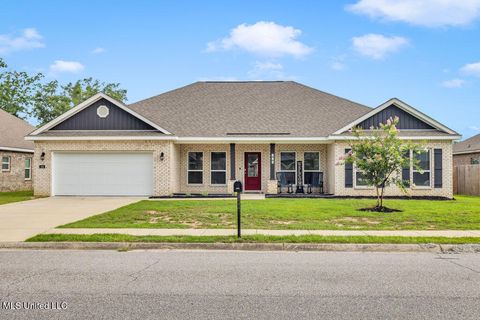
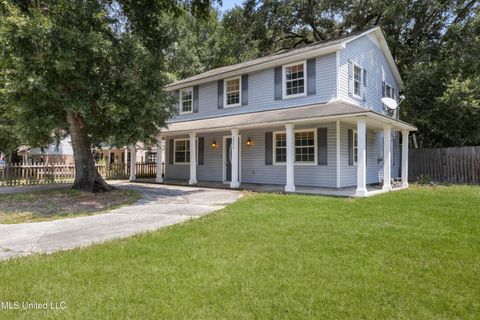
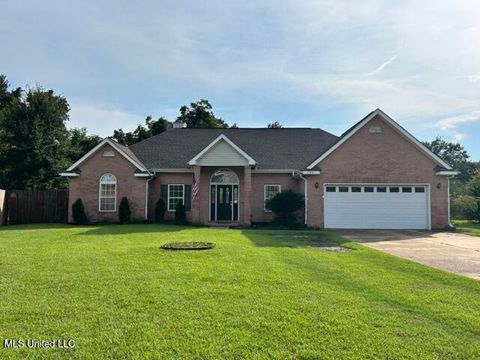
Active
$339,500
4
bds
|
3
ba
|
0
sqft
|
built
2004
1709 Fairway Dr, Gautier, MS 39553
$-156
Cash flow
-2.4%
Cash-on-Cash Return
5.1%
Cap rate
0.7%
Rent to Value Ratio

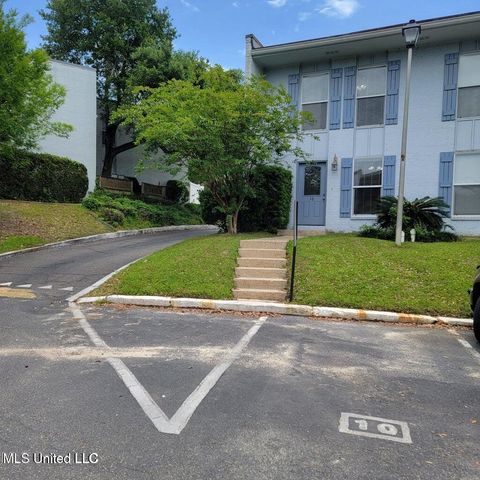
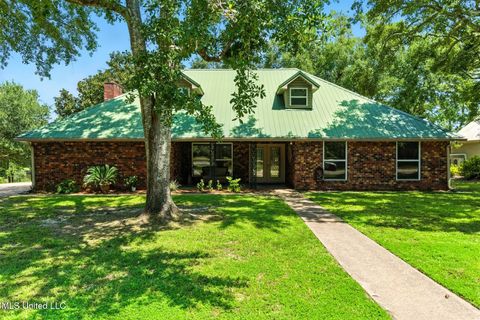
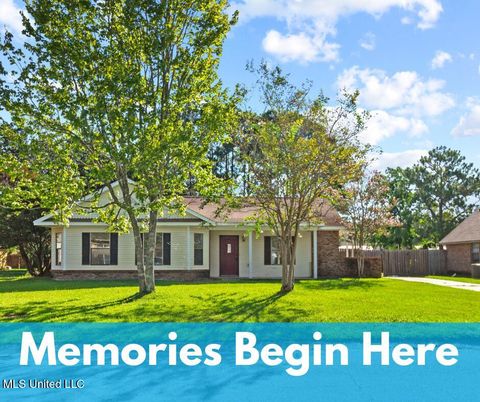
Active
$225,000
4
bds
|
3
ba
|
0
sqft
|
built
2005
4319 Adcock St, Moss Point, MS 39563
$140
Cash flow
3.2%
Cash-on-Cash Return
6.4%
Cap rate
0.8%
Rent to Value Ratio
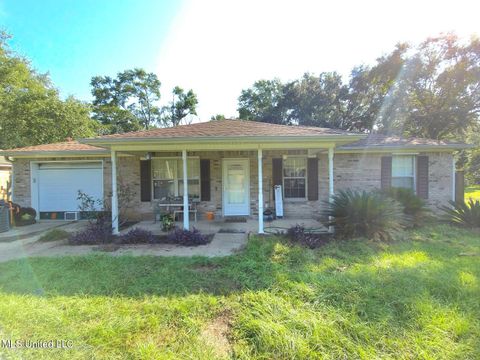
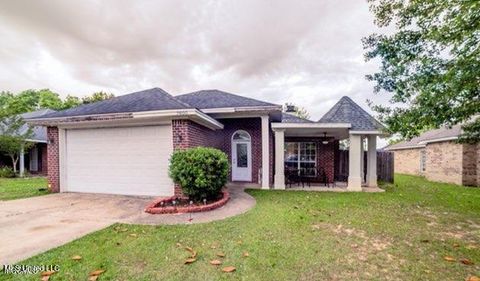
Active
$138,000
2
bds
|
2
ba
|
0
sqft
|
built
1972
3230 Cumberland Rd, Ocean Springs, MS 39564
$190
Cash flow
7.2%
Cash-on-Cash Return
7.3%
Cap rate
1.0%
Rent to Value Ratio

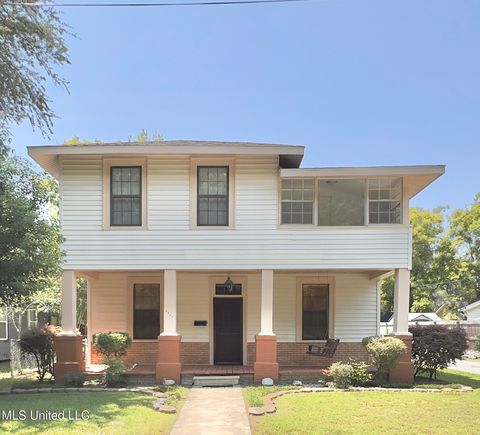
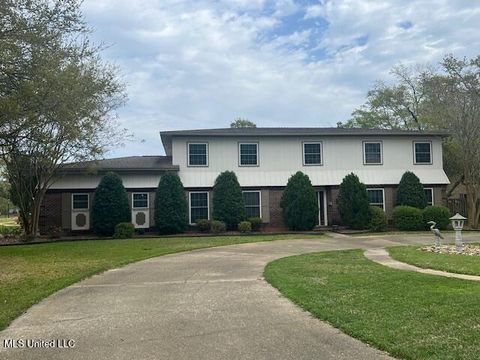
Active
$549,000
1
bds
|
2
ba
|
0
sqft
|
built
1908
1306 Bowen Ave, Ocean Springs, MS 39564
$-851
Cash flow
-8.1%
Cash-on-Cash Return
3.8%
Cap rate
0.5%
Rent to Value Ratio
Active
$369,500
4
bds
|
3
ba
|
0
sqft
|
built
2022
124 Oyster Catcher Cv, Ocean Springs, MS 39564
$-77
Cash flow
-1.1%
Cash-on-Cash Return
5.4%
Cap rate
0.8%
Rent to Value Ratio
Active
$435,000
4
bds
|
3
ba
|
0
sqft
|
built
2022
12265 Savannah Cir, Ocean Springs, MS 39564
$-423
Cash flow
-5.1%
Cash-on-Cash Return
4.5%
Cap rate
0.7%
Rent to Value Ratio
Active
$180,000
3
bds
|
2
ba
|
0
sqft
|
built
1997
808 Orange St, Ocean Springs, MS 39564
$131
Cash flow
3.8%
Cash-on-Cash Return
6.6%
Cap rate
0.9%
Rent to Value Ratio

Active
$92,000
2
bds
|
2
ba
|
0
sqft
|
built
1999
5080 Gautier Vancleave Rd, Gautier, MS 39553
$406
Cash flow
23.0%
Cash-on-Cash Return
11.0%
Cap rate
2.0%
Rent to Value Ratio
Active
$220,000
4
bds
|
2
ba
|
0
sqft
|
built
1914
1603 Roosevelt St, Pascagoula, MS 39567
$317
Cash flow
7.5%
Cash-on-Cash Return
7.4%
Cap rate
0.9%
Rent to Value Ratio
Active
$685,000
4
bds
|
3
ba
|
0
sqft
|
built
1977
110 Simon Blvd, Ocean Springs, MS 39564
$-1,165
Cash flow
-8.9%
Cash-on-Cash Return
3.6%
Cap rate
0.5%
Rent to Value Ratio
Active
$649,700
4
bds
|
3
ba
|
0
sqft
|
built
2006
24000 Robert E Lee Rd, Lucedale, MS 39452
$-1,325
Cash flow
-10.6%
Cash-on-Cash Return
3.2%
Cap rate
0.4%
Rent to Value Ratio
Active
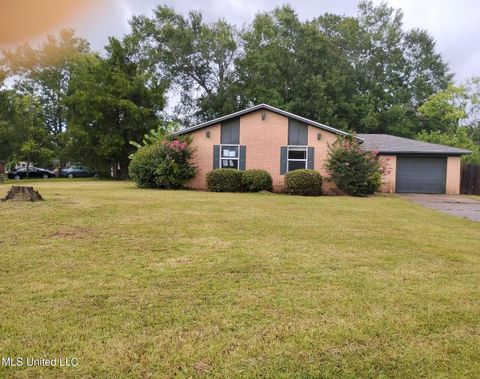
$199,900
3
bds
|
1
ba
|
0
sqft
|
built
1975
2104 Victoria Dr, Gautier, MS 39553
$28
Cash flow
0.7%
Cash-on-Cash Return
5.8%
Cap rate
0.8%
Rent to Value Ratio
Active
$312,500
4
bds
|
3
ba
|
0
sqft
|
built
2002
26 Lakeview Dr, Ocean Springs, MS 39564
$-182
Cash flow
-3.0%
Cash-on-Cash Return
5.0%
Cap rate
0.7%
Rent to Value Ratio
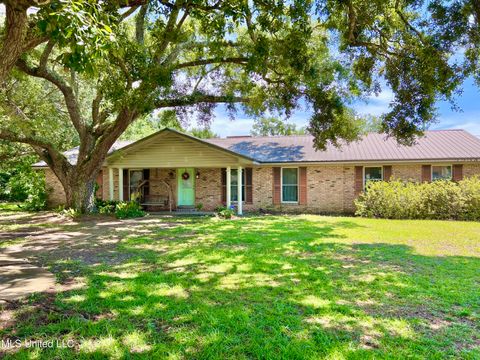
Active
$185,000
3
bds
|
3
ba
|
0
sqft
|
built
1952
4861 Devon St, Moss Point, MS 39563
$314
Cash flow
8.9%
Cash-on-Cash Return
7.7%
Cap rate
1.0%
Rent to Value Ratio
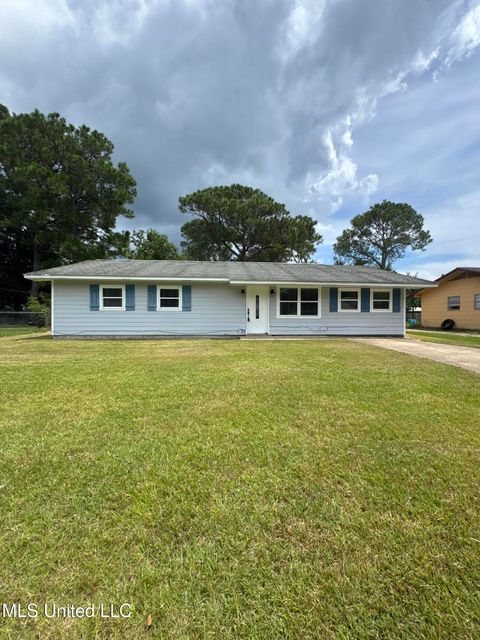
Active
$84,900
3
bds
|
2
ba
|
0
sqft
|
built
1950
4312 Charles St, Moss Point, MS 39563
$478
Cash flow
29.4%
Cash-on-Cash Return
12.4%
Cap rate
1.6%
Rent to Value Ratio
Active
$259,000
4
bds
|
3
ba
|
0
sqft
|
built
1993
2804 Beachview Dr, Ocean Springs, MS 39564
$209
Cash flow
4.2%
Cash-on-Cash Return
6.6%
Cap rate
0.8%
Rent to Value Ratio

Active
$269,900
4
bds
|
3
ba
|
0
sqft
|
built
1993
10100 Iroquois Ave, Ocean Springs, MS 39564
$49
Cash flow
0.9%
Cash-on-Cash Return
5.9%
Cap rate
0.7%
Rent to Value Ratio
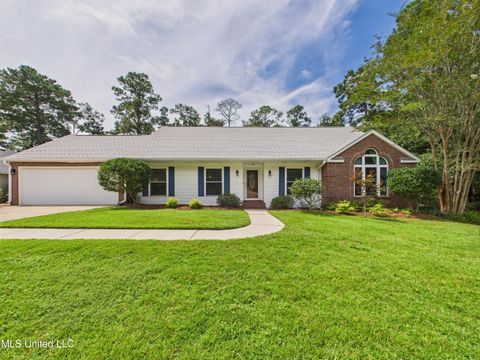
Active
$434,900
4
bds
|
3
ba
|
0
sqft
|
built
1977
1526 Oldfield Dr, Gautier, MS 39553
$-649
Cash flow
-7.8%
Cash-on-Cash Return
3.9%
Cap rate
0.5%
Rent to Value Ratio
Active
$498,500
2
bds
|
2
ba
|
0
sqft
|
built
2008
922 Porter Ave, Ocean Springs, MS 39564
$-1,720
Cash flow
-18.0%
Cash-on-Cash Return
1.5%
Cap rate
0.5%
Rent to Value Ratio

Active
$479,900
4
bds
|
4
ba
|
0
sqft
|
built
2018
1205 Jean Ln, Ocean Springs, MS 39564
$-750
Cash flow
-8.2%
Cash-on-Cash Return
3.8%
Cap rate
0.5%
Rent to Value Ratio
Active
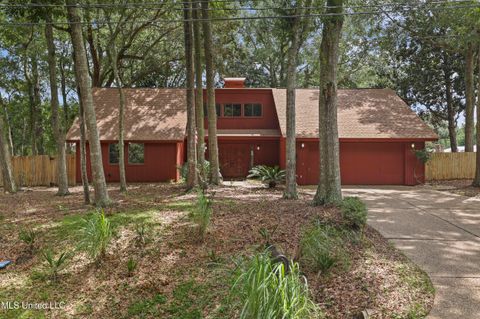
$265,000
3
bds
|
3
ba
|
0
sqft
|
built
1975
6709 Caraway Rd, Moss Point, MS 39562
$-180
Cash flow
-3.5%
Cash-on-Cash Return
4.9%
Cap rate
0.6%
Rent to Value Ratio
Active
$699,000
5
bds
|
6
ba
|
0
sqft
|
built
1985
3712 Townsend Rd, Gautier, MS 39553
$-1,818
Cash flow
-13.6%
Cash-on-Cash Return
2.6%
Cap rate
0.5%
Rent to Value Ratio
Active
$989,000
4
bds
|
3
ba
|
0
sqft
|
built
1951
1210 Harbor Rd, Ocean Springs, MS 39564
$-2,076
Cash flow
-11.0%
Cash-on-Cash Return
3.2%
Cap rate
0.5%
Rent to Value Ratio
Active
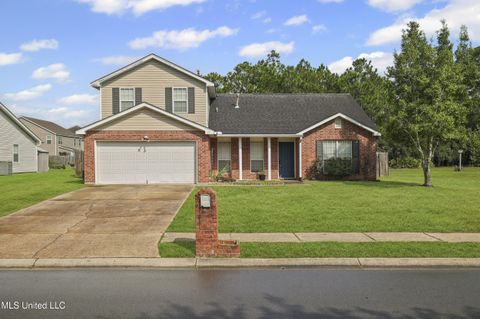
$284,900
4
bds
|
3
ba
|
0
sqft
|
built
2003
7921 Rue Madison, Ocean Springs, MS 39564
$377
Cash flow
6.9%
Cash-on-Cash Return
7.3%
Cap rate
0.9%
Rent to Value Ratio
Active
$225,000
3
bds
|
2
ba
|
0
sqft
|
built
1986
5316 Culeoka Dr, Ocean Springs, MS 39564
$74
Cash flow
1.7%
Cash-on-Cash Return
6.1%
Cap rate
0.8%
Rent to Value Ratio
Active
$219,000
3
bds
|
2
ba
|
0
sqft
|
built
2005
7400 Southwind Dr, Biloxi, MS 39532
$388
Cash flow
9.2%
Cash-on-Cash Return
7.8%
Cap rate
1.0%
Rent to Value Ratio

Active
$260,000
4
bds
|
2
ba
|
0
sqft
|
built
1973
1412 Cotita Dr, Gautier, MS 39553
$30
Cash flow
0.6%
Cash-on-Cash Return
5.8%
Cap rate
0.8%
Rent to Value Ratio

Active
$174,900
3
bds
|
3
ba
|
0
sqft
|
built
1980
2208 Briargate Dr, Gautier, MS 39553
$34
Cash flow
1.0%
Cash-on-Cash Return
5.9%
Cap rate
0.8%
Rent to Value Ratio
Active
$399,900
5
bds
|
4
ba
|
0
sqft
|
built
1969
712 Eastwood St, Pascagoula, MS 39567
$-325
Cash flow
-4.2%
Cash-on-Cash Return
4.7%
Cap rate
0.6%
Rent to Value Ratio
Active
$235,000
3
bds
|
2
ba
|
0
sqft
|
built
1969
7904 Point Aux Chenes Rd, Ocean Springs, MS 39564
$-591
Cash flow
-13.1%
Cash-on-Cash Return
2.7%
Cap rate
0.9%
Rent to Value Ratio
Active
$185,000
4
bds
|
3
ba
|
0
sqft
|
built
1969
6608 Columbus Cir, Ocean Springs, MS 39564
$114
Cash flow
3.2%
Cash-on-Cash Return
6.4%
Cap rate
0.9%
Rent to Value Ratio
Active
$385,000
4
bds
|
2
ba
|
0
sqft
|
built
1994
3620 Portree Pl, Ocean Springs, MS 39564
$-97
Cash flow
-1.3%
Cash-on-Cash Return
5.4%
Cap rate
0.6%
Rent to Value Ratio
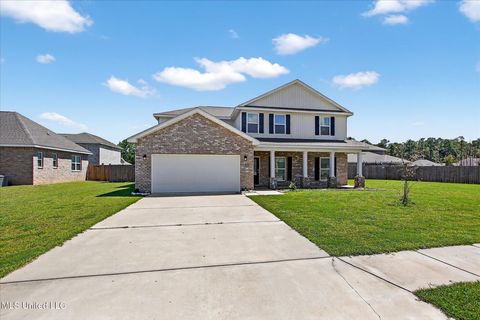
Active
$385,000
5
bds
|
3
ba
|
0
sqft
|
built
2022
12210 Savannah Cir, Ocean Springs, MS 39564
$-302
Cash flow
-4.1%
Cash-on-Cash Return
4.7%
Cap rate
0.7%
Rent to Value Ratio
Active
$719,000
3
bds
|
3
ba
|
0
sqft
|
built
2023
7420 Old Fort Bayou Rd, Ocean Springs, MS 39564
$-2,059
Cash flow
-14.9%
Cash-on-Cash Return
2.2%
Cap rate
0.4%
Rent to Value Ratio

Active
$305,000
4
bds
|
2
ba
|
0
sqft
|
built
2023
84 Saltmeadow Cir, Ocean Springs, MS 39564
$12
Cash flow
0.2%
Cash-on-Cash Return
5.7%
Cap rate
0.8%
Rent to Value Ratio
Active
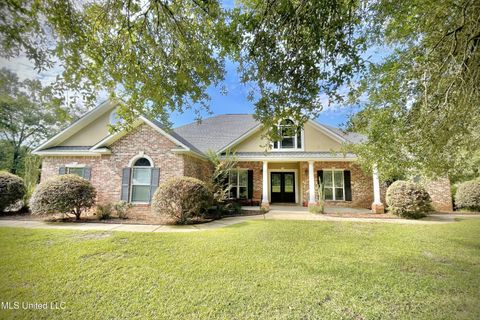
$514,900
4
bds
|
3
ba
|
0
sqft
|
built
1996
23117 Hinton Rd, Lucedale, MS 39452
$-884
Cash flow
-9.0%
Cash-on-Cash Return
3.6%
Cap rate
0.5%
Rent to Value Ratio
Active
$259,999
5
bds
|
3
ba
|
0
sqft
|
built
2007
2829 Villa Venezia Ct, Ocean Springs, MS 39564
$270
Cash flow
5.4%
Cash-on-Cash Return
6.9%
Cap rate
0.9%
Rent to Value Ratio

Active
$239,000
3
bds
|
3
ba
|
0
sqft
|
built
2022
2409 Esplanade St, Ocean Springs, MS 39564
$101
Cash flow
2.2%
Cash-on-Cash Return
6.2%
Cap rate
0.9%
Rent to Value Ratio