Oakland County Investment Properties for Sale
Browse homes for sale and investment properties in Oakland County. Refine your search by price, property type, or more.
Best cash flowing properties in Oakland County
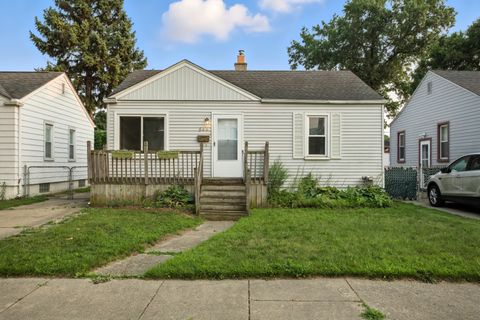
Active
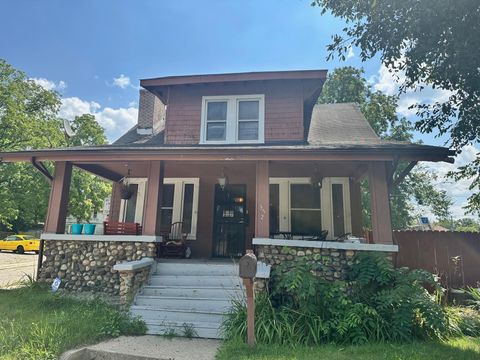
$95,000
3
bds
|
1
ba
|
1,344
sqft
|
built
1920
352 N Perry St, Pontiac, MI 48342
$563
Cash flow
30.9%
Cash-on-Cash Return
13.3%
Cap rate
1.7%
Rent to Value Ratio
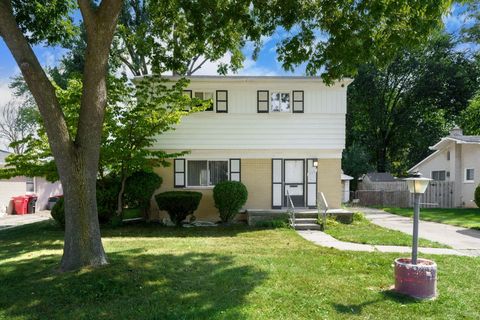
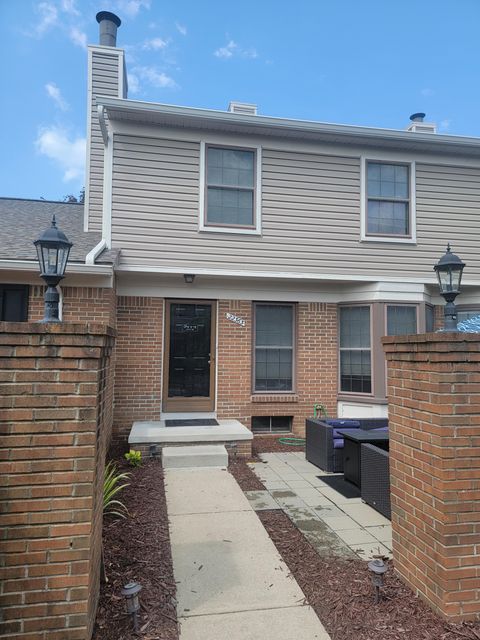
Active
$184,900
4
bds
|
1
ba
|
1,138
sqft
|
built
1941
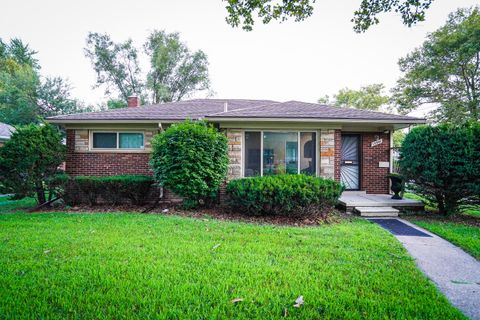
21208 Poinciana St, Southfield, MI 48033
$190
Cash flow
5.4%
Cash-on-Cash Return
7.4%
Cap rate
1.0%
Rent to Value Ratio
65 out of 83 properties for sale in Oakland County
Limited Results Shown
Create a free account, or log in to reveal all property listings and enjoy the complete experience.

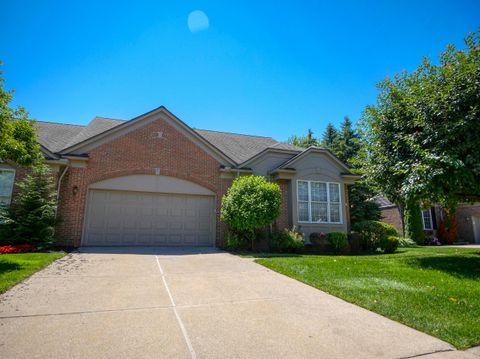
Active
$499,000
4
bds
|
4
ba
|
3,935
sqft
|
built
1954
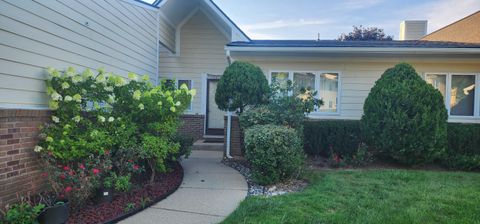
30070 Lochmoor St, Farmington Hills, MI 48334
$-1,266
Cash flow
-13.2%
Cash-on-Cash Return
3.1%
Cap rate
0.5%
Rent to Value Ratio

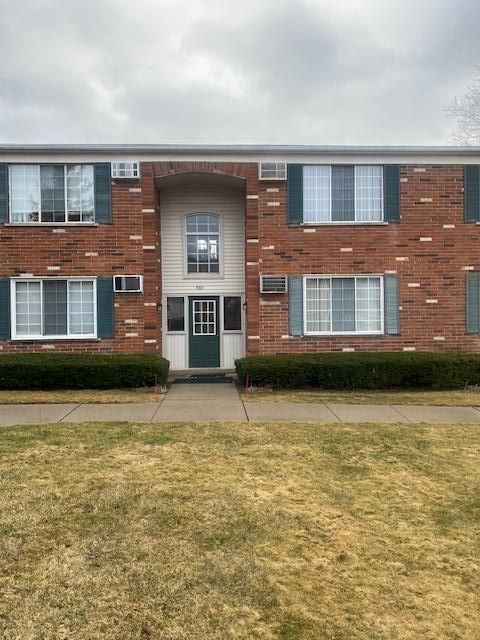
Active
$77,000
1
bds
|
1
ba
|
490
sqft
|
built
1964
31831 Grand River Ave, Farmington, MI 48336
$-176
Cash flow
-11.9%
Cash-on-Cash Return
3.4%
Cap rate
1.2%
Rent to Value Ratio

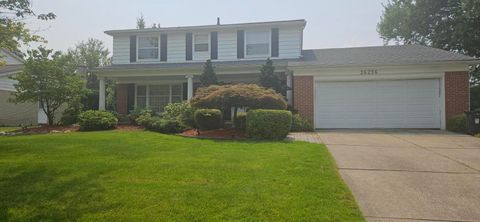
Active
$600,000
4
bds
|
3
ba
|
2,552
sqft
|
built
1972
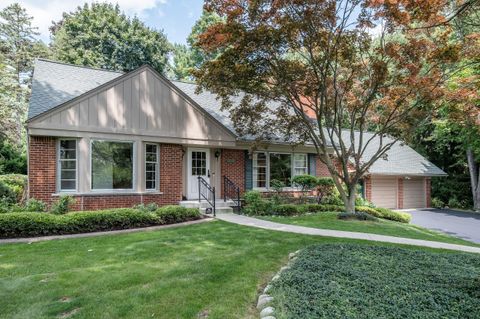
2539 Kingston Dr, Troy, MI 48084
$-1,338
Cash flow
-11.6%
Cash-on-Cash Return
3.5%
Cap rate
0.6%
Rent to Value Ratio

Active
$437,500
4
bds
|
4
ba
|
3,200
sqft
|
built
1964
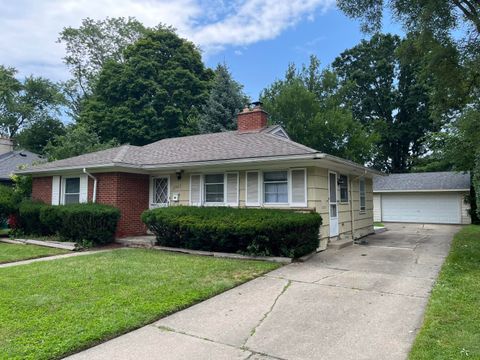
28355 Tavistock Trl, Southfield, MI 48034
$-536
Cash flow
-6.4%
Cash-on-Cash Return
4.7%
Cap rate
0.7%
Rent to Value Ratio

Active
$365,000
3
bds
|
1
ba
|
1,794
sqft
|
built
1984
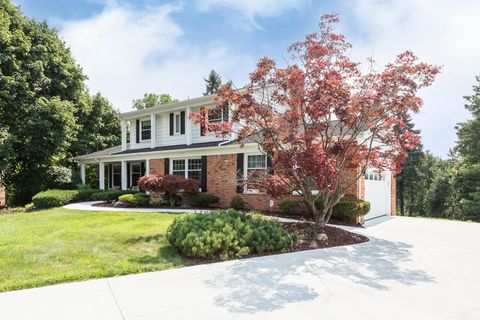
3360 Tipsico Trl, Holly, MI 48442
$-630
Cash flow
-9.0%
Cash-on-Cash Return
4.1%
Cap rate
0.6%
Rent to Value Ratio

Active
$299,000
3
bds
|
2
ba
|
1,139
sqft
|
built
1942
1799 Phillips Ave, Berkley, MI 48072
$-379
Cash flow
-6.6%
Cash-on-Cash Return
4.6%
Cap rate
0.7%
Rent to Value Ratio

Active
$1,100,000
5
bds
|
4
ba
|
3,804
sqft
|
built
1994
4712 Rambling Ct, Troy, MI 48098
$-3,408
Cash flow
-16.2%
Cash-on-Cash Return
2.4%
Cap rate
0.4%
Rent to Value Ratio

Active
$354,900
3
bds
|
2
ba
|
1,605
sqft
|
built
1956
133 Kirk Lane Dr, Troy, MI 48084
$-322
Cash flow
-4.7%
Cash-on-Cash Return
5.1%
Cap rate
0.7%
Rent to Value Ratio
Active
$250,000
4
bds
|
2
ba
|
1,753
sqft
|
built
1962
17251 Lee St, Southfield, MI 48075
$-17
Cash flow
-0.4%
Cash-on-Cash Return
6.1%
Cap rate
0.9%
Rent to Value Ratio

Active
$475,000
4
bds
|
3
ba
|
2,342
sqft
|
built
2000
1894 Twin Sun Cir, Walled Lake, MI 48390
$-664
Cash flow
-7.3%
Cash-on-Cash Return
4.5%
Cap rate
0.7%
Rent to Value Ratio
Active
$250,000
3
bds
|
2
ba
|
1,252
sqft
|
built
1960
16218 Addison St, Southfield, MI 48075
$-83,234
Cash flow
-1737.1%
Cash-on-Cash Return
-393.4%
Cap rate
0.8%
Rent to Value Ratio
Active
$239,900
3
bds
|
2
ba
|
1,120
sqft
|
built
1954
13941 Pearson St, Oak Park, MI 48237
$-167
Cash flow
-3.6%
Cash-on-Cash Return
5.3%
Cap rate
0.8%
Rent to Value Ratio
Active
$225,000
3
bds
|
3
ba
|
1,688
sqft
|
built
2003
17608 Gateway Cir, Southfield, MI 48075
$-128
Cash flow
-3.0%
Cash-on-Cash Return
5.5%
Cap rate
1.0%
Rent to Value Ratio
Active
$499,900
5
bds
|
4
ba
|
3,329
sqft
|
built
1954
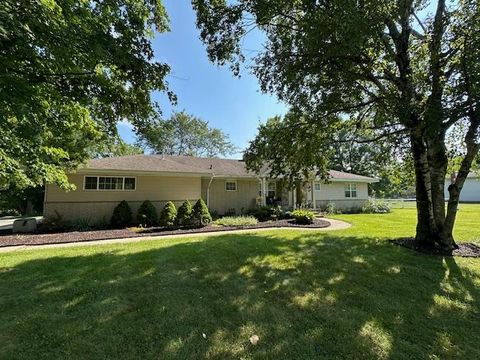
58221 Travis Rd, New Hudson, MI 48165
$-501
Cash flow
-5.2%
Cash-on-Cash Return
4.9%
Cap rate
0.7%
Rent to Value Ratio
Active
$329,000
3
bds
|
2
ba
|
2,319
sqft
|
built
1954
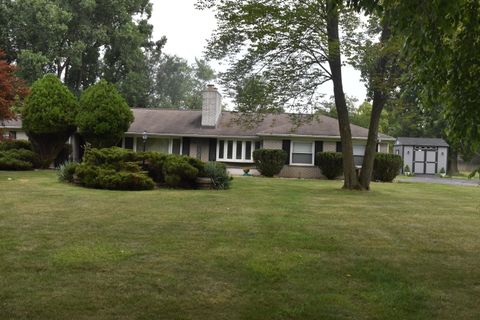
29140 Briarbank Ct, Southfield, MI 48034
$-265
Cash flow
-4.2%
Cash-on-Cash Return
5.2%
Cap rate
0.8%
Rent to Value Ratio

Active
$225,000
2
bds
|
3
ba
|
1,539
sqft
|
built
2002
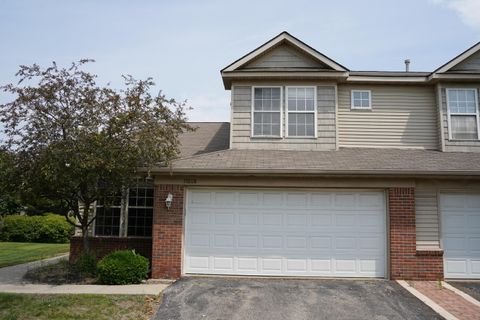
20023 Boardwalk Blvd, Southfield, MI 48075
$-537
Cash flow
-12.5%
Cash-on-Cash Return
3.3%
Cap rate
0.9%
Rent to Value Ratio
Active
$225,000
2
bds
|
2
ba
|
1,600
sqft
|
built
1985
22363 Peachtree, Novi, MI 48375
$-638
Cash flow
-14.8%
Cash-on-Cash Return
2.7%
Cap rate
0.8%
Rent to Value Ratio
Active
$235,500
3
bds
|
2
ba
|
1,605
sqft
|
built
1955
21630 Westhampton St, Oak Park, MI 48237
$-286
Cash flow
-6.3%
Cash-on-Cash Return
4.7%
Cap rate
0.8%
Rent to Value Ratio

Active
$280,000
3
bds
|
2
ba
|
1,685
sqft
|
built
2002
230 Jotham Ave, Auburn Hills, MI 48326
$-535
Cash flow
-10.0%
Cash-on-Cash Return
3.9%
Cap rate
0.8%
Rent to Value Ratio
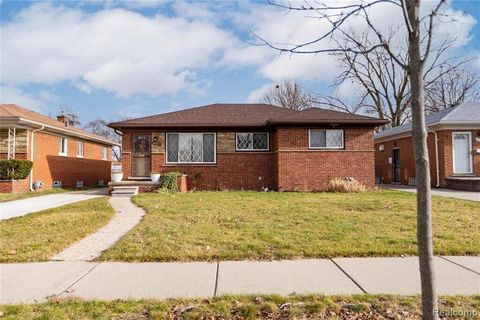
Active
$139,999
3
bds
|
1
ba
|
890
sqft
|
built
1951
470 Fildew Ave, Pontiac, MI 48341
$189
Cash flow
7.0%
Cash-on-Cash Return
7.8%
Cap rate
1.0%
Rent to Value Ratio
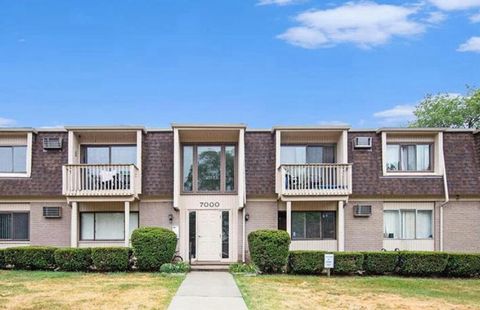
Active
$109,900
2
bds
|
1
ba
|
907
sqft
|
built
1969
7000 Villa Dr, Waterford, MI 48327
$-194
Cash flow
-9.2%
Cash-on-Cash Return
4.0%
Cap rate
1.0%
Rent to Value Ratio

Active
$149,500
2
bds
|
1
ba
|
1,000
sqft
|
built
1928
1210 E Bernhard Ave, Hazel Park, MI 48030
$-94
Cash flow
-3.3%
Cash-on-Cash Return
5.4%
Cap rate
0.8%
Rent to Value Ratio
Active
$288,900
2
bds
|
2
ba
|
2,304
sqft
|
built
1985
35274 Meadow Ln, Farmington Hills, MI 48335
$-2,962
Cash flow
-53.5%
Cash-on-Cash Return
-6.2%
Cap rate
0.7%
Rent to Value Ratio
Active
$184,900
2
bds
|
1
ba
|
997
sqft
|
built
1953
27422 Shagbark Dr, Southfield, MI 48076
$-1
Cash flow
0.0%
Cash-on-Cash Return
6.1%
Cap rate
0.9%
Rent to Value Ratio
Active
$499,900
4
bds
|
3
ba
|
3,284
sqft
|
built
1954
32430 Dohany Dr, Farmington Hills, MI 48336
$-993
Cash flow
-10.4%
Cash-on-Cash Return
3.8%
Cap rate
0.6%
Rent to Value Ratio
Active
$499,900
4
bds
|
4
ba
|
3,620
sqft
|
built
1975
35615 Briar Ridge Ln, Farmington, MI 48335
$-1,204
Cash flow
-12.6%
Cash-on-Cash Return
3.3%
Cap rate
0.6%
Rent to Value Ratio

Active
$500,000
5
bds
|
3
ba
|
2,579
sqft
|
built
1974
21944 Rossdale Ct, Northville, MI 48167
$-828
Cash flow
-8.6%
Cash-on-Cash Return
4.2%
Cap rate
0.6%
Rent to Value Ratio

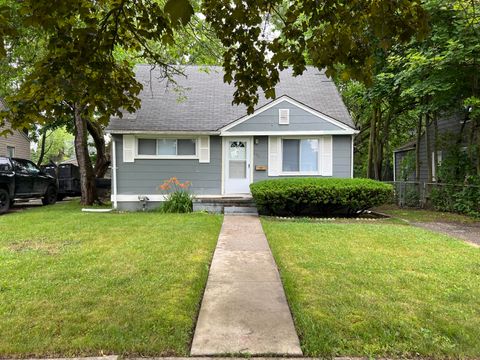
Active
$164,999
3
bds
|
1
ba
|
806
sqft
|
built
1941
30769 Brush St, Madison Heights, MI 48071
$12
Cash flow
0.4%
Cash-on-Cash Return
6.2%
Cap rate
0.9%
Rent to Value Ratio
Active
$530,000
3
bds
|
3
ba
|
3,831
sqft
|
built
1997
1322 Copper Cir, Rochester, MI 48306
$-1,594
Cash flow
-15.7%
Cash-on-Cash Return
2.5%
Cap rate
0.5%
Rent to Value Ratio
Active
$399,500
4
bds
|
4
ba
|
3,409
sqft
|
built
1970
26256 Meadowbrook Way, Lathrup Village, MI 48076
$-474
Cash flow
-6.2%
Cash-on-Cash Return
4.7%
Cap rate
0.7%
Rent to Value Ratio
Active
$152,000
2
bds
|
1
ba
|
751
sqft
|
built
1966
433 Miller Ave, Rochester Hills, MI 48307
$-281
Cash flow
-9.6%
Cash-on-Cash Return
3.9%
Cap rate
0.9%
Rent to Value Ratio
Active
$174,999
2
bds
|
1
ba
|
1,422
sqft
|
built
1950
644 E Brickley Ave, Hazel Park, MI 48030
$-157
Cash flow
-4.7%
Cash-on-Cash Return
5.1%
Cap rate
0.8%
Rent to Value Ratio
Active
$550,000
4
bds
|
3
ba
|
3,500
sqft
|
built
1993
42683 Wimbleton Way, Novi, MI 48377
$-618
Cash flow
-5.9%
Cash-on-Cash Return
4.8%
Cap rate
0.8%
Rent to Value Ratio

Active
$174,900
2
bds
|
1
ba
|
838
sqft
|
built
1974
245 Lake Village Dr, Walled Lake, MI 48390
$-429
Cash flow
-12.8%
Cash-on-Cash Return
3.2%
Cap rate
0.8%
Rent to Value Ratio

Active
$188,000
2
bds
|
2
ba
|
1,085
sqft
|
built
1991
61264 Greenwood Dr, South Lyon, MI 48178
$-533
Cash flow
-14.8%
Cash-on-Cash Return
2.7%
Cap rate
0.8%
Rent to Value Ratio

Active
$550,000
4
bds
|
3
ba
|
2,556
sqft
|
built
1957
219 Ottawa Dr, Troy, MI 48085
$-1,330
Cash flow
-12.6%
Cash-on-Cash Return
3.2%
Cap rate
0.5%
Rent to Value Ratio

Active
$165,000
2
bds
|
2
ba
|
1,699
sqft
|
built
1985
3054 Carly Ct, Auburn Hills, MI 48326
$-141
Cash flow
-4.5%
Cash-on-Cash Return
5.1%
Cap rate
1.0%
Rent to Value Ratio

Active
$275,000
2
bds
|
2
ba
|
1,456
sqft
|
built
1967
150 E Long Lake Rd, Bloomfield Hills, MI 48304
$-692
Cash flow
-13.1%
Cash-on-Cash Return
3.1%
Cap rate
0.8%
Rent to Value Ratio