Tipton County Investment Properties for Sale
Browse homes for sale and investment properties in Tipton County. Refine your search by price, property type, or more.
Best cash flowing properties in Tipton County
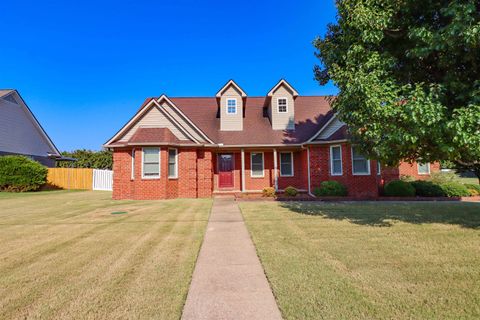
Active
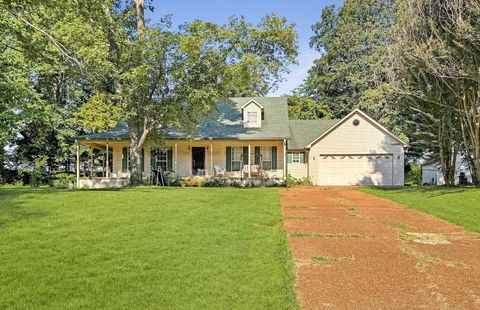
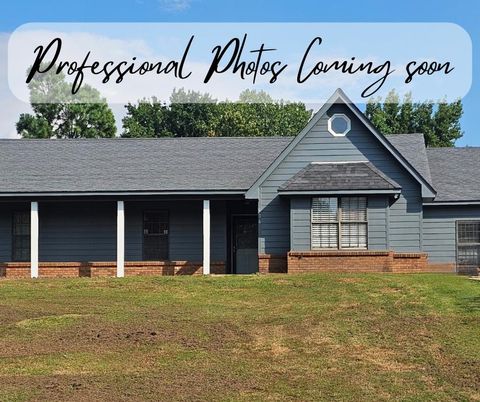
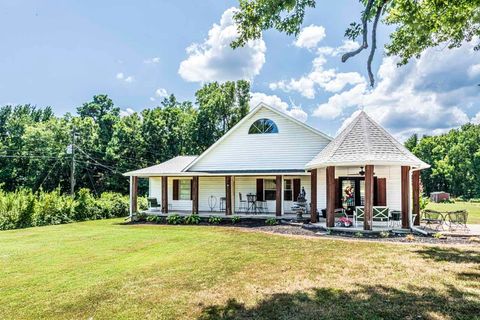
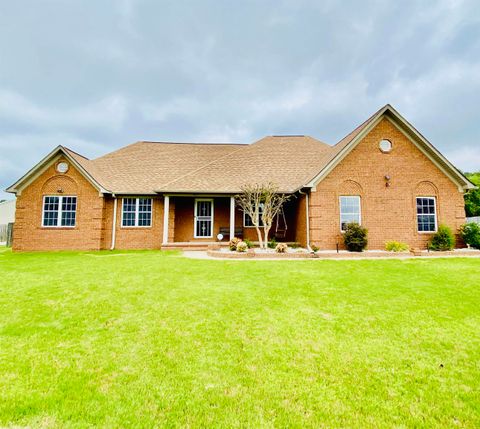
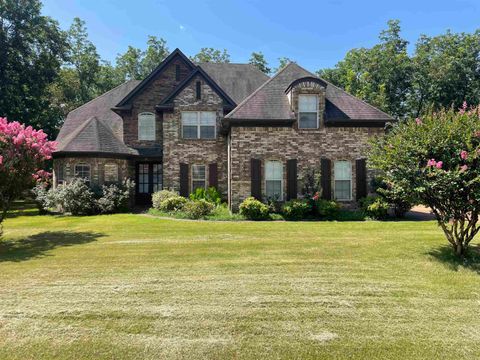
$235,000
4
bds
|
2.1
ba
|
0
sqft
|
built
1994
273 Daniel Dr, Brighton, TN 38011
$315
Cash flow
7.0%
Cash-on-Cash Return
7.3%
Cap rate
0.9%
Rent to Value Ratio
Active
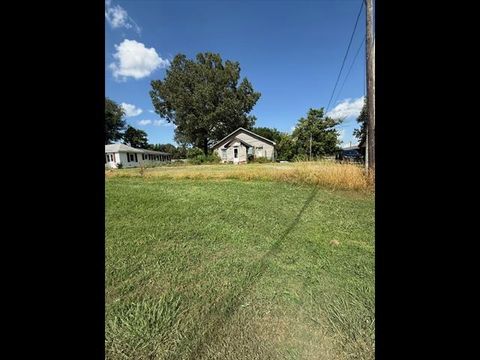
$129,000
3
bds
|
1.1
ba
|
0
sqft
|
built
1938
11766 Main St, Mason, TN 38049
$259
Cash flow
10.5%
Cash-on-Cash Return
8.1%
Cap rate
1.0%
Rent to Value Ratio
92 out of 112 properties for sale in Tipton County
Limited Results Shown
Create a free account, or log in to reveal all property listings and enjoy the complete experience.
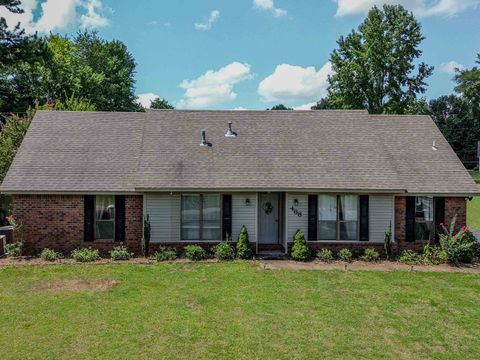
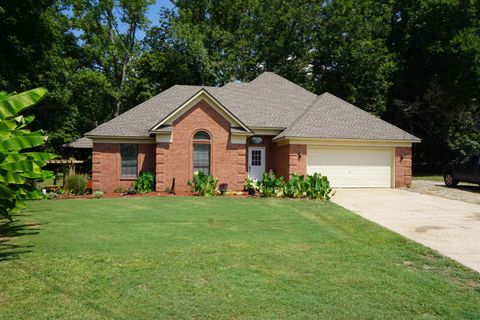
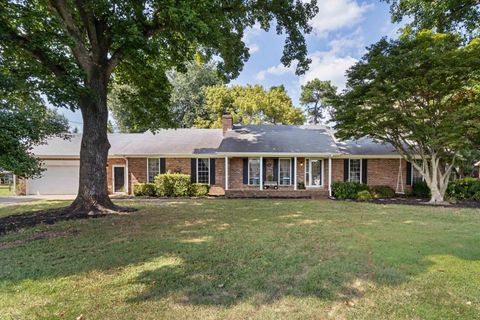
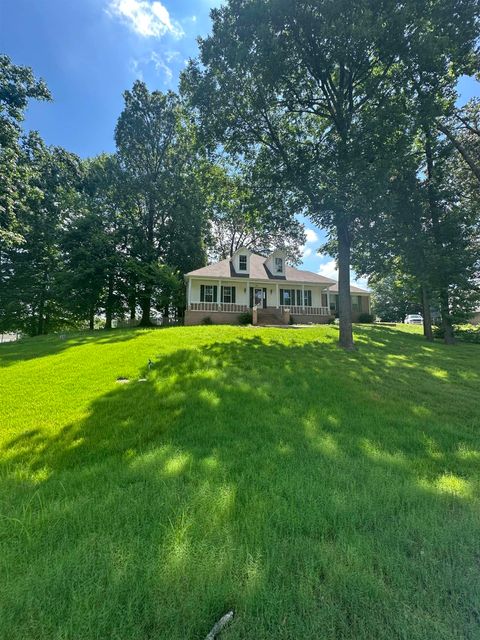
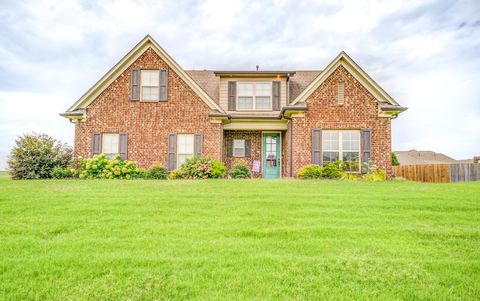
Active
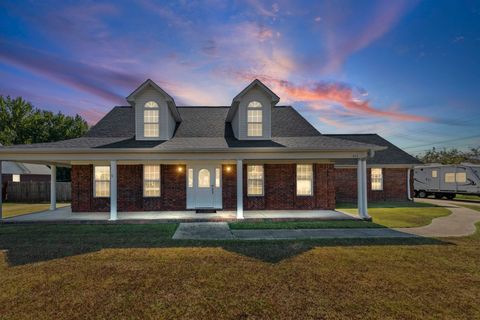
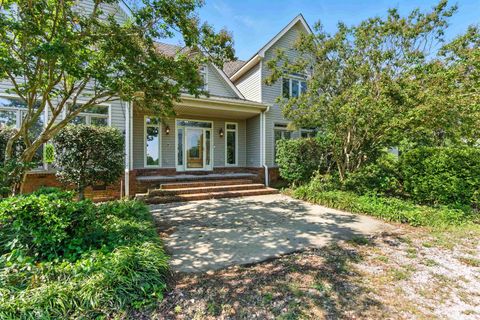
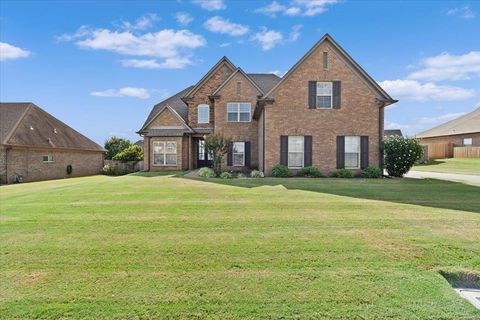
$350,000
4
bds
|
3
ba
|
0
sqft
|
built
1990
468 Dana St, Brighton, TN 38011
$-167
Cash flow
-2.5%
Cash-on-Cash Return
5.1%
Cap rate
0.7%
Rent to Value Ratio
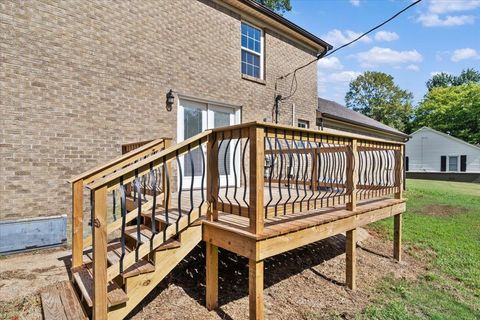
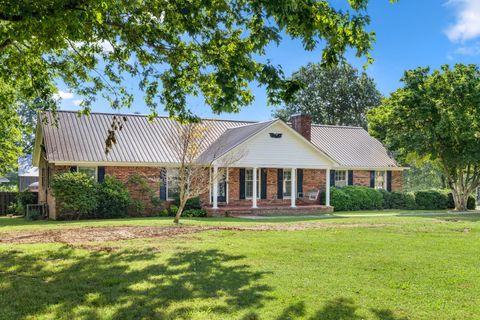
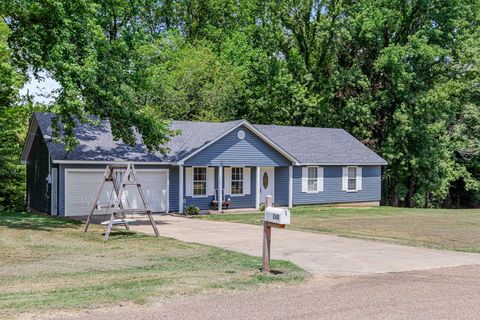
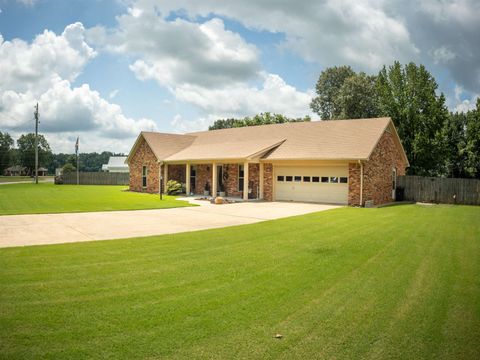
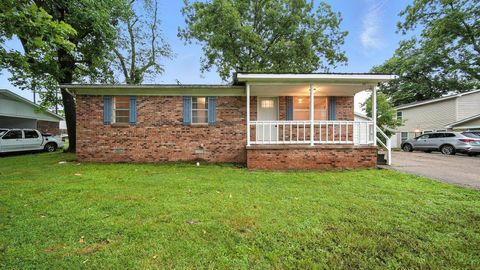
Active
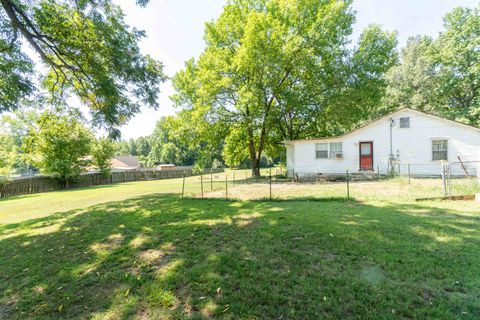
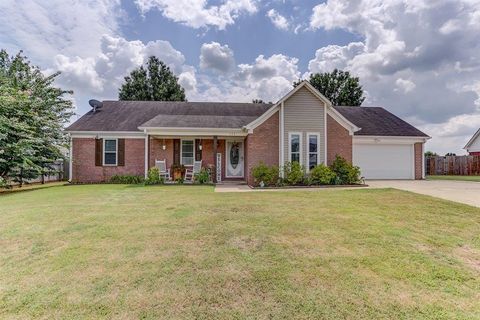
$289,999
3
bds
|
2
ba
|
0
sqft
|
built
1978
101 Sivil Cir, Garland, TN 38019
$-180
Cash flow
-3.2%
Cash-on-Cash Return
4.9%
Cap rate
0.6%
Rent to Value Ratio
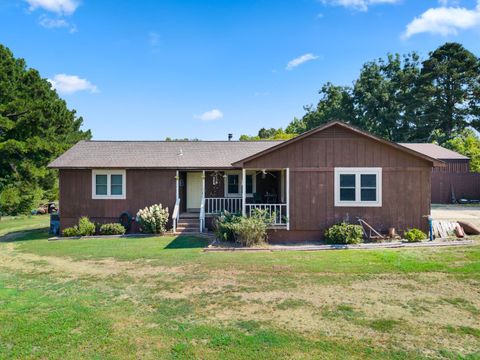
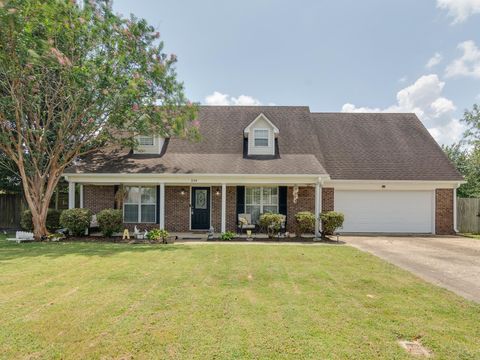
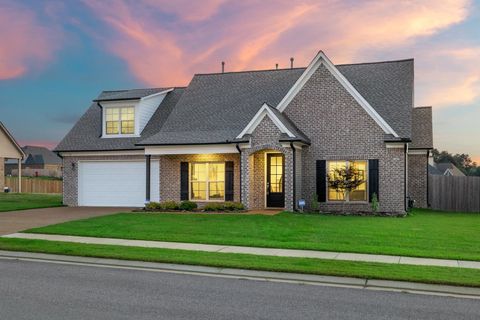
Active
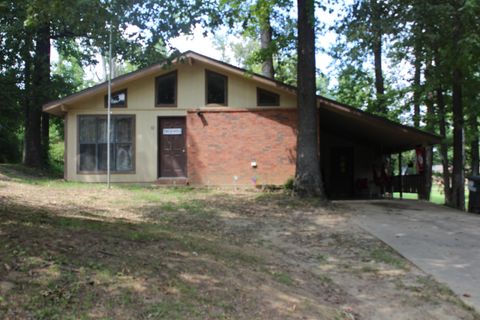
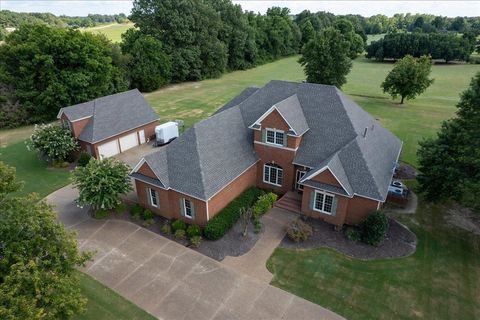
$328,000
3
bds
|
2
ba
|
0
sqft
|
built
1987
434 West Dr, Munford, TN 38058
$-156
Cash flow
-2.5%
Cash-on-Cash Return
5.1%
Cap rate
0.7%
Rent to Value Ratio
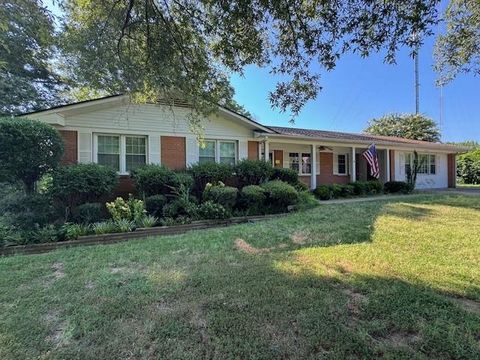
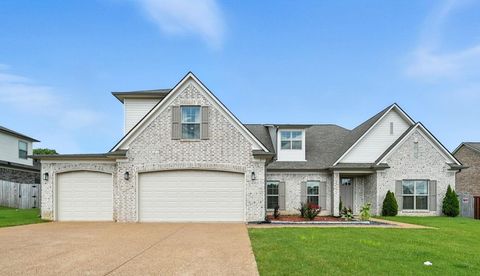
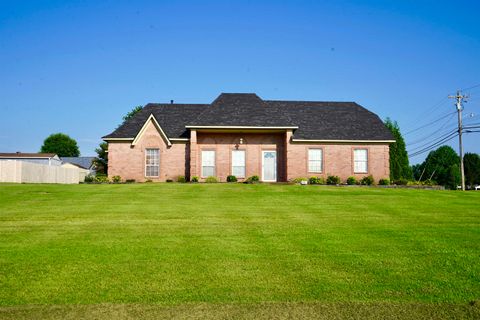
Active
$340,000
3
bds
|
2
ba
|
0
sqft
|
built
2005
512 Kearns Cir, Atoka, TN 38004
$-242
Cash flow
-3.7%
Cash-on-Cash Return
4.8%
Cap rate
0.6%
Rent to Value Ratio
Active
$149,500
2
bds
|
1
ba
|
0
sqft
|
built
1950
117 Hunters Ave, Brighton, TN 38011
$97
Cash flow
3.4%
Cash-on-Cash Return
6.5%
Cap rate
0.8%
Rent to Value Ratio
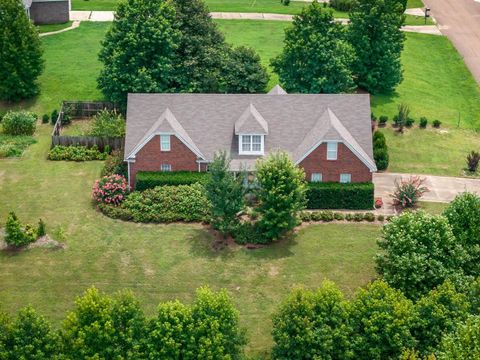
Active
$185,000
3
bds
|
2
ba
|
0
sqft
|
built
2003
52 Stacey Ln, Brighton, TN 38011
$53
Cash flow
1.5%
Cash-on-Cash Return
6.0%
Cap rate
0.8%
Rent to Value Ratio
Active
$385,500
3
bds
|
2
ba
|
0
sqft
|
built
2004
371 Beverly Dr, Atoka, TN 38004
$-394
Cash flow
-5.3%
Cash-on-Cash Return
4.5%
Cap rate
0.6%
Rent to Value Ratio
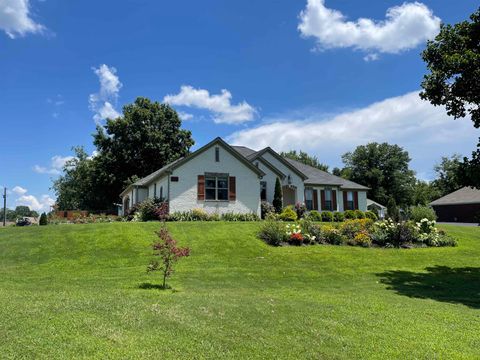
Active
$324,000
3
bds
|
2
ba
|
0
sqft
|
built
1995
52 Belks Cv, Atoka, TN 38004
$-233
Cash flow
-3.8%
Cash-on-Cash Return
4.8%
Cap rate
0.6%
Rent to Value Ratio
Active
$490,000
4
bds
|
2
ba
|
0
sqft
|
built
1975
2930 Indian Creek Rd, Brighton, TN 38011
$-1,077
Cash flow
-11.5%
Cash-on-Cash Return
3.0%
Cap rate
0.4%
Rent to Value Ratio
Active
$275,000
3
bds
|
2
ba
|
0
sqft
|
built
1988
272 Stephens Rd, Burlison, TN 38015
$-131
Cash flow
-2.5%
Cash-on-Cash Return
5.1%
Cap rate
0.7%
Rent to Value Ratio
Active
$350,000
4
bds
|
1
ba
|
0
sqft
|
built
1978
5391 Simmons Rd, Drummonds, TN 38023
$-608
Cash flow
-9.1%
Cash-on-Cash Return
3.6%
Cap rate
0.5%
Rent to Value Ratio
Active
$700,000
4
bds
|
4
ba
|
0
sqft
|
built
1994
1452 Solo Rd, Covington, TN 38019
$-1,279
Cash flow
-9.5%
Cash-on-Cash Return
3.5%
Cap rate
0.5%
Rent to Value Ratio
Active
$265,000
3
bds
|
2
ba
|
0
sqft
|
built
1999
353 Wylie Dr, Brighton, TN 38011
$-112
Cash flow
-2.2%
Cash-on-Cash Return
5.2%
Cap rate
0.7%
Rent to Value Ratio
Active
$774,900
4
bds
|
5
ba
|
0
sqft
|
built
2000
1467 Hall Rd, Covington, TN 38019
$-2,062
Cash flow
-13.9%
Cash-on-Cash Return
2.5%
Cap rate
0.3%
Rent to Value Ratio
Active
$459,000
4
bds
|
2.5
ba
|
0
sqft
|
built
2013
523 Sterling Ridge Dr, Atoka, TN 38004
$-466
Cash flow
-5.3%
Cash-on-Cash Return
4.5%
Cap rate
0.6%
Rent to Value Ratio
Active
$279,900
3
bds
|
2
ba
|
0
sqft
|
built
1991
260 Chisolm Trl, Atoka, TN 38004
$-141
Cash flow
-2.6%
Cash-on-Cash Return
5.1%
Cap rate
0.6%
Rent to Value Ratio
Active
$342,000
3
bds
|
2
ba
|
0
sqft
|
built
2025
1820 Indian Creek Rd, Brighton, TN 38011
$-2,595
Cash flow
-39.6%
Cash-on-Cash Return
-3.4%
Cap rate
0.3%
Rent to Value Ratio
Active
$250,000
3
bds
|
2
ba
|
0
sqft
|
built
1971
1912 Kimbrough Dr, Covington, TN 38019
$79
Cash flow
1.6%
Cash-on-Cash Return
6.1%
Cap rate
0.8%
Rent to Value Ratio
Active
$407,000
4
bds
|
2
ba
|
0
sqft
|
built
2004
420 Trebing Pkwy, Atoka, TN 38004
$-503
Cash flow
-6.4%
Cash-on-Cash Return
4.2%
Cap rate
0.6%
Rent to Value Ratio
Active
$325,000
3
bds
|
2.1
ba
|
0
sqft
|
built
1977
202 Holly Grove Rd, Covington, TN 38019
$-308
Cash flow
-4.9%
Cash-on-Cash Return
4.5%
Cap rate
0.6%
Rent to Value Ratio
Active
$328,999
3
bds
|
2
ba
|
0
sqft
|
built
1988
65 Paulette Cir, Covington, TN 38019
$-390
Cash flow
-6.2%
Cash-on-Cash Return
4.3%
Cap rate
0.5%
Rent to Value Ratio
Active
$304,925
4
bds
|
2.1
ba
|
0
sqft
|
built
2000
235 Woodlawn Trce, Brighton, TN 38011
$-179
Cash flow
-3.1%
Cash-on-Cash Return
5.0%
Cap rate
0.7%
Rent to Value Ratio
Active
$385,000
4
bds
|
3
ba
|
0
sqft
|
built
2020
95 Wallace Cv, Atoka, TN 38004
$-398
Cash flow
-5.4%
Cash-on-Cash Return
4.4%
Cap rate
0.6%
Rent to Value Ratio
Active
$304,000
3
bds
|
2
ba
|
0
sqft
|
built
2003
256 Azalea Dr, Atoka, TN 38004
$-46
Cash flow
-0.8%
Cash-on-Cash Return
5.5%
Cap rate
0.7%
Rent to Value Ratio
Active
$820,000
4
bds
|
3
ba
|
0
sqft
|
built
2013
52 Salem Oaks Cv, Atoka, TN 38004
$-1,927
Cash flow
-12.3%
Cash-on-Cash Return
2.9%
Cap rate
0.4%
Rent to Value Ratio
Active
$319,000
3
bds
|
2
ba
|
0
sqft
|
built
1976
262 Cheryl St, Brighton, TN 38011
$-197
Cash flow
-3.2%
Cash-on-Cash Return
4.9%
Cap rate
0.6%
Rent to Value Ratio
Active
$635,000
5
bds
|
2.1
ba
|
0
sqft
|
built
2009
29 Planters Grove Trl, Brighton, TN 38011
$-1,215
Cash flow
-10.0%
Cash-on-Cash Return
3.4%
Cap rate
0.4%
Rent to Value Ratio
Active
$425,000
3
bds
|
3.1
ba
|
0
sqft
|
built
2003
343 Brittany Ln, Atoka, TN 38004
$-511
Cash flow
-6.3%
Cash-on-Cash Return
4.2%
Cap rate
0.6%
Rent to Value Ratio
Active
$355,000
4
bds
|
2
ba
|
0
sqft
|
built
2002
107 Farmer Trl, Atoka, TN 38004
$-306
Cash flow
-4.5%
Cash-on-Cash Return
4.6%
Cap rate
0.6%
Rent to Value Ratio
Active
$325,000
4
bds
|
2
ba
|
0
sqft
|
built
1999
2640 Brighton Clopton Rd, Brighton, TN 38011
$-235
Cash flow
-3.8%
Cash-on-Cash Return
4.8%
Cap rate
0.6%
Rent to Value Ratio
Active
$370,000
3
bds
|
2.1
ba
|
0
sqft
|
built
1999
242 Timothy Rd, Atoka, TN 38004
$-410
Cash flow
-5.8%
Cash-on-Cash Return
4.3%
Cap rate
0.6%
Rent to Value Ratio
Active
$449,900
4
bds
|
3
ba
|
0
sqft
|
built
2022
215 Pritchett Cv, Munford, TN 38058
$-373
Cash flow
-4.3%
Cash-on-Cash Return
4.7%
Cap rate
0.6%
Rent to Value Ratio
Active
$330,000
3
bds
|
3
ba
|
0
sqft
|
built
2006
544 Rachel Shankle Dr, Munford, TN 38058
$-136
Cash flow
-2.2%
Cash-on-Cash Return
5.2%
Cap rate
0.7%
Rent to Value Ratio
Active
$454,000
4
bds
|
2.1
ba
|
0
sqft
|
built
2018
246 Betty Boyd Ln, Atoka, TN 38004
$-398
Cash flow
-4.6%
Cash-on-Cash Return
4.6%
Cap rate
0.6%
Rent to Value Ratio
Active
$515,000
5
bds
|
3
ba
|
0
sqft
|
built
2015
173 Littleton Way, Munford, TN 38058
$-628
Cash flow
-6.4%
Cash-on-Cash Return
4.2%
Cap rate
0.6%
Rent to Value Ratio
Active
$209,900
3
bds
|
1
ba
|
0
sqft
|
built
1972
52 East Dr, Munford, TN 38058
$-90
Cash flow
-2.2%
Cash-on-Cash Return
5.2%
Cap rate
0.7%
Rent to Value Ratio
Active
$422,900
4
bds
|
2.1
ba
|
0
sqft
|
built
2022
113 Forsyth Ln, Munford, TN 38058
$-499
Cash flow
-6.2%
Cash-on-Cash Return
4.3%
Cap rate
0.6%
Rent to Value Ratio
Active
$314,400
4
bds
|
2
ba
|
0
sqft
|
built
1992
461 Blaydes Dr, Atoka, TN 38004
$-104
Cash flow
-1.7%
Cash-on-Cash Return
5.3%
Cap rate
0.7%
Rent to Value Ratio