United States Investment Properties for Sale
Browse homes for sale and investment properties in United States. Refine your search by price, property type, or more.
Best cash flowing properties in United States
Active
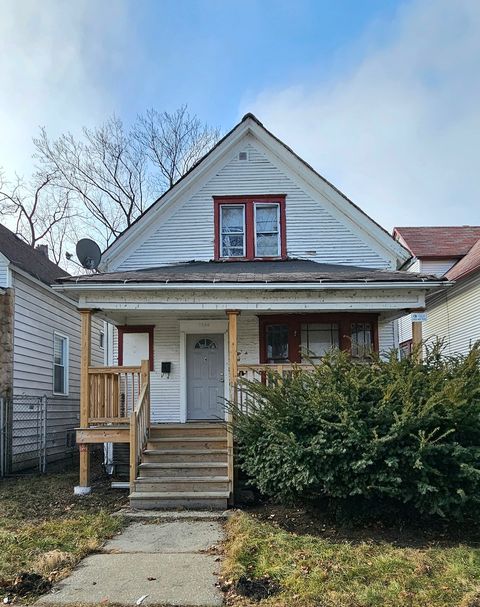
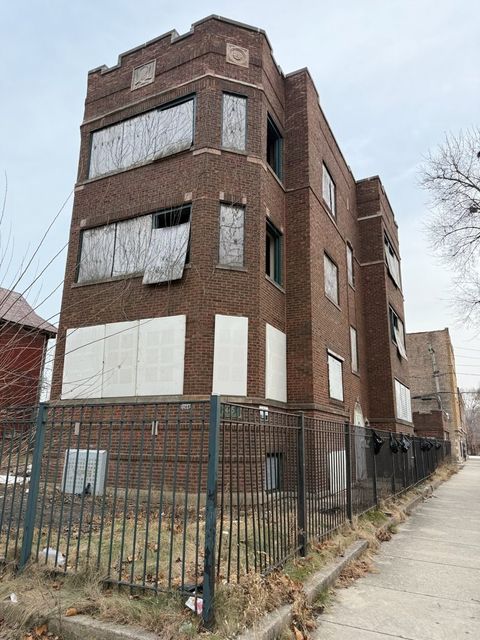
$82,000
4
bds
|
2
ba
|
1,909
sqft
|
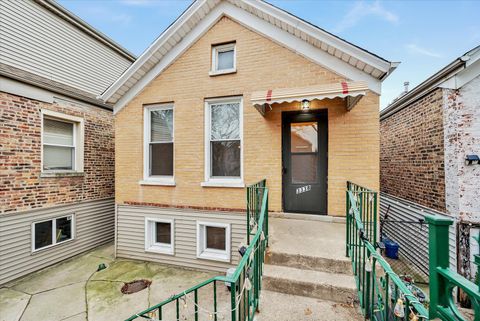
built
1905
7934 S Saginaw Ave, Chicago, IL 60617
$822
Cash flow
52.3%
Cash-on-Cash Return
18.3%
Cap rate
2.4%
Rent to Value Ratio
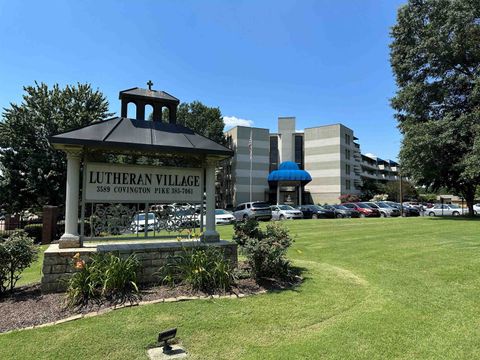
Active
$74,999
1
bds
|
1
ba
|
0
sqft
|
built
1993
3589 Covington Pike, Memphis, TN 38128
$623
Cash flow
9.7%
Cash-on-Cash Return
10.0%
Cap rate
1.3%
Rent to Value Ratio
10,000 out of 383,460 properties for sale in United States
Limited Results Shown
Create a free account, or log in to reveal all property listings and enjoy the complete experience.
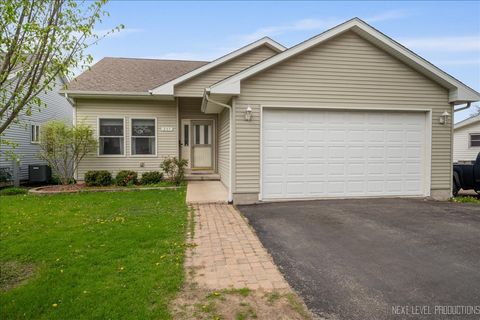
Active
$299,000
3
bds
|
3
ba
|
1,450
sqft
|
built
2006
317 Plymouth Ct, Sycamore, IL 60178
$-483
Cash flow
-8.4%
Cash-on-Cash Return
4.3%
Cap rate
0.8%
Rent to Value Ratio
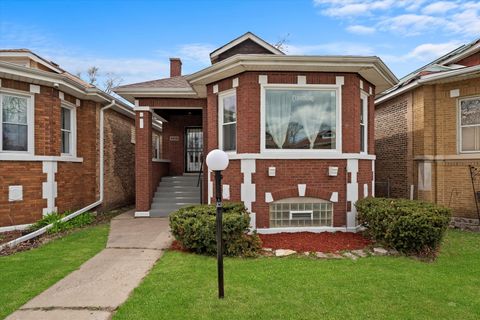
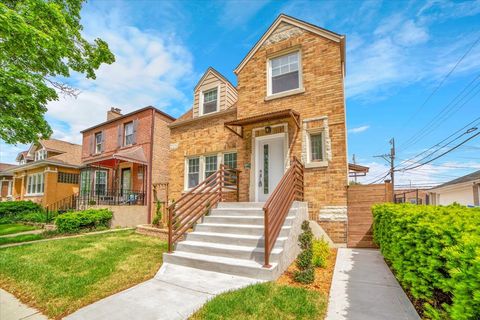
Active
$354,900
4
bds
|
3
ba
|
1,401
sqft
|
built
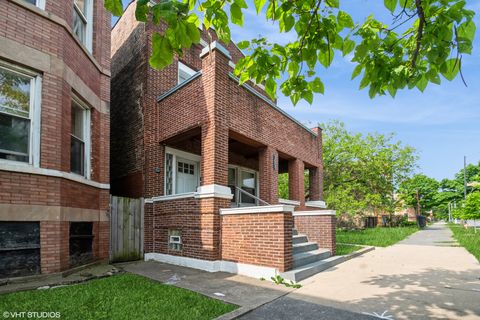
1924
8214 S Paxton Ave, Chicago, IL 60617
$-826
Cash flow
-12.1%
Cash-on-Cash Return
3.4%
Cap rate
0.5%
Rent to Value Ratio
Active
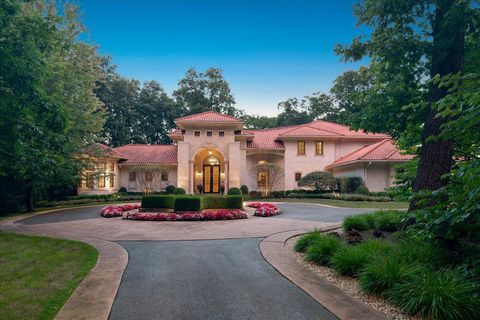
$2,850,000
5
bds
|
8
ba
|
7,669
sqft
|
built
2012
1036 Barrys Ct, Lake Forest, IL 60045
$-10,757
Cash flow
-19.7%
Cash-on-Cash Return
1.7%
Cap rate
0.4%
Rent to Value Ratio
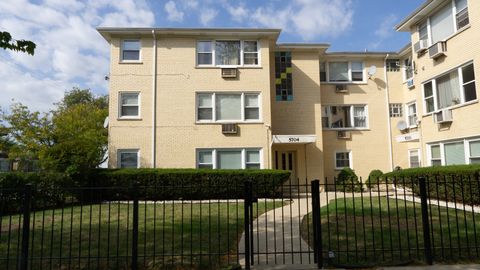
Active
$149,500
1
bds
|
1
ba
|
500
sqft
|
built
1965
5704 W Montrose Ave, Chicago, IL 60634
$-372
Cash flow
-13.0%
Cash-on-Cash Return
3.3%
Cap rate
0.9%
Rent to Value Ratio
Active
$670,000
3
bds
|
3
ba
|
1,802
sqft
|
built
1940
6014 W Fletcher St, Chicago, IL 60634
$-2,021
Cash flow
-15.7%
Cash-on-Cash Return
2.6%
Cap rate
0.4%
Rent to Value Ratio
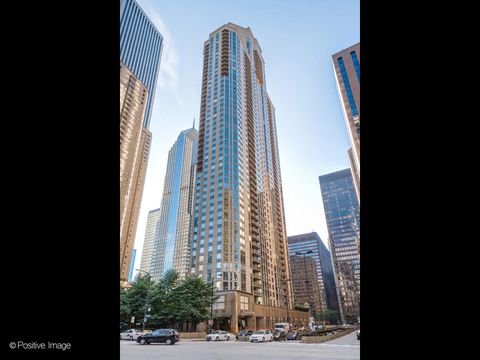
Active
$750,000
3
bds
|
3
ba
|
1,700
sqft
|
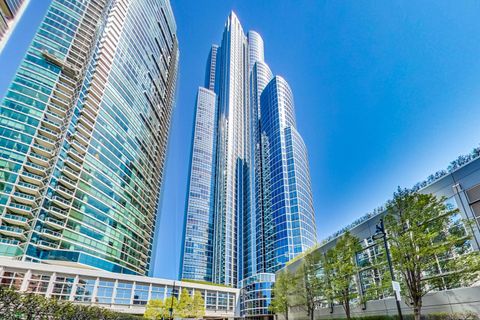
built
2006
222 N Columbus Dr, Chicago, IL 60601
$-2,656
Cash flow
-18.5%
Cash-on-Cash Return
2.0%
Cap rate
0.8%
Rent to Value Ratio
Active
$369,999
16
bds
|
8
ba
|
0
sqft
|
built
1923
2445 E 74th Pl, Chicago, IL 60649
$-1,329
Cash flow
-18.7%
Cash-on-Cash Return
1.9%
Cap rate
0.4%
Rent to Value Ratio
Active
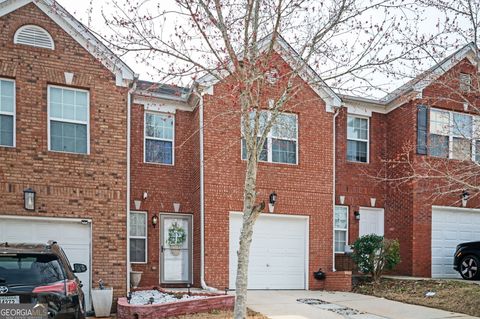
$215,000
3
bds
|
0
ba
|
1,577
sqft
|
built
2004
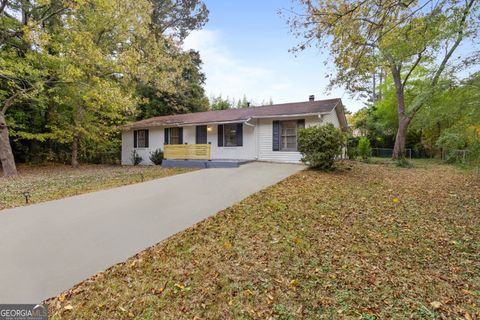
6517 Snowbird Ln, Douglasville, GA 30134
$-177
Cash flow
-4.3%
Cash-on-Cash Return
5.3%
Cap rate
0.8%
Rent to Value Ratio
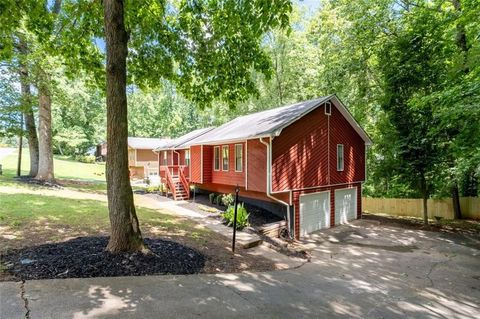
Active
$349,999
5
bds
|
2
ba
|
0
sqft
|
built
1982
4771 N Springs Rd NW, Kennesaw, GA 30144
$-641
Cash flow
-9.6%
Cash-on-Cash Return
4.0%
Cap rate
0.6%
Rent to Value Ratio
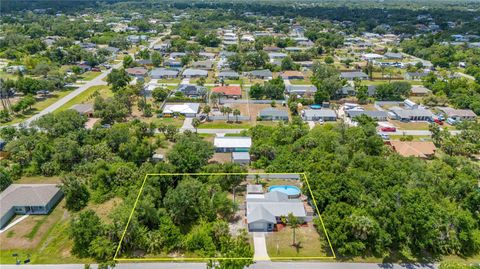
Active
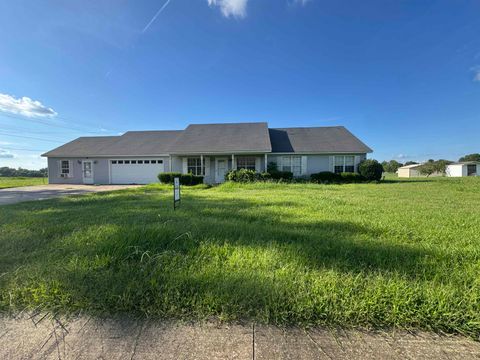
$295,000
2
bds
|
2
ba
|
1,269
sqft
|
built
1981
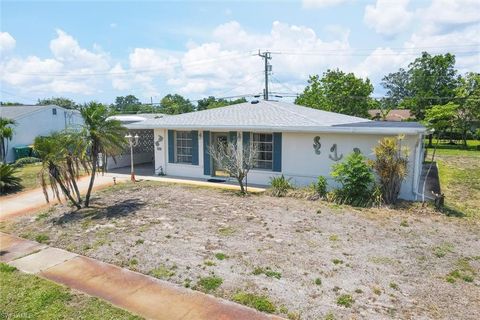
732 Haleybury St, Port Charlotte, FL 33948
$-190
Cash flow
-3.4%
Cash-on-Cash Return
5.4%
Cap rate
0.8%
Rent to Value Ratio
Active
$199,900
4
bds
|
2.5
ba
|
0
sqft
|
built
2000
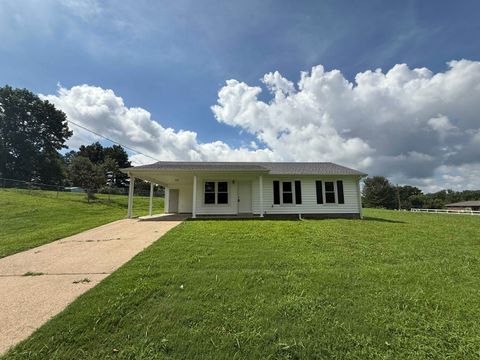
281 Summerhill Dr, Brownsville, TN 38012
$105
Cash flow
2.7%
Cash-on-Cash Return
6.3%
Cap rate
0.9%
Rent to Value Ratio
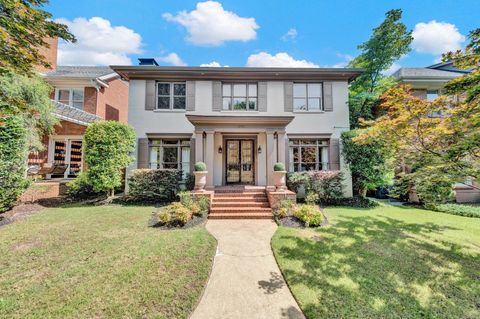
Active
$649,000
5
bds
|
3.5
ba
|
0
sqft
|
built
1992
1810 Autumn Ave, Memphis, TN 38112
$-1,572
Cash flow
-12.6%
Cash-on-Cash Return
2.8%
Cap rate
0.5%
Rent to Value Ratio
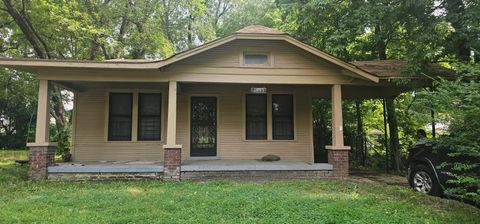
Active
$75,000
2
bds
|
1
ba
|
0
sqft
|
built
1930
1093 Saxon Ave, Memphis, TN 38106
$226
Cash flow
15.7%
Cash-on-Cash Return
9.3%
Cap rate
1.2%
Rent to Value Ratio
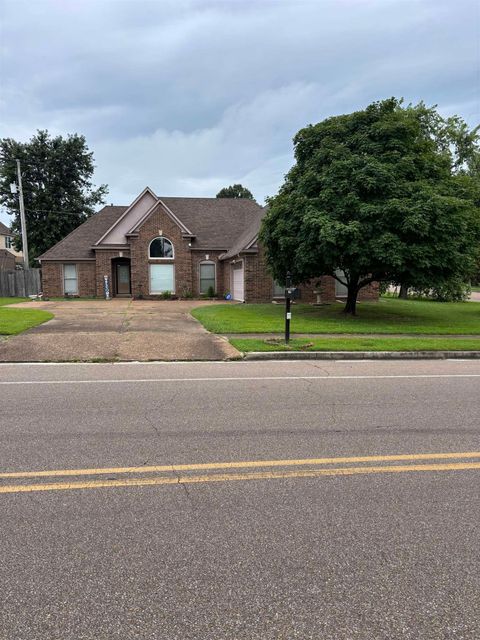
Active
$310,000
4
bds
|
2
ba
|
0
sqft
|
built
1999
9344 Chimneyrock Blvd, Cordova, TN 38016
$-97
Cash flow
-1.6%
Cash-on-Cash Return
5.3%
Cap rate
0.7%
Rent to Value Ratio
Active
$224,900
3
bds
|
2
ba
|
0
sqft
|
built
1989
203 Massey Cv, Atoka, TN 38004
$-12
Cash flow
-0.3%
Cash-on-Cash Return
5.6%
Cap rate
0.7%
Rent to Value Ratio

Active
$65,900
1
bds
|
1
ba
|
0
sqft
|
built
1993
3589 Covington Pike, Memphis, TN 38128
$554
Cash flow
9.8%
Cash-on-Cash Return
10.1%
Cap rate
1.4%
Rent to Value Ratio
Active
$399,900
4
bds
|
2
ba
|
0
sqft
|
built
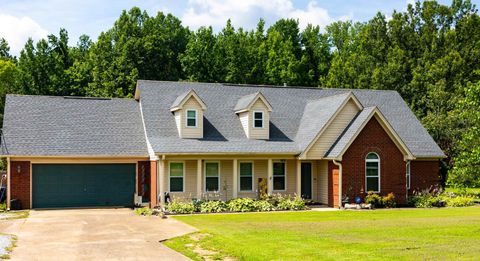
1995
153 Ash Rene Dr, Millington, TN 38053
$-79
Cash flow
-1.0%
Cash-on-Cash Return
5.4%
Cap rate
0.7%
Rent to Value Ratio

Active
$299,000
2
bds
|
1
ba
|
854
sqft
|
built
1976
7056 Sprucewood St, Las Vegas, NV 89147
$-449
Cash flow
-7.8%
Cash-on-Cash Return
3.9%
Cap rate
0.5%
Rent to Value Ratio

Active
$129,000
2
bds
|
1
ba
|
971
sqft
|
built
1950
4624 W 29th St, Little Rock, AR 72204
$181
Cash flow
7.3%
Cash-on-Cash Return
7.4%
Cap rate
0.9%
Rent to Value Ratio
Active
$226,500
4
bds
|
2
ba
|
0
sqft
|
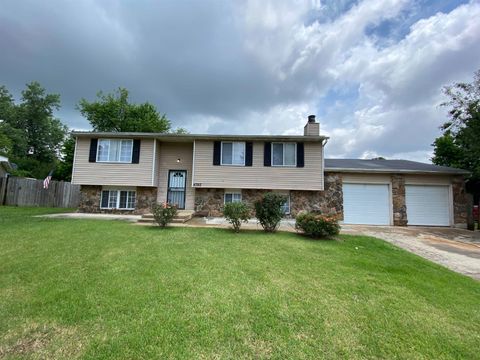
built
1977
4392 Ridge Bay Cv, Millington, TN 38053
$84
Cash flow
1.9%
Cash-on-Cash Return
6.1%
Cap rate
0.8%
Rent to Value Ratio
Active
$299,900
4
bds
|
4
ba
|
0
sqft
|
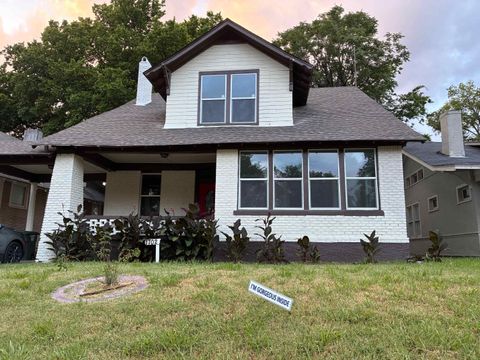
built
1917
1702 Foster Ave, Memphis, TN 38106
$212
Cash flow
3.7%
Cash-on-Cash Return
6.5%
Cap rate
0.9%
Rent to Value Ratio
Active
$195,000
3
bds
|
2.5
ba
|
1,407
sqft
|
built
1968
200 Sunrise Cir, Riverdale, GA 30274
$-82
Cash flow
-2.2%
Cash-on-Cash Return
5.6%
Cap rate
0.8%
Rent to Value Ratio
Active
$189,000
2
bds
|
2
ba
|
1,196
sqft
|
built
1969
330 Lasayette Dr NE, Port Charlotte, FL 33952
$50
Cash flow
1.4%
Cash-on-Cash Return
6.5%
Cap rate
1.0%
Rent to Value Ratio
Active
$2,650,000
4
bds
|
8
ba
|
5,200
sqft
|
built
2005
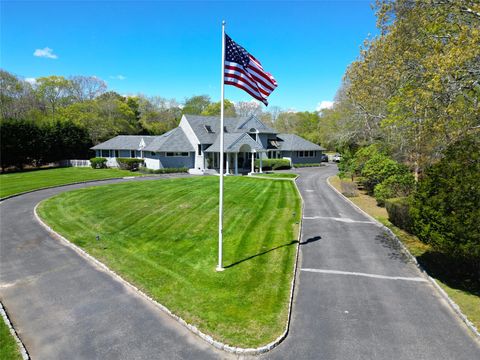
124 Montauk Hwy, Westhampton, NY 11977
$-9,904
Cash flow
-19.5%
Cash-on-Cash Return
1.6%
Cap rate
0.2%
Rent to Value Ratio
Active
$825,000
6
bds
|
2
ba
|
0
sqft
|
built
1905
1622 Van Buren St, Bronx, NY 10460
$-2,469
Cash flow
-15.6%
Cash-on-Cash Return
2.5%
Cap rate
0.4%
Rent to Value Ratio
Active
$355,000
4
bds
|
2
ba
|
0
sqft
|
built
1915
2009 W Garfield Blvd, Chicago, IL 60636
$-406
Cash flow
-6.0%
Cash-on-Cash Return
4.9%
Cap rate
0.6%
Rent to Value Ratio
Active
$950,000
3
bds
|
3
ba
|
2,117
sqft
|
built
2008
1211 S Prairie Ave, Chicago, IL 60605
$-5,858
Cash flow
-32.2%
Cash-on-Cash Return
-1.2%
Cap rate
0.3%
Rent to Value Ratio
Active
$325,000
3
bds
|
2
ba
|
0
sqft
|
built
1888
3338 S Bell Ave, Chicago, IL 60608
$-1,060
Cash flow
-17.0%
Cash-on-Cash Return
2.3%
Cap rate
0.4%
Rent to Value Ratio
Active
$349,900
3
bds
|
2
ba
|
1,310
sqft
|
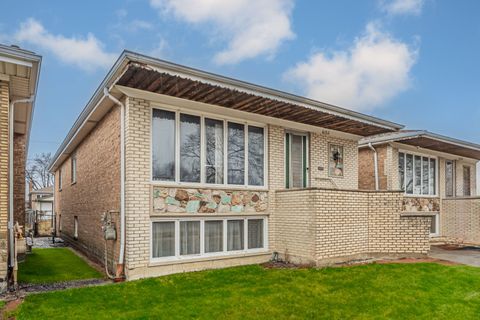
built
1978
6102 W 64th St, Chicago, IL 60638
$-370
Cash flow
-5.5%
Cash-on-Cash Return
5.0%
Cap rate
0.8%
Rent to Value Ratio
Active
$479,000
5
bds
|
3
ba
|
2,700
sqft
|
built
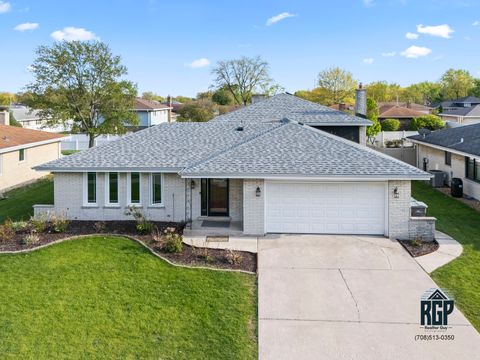
1972
7705 Sycamore Dr, Orland Park, IL 60462
$-1,054
Cash flow
-11.5%
Cash-on-Cash Return
3.6%
Cap rate
0.7%
Rent to Value Ratio
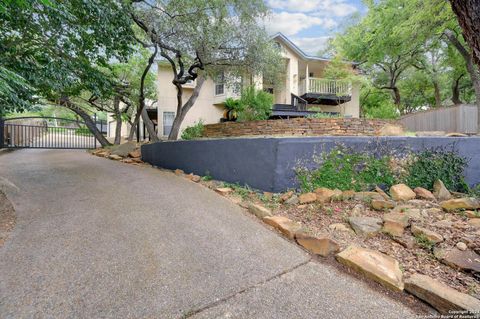
Active
$465,000
3
bds
|
3
ba
|
2,498
sqft
|
built
1994
13418 Stairock St, San Antonio, TX 78248
$-1,079
Cash flow
-12.1%
Cash-on-Cash Return
2.9%
Cap rate
0.7%
Rent to Value Ratio
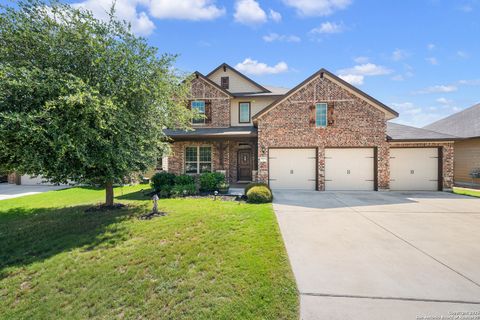
Active
$474,000
6
bds
|
3
ba
|
3,264
sqft
|
built
2015
9870 Mulhouse Dr, Schertz, TX 78154
$-1,347
Cash flow
-14.8%
Cash-on-Cash Return
2.3%
Cap rate
0.6%
Rent to Value Ratio
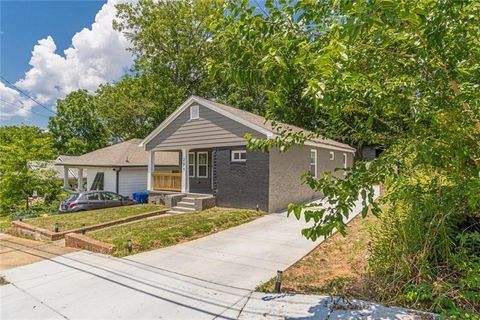
Active
$299,000
3
bds
|
2
ba
|
0
sqft
|
built
1920
299 Fletcher St SW, Atlanta, GA 30315
$-60
Cash flow
-1.0%
Cash-on-Cash Return
6.0%
Cap rate
0.9%
Rent to Value Ratio
Active
$384,500
3
bds
|
1
ba
|
1,064
sqft
|
built
2001
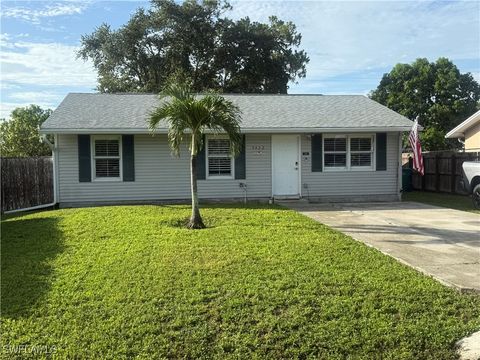
5422 Hardee St, Naples, FL 34113
$-526
Cash flow
-7.1%
Cash-on-Cash Return
4.6%
Cap rate
0.7%
Rent to Value Ratio
Active
$349,900
3
bds
|
0
ba
|
1,845
sqft
|
built
2019
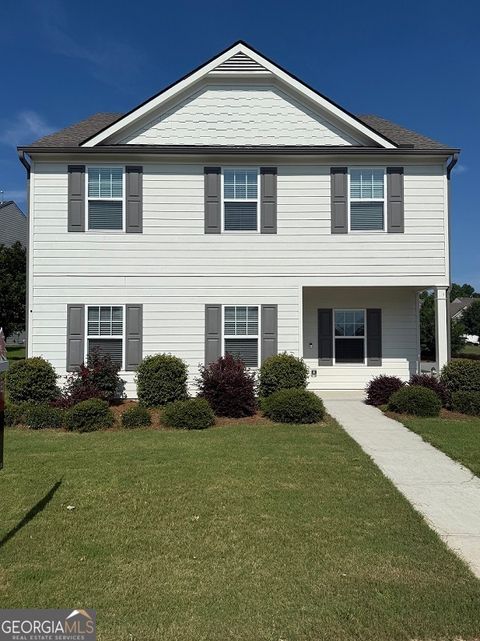
141 Macalester Dr, Newnan, GA 30265
$-602
Cash flow
-9.0%
Cash-on-Cash Return
4.2%
Cap rate
0.6%
Rent to Value Ratio
Active
$209,000
2
bds
|
1
ba
|
0
sqft
|
built
1971
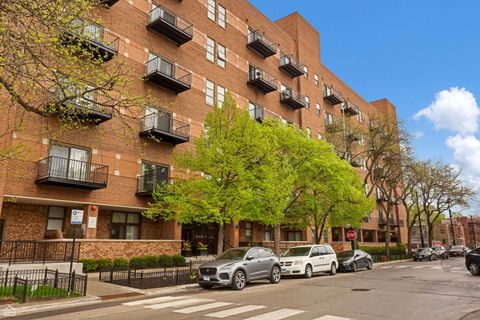
1000 E 53rd St, Chicago, IL 60615
$-751
Cash flow
-18.7%
Cash-on-Cash Return
1.9%
Cap rate
1.1%
Rent to Value Ratio
Active
$245,000
4
bds
|
2
ba
|
1,416
sqft
|
built
1972
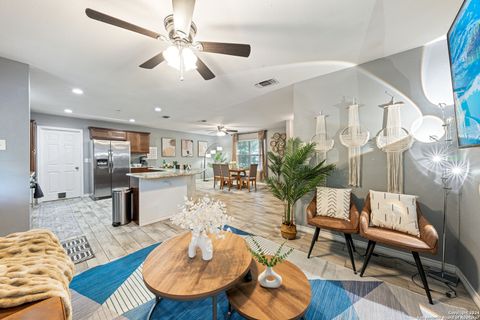
5802 Branch Valley St, San Antonio, TX 78242
$131
Cash flow
2.8%
Cash-on-Cash Return
6.3%
Cap rate
1.0%
Rent to Value Ratio

Active
$610,000
4
bds
|
3
ba
|
1,761
sqft
|
built
1967
2900 NW 9th Ave, Wilton Manors, FL 33311
$-1,546
Cash flow
-13.2%
Cash-on-Cash Return
3.2%
Cap rate
0.6%
Rent to Value Ratio