United States Investment Properties for Sale
Browse homes for sale and investment properties in United States. Refine your search by price, property type, or more.
Best cash flowing properties in United States
Active
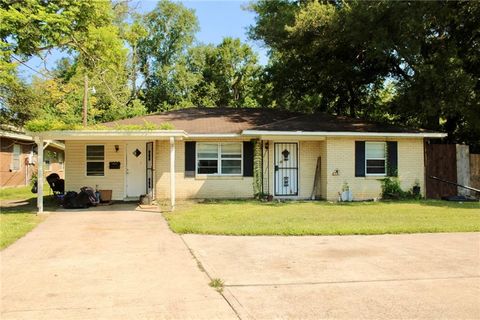
$145,000
3
bds
|
1
ba
|
1,365
sqft
|
built
1981
1005 E Thomas St, Hammond, LA 70401
$280
Cash flow
10.1%
Cash-on-Cash Return
8.0%
Cap rate
1.0%
Rent to Value Ratio
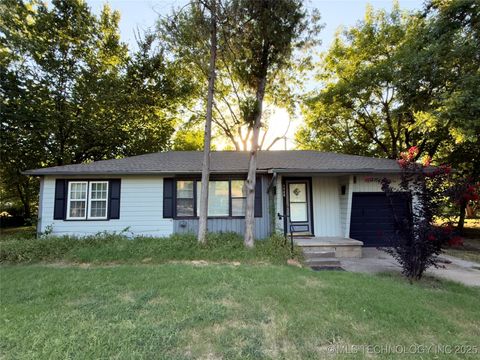
Active
$115,000
2
bds
|
2
ba
|
1,301
sqft
|
built
1950
6448 N Wheeling Ave, Tulsa, OK 74130
$251
Cash flow
11.4%
Cash-on-Cash Return
8.3%
Cap rate
1.0%
Rent to Value Ratio
10,000 out of 305,373 properties for sale in United States
Limited Results Shown
Create a free account, or log in to reveal all property listings and enjoy the complete experience.
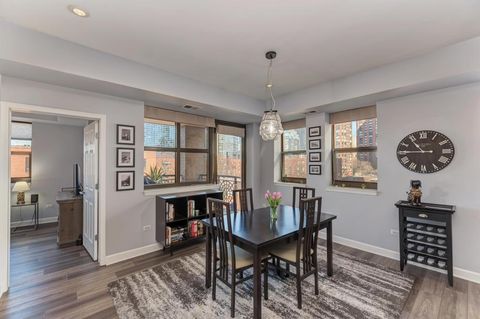
Active
$425,000
2
bds
|
2
ba
|
1,500
sqft
|
built
2006
1111 S State St, Chicago, IL 60605
$-1,425
Cash flow
-17.5%
Cash-on-Cash Return
1.7%
Cap rate
0.8%
Rent to Value Ratio
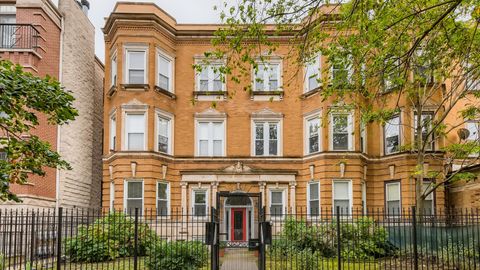
Active
$255,000
2
bds
|
2
ba
|
1,000
sqft
|
built
1903
4707 N Kenmore Ave, Chicago, IL 60640
$-218
Cash flow
-4.5%
Cash-on-Cash Return
4.7%
Cap rate
1.0%
Rent to Value Ratio
Active
$229,500
4
bds
|
1
ba
|
1,400
sqft
|
built
1953
716 E Baltimore St, Wilmington, IL 60481
$28
Cash flow
0.6%
Cash-on-Cash Return
5.8%
Cap rate
0.9%
Rent to Value Ratio
Active
$529,000
4
bds
|
3
ba
|
2,714
sqft
|
built
1999
2020 Saint Andrews Dr, Plainfield, IL 60586
$-1,378
Cash flow
-13.6%
Cash-on-Cash Return
2.6%
Cap rate
0.5%
Rent to Value Ratio
Active
$1,195,000
3
bds
|
4
ba
|
4,262
sqft
|
built
2001
4940 Sunrise Ln, Cumming, GA 30041
$-938
Cash flow
-4.1%
Cash-on-Cash Return
5.2%
Cap rate
0.7%
Rent to Value Ratio
Active
$300,000
3
bds
|
2.5
ba
|
1,598
sqft
|
built
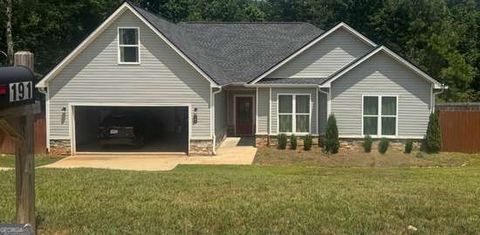
2021
191 Fairview Oak Trl, Dallas, GA 30157
$-449
Cash flow
-7.8%
Cash-on-Cash Return
4.4%
Cap rate
0.7%
Rent to Value Ratio
Active
$618,000
2
bds
|
2
ba
|
1,325
sqft
|
built
2015
39 Fayette St, Quincy, MA 02171
$-1,666
Cash flow
-14.1%
Cash-on-Cash Return
2.4%
Cap rate
0.5%
Rent to Value Ratio

Active
$349,900
3
bds
|
3
ba
|
2,952
sqft
|
built
1986
241 Firetree Ln, West End, NC 27376
$-387
Cash flow
-5.8%
Cash-on-Cash Return
4.4%
Cap rate
0.6%
Rent to Value Ratio
Active
$375,000
3
bds
|
2
ba
|
0
sqft
|
built
2003
271 Oak Club Ln, Collierville, TN 38017
$-537
Cash flow
-7.5%
Cash-on-Cash Return
4.0%
Cap rate
0.6%
Rent to Value Ratio

Active
$219,900
3
bds
|
2
ba
|
1,371
sqft
|
built
1976
904 W Norman St, Broken Arrow, OK 74012
$-91
Cash flow
-2.2%
Cash-on-Cash Return
5.2%
Cap rate
0.7%
Rent to Value Ratio
Active
$1,825,000
4
bds
|
4
ba
|
1,454
sqft
|
built
1979
455 E Third St, Ocean Isle Beach, NC 28469
$-6,348
Cash flow
-18.1%
Cash-on-Cash Return
1.5%
Cap rate
0.2%
Rent to Value Ratio

Active
$330,000
3
bds
|
2
ba
|
1,969
sqft
|
built
1965
10711 Janet Lee Dr, San Antonio, TX 78230
$-722
Cash flow
-11.4%
Cash-on-Cash Return
3.1%
Cap rate
0.7%
Rent to Value Ratio

Active
$295,000
3
bds
|
3
ba
|
1,381
sqft
|
built
1973
6106 Vance Jackson Rd, San Antonio, TX 78230
$-846
Cash flow
-15.0%
Cash-on-Cash Return
2.2%
Cap rate
0.6%
Rent to Value Ratio

Active
$269,000
4
bds
|
0
ba
|
2,360
sqft
|
built
1960
6950 Lark Haven Ln, San Antonio, TX 78263
$-483
Cash flow
-9.4%
Cash-on-Cash Return
3.5%
Cap rate
0.7%
Rent to Value Ratio
Active
$255,000
3
bds
|
2
ba
|
1,152
sqft
|
built
1928
743 Avant Ave, San Antonio, TX 78210
$-330
Cash flow
-6.8%
Cash-on-Cash Return
4.1%
Cap rate
0.7%
Rent to Value Ratio
Active
$249,900
3
bds
|
2
ba
|
1,672
sqft
|
built
1971
311 Benton Dr NW, Rome, GA 30165
$-427
Cash flow
-8.9%
Cash-on-Cash Return
4.1%
Cap rate
0.6%
Rent to Value Ratio
Active
$259,999
3
bds
|
2
ba
|
0
sqft
|
built
1998
1326 Misty Ridge Ct, Hampton, GA 30228
$-500
Cash flow
-10.0%
Cash-on-Cash Return
3.8%
Cap rate
0.6%
Rent to Value Ratio
Active
$374,900
3
bds
|
2
ba
|
1,981
sqft
|
built
1981
2405 Creole Creek Cir, Stone Mountain, GA 30087
$-484
Cash flow
-6.7%
Cash-on-Cash Return
4.6%
Cap rate
0.6%
Rent to Value Ratio
Active
$450,000
4
bds
|
2.5
ba
|
0
sqft
|
built
2014
1607 Shire Village Dr, Sugar Hill, GA 30518
$-1,075
Cash flow
-12.5%
Cash-on-Cash Return
3.3%
Cap rate
0.5%
Rent to Value Ratio
Active
$489,000
3
bds
|
3
ba
|
1,440
sqft
|
built
1996
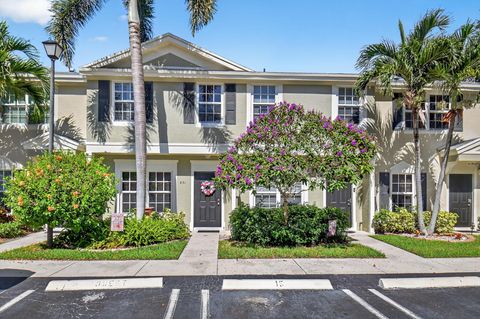
831 Kokomo Key Ln, Delray Beach, FL 33483
$-1,376
Cash flow
-14.7%
Cash-on-Cash Return
2.8%
Cap rate
0.7%
Rent to Value Ratio
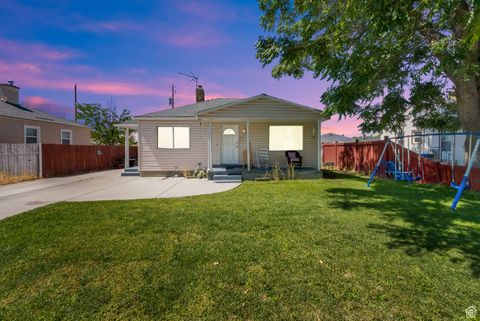
Active
$420,000
3
bds
|
1
ba
|
1,440
sqft
|
built
1942
853 N 235 E, Orem, UT 84057
$-938
Cash flow
-11.7%
Cash-on-Cash Return
3.0%
Cap rate
0.4%
Rent to Value Ratio
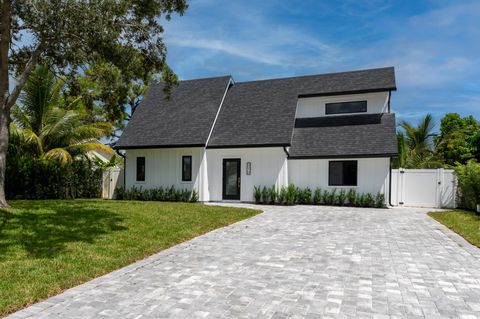
Active
$719,000
3
bds
|
4
ba
|
1,705
sqft
|
built
1986
6219 Dimond St, Jupiter, FL 33458
$-2,113
Cash flow
-15.3%
Cash-on-Cash Return
2.6%
Cap rate
0.4%
Rent to Value Ratio
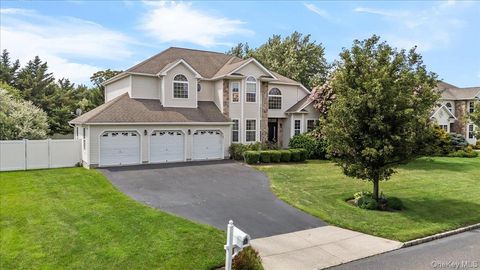
Active
$949,000
5
bds
|
3
ba
|
5,000
sqft
|
built
2006
23 Island Trl, Mount Sinai, NY 11766
$-4,107
Cash flow
-22.6%
Cash-on-Cash Return
0.9%
Cap rate
0.5%
Rent to Value Ratio

Active
$2,590,000
5
bds
|
6.5
ba
|
0
sqft
|
built
2022
3240 Smithtown Rd, Suwanee, GA 30024
$-8,237
Cash flow
-16.6%
Cash-on-Cash Return
2.3%
Cap rate
0.3%
Rent to Value Ratio
Active
$749,900
9
bds
|
3
ba
|
3,276
sqft
|
built
1880
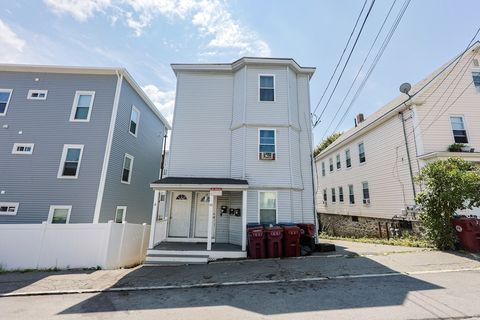
8 Marsh St, Lowell, MA 01854
$-2,544
Cash flow
-17.7%
Cash-on-Cash Return
1.6%
Cap rate
0.3%
Rent to Value Ratio
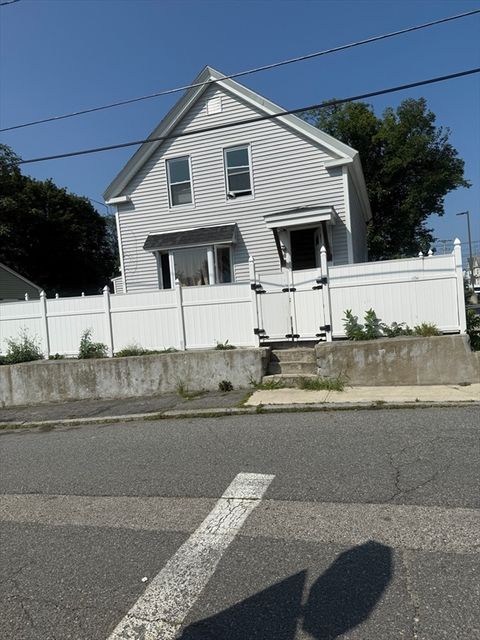
Active
$380,000
4
bds
|
1
ba
|
1,924
sqft
|
built
1910
59 Livingston St, Lowell, MA 01852
$166
Cash flow
2.3%
Cash-on-Cash Return
6.2%
Cap rate
0.8%
Rent to Value Ratio
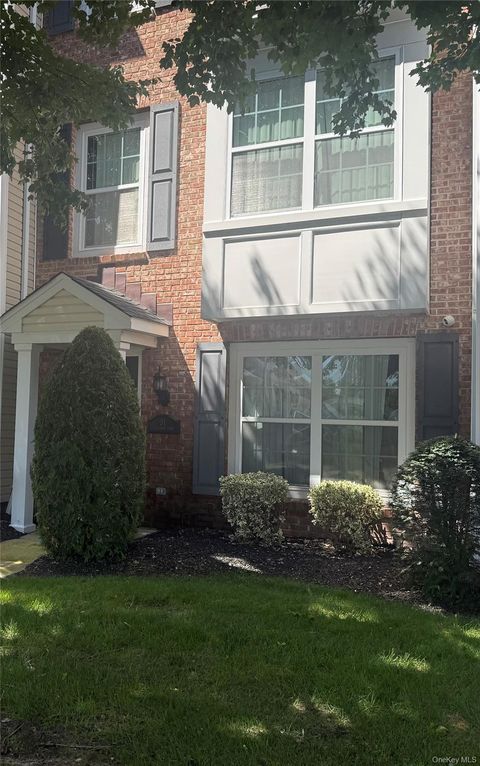
Active
$599,000
2
bds
|
3
ba
|
1,080
sqft
|
built
2007
31 Stahlman Ln, Patchogue, NY 11772
$-1,681
Cash flow
-14.6%
Cash-on-Cash Return
2.7%
Cap rate
0.5%
Rent to Value Ratio
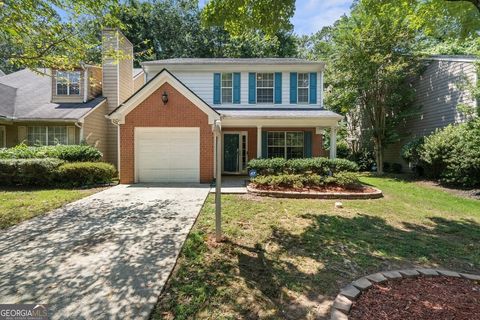
Active
$339,000
3
bds
|
3
ba
|
1,560
sqft
|
built
2000
2225 Charleston Pointe SE, Atlanta, GA 30316
$-379
Cash flow
-5.8%
Cash-on-Cash Return
4.8%
Cap rate
0.7%
Rent to Value Ratio
Active
$585,000
4
bds
|
3
ba
|
1,488
sqft
|
built
1960
2242 Coolidge St, Hollywood, FL 33020
$-1,427
Cash flow
-12.7%
Cash-on-Cash Return
3.2%
Cap rate
0.6%
Rent to Value Ratio
Active
$475,000
4
bds
|
2
ba
|
2,236
sqft
|
built
2005
981 SW Mc Comkle Ave, Port Saint Lucie, FL 34953
$-701
Cash flow
-7.7%
Cash-on-Cash Return
4.4%
Cap rate
0.6%
Rent to Value Ratio
Active
$245,000
2
bds
|
2
ba
|
1,036
sqft
|
built
1978
480 Leach St, Englewood, FL 34223
$27
Cash flow
0.6%
Cash-on-Cash Return
6.3%
Cap rate
0.8%
Rent to Value Ratio
Active
$700,000
3
bds
|
3
ba
|
2,137
sqft
|
built
1988
5511 NW 51st Ave, Coconut Creek, FL 33073
$-1,417
Cash flow
-10.6%
Cash-on-Cash Return
3.7%
Cap rate
0.6%
Rent to Value Ratio
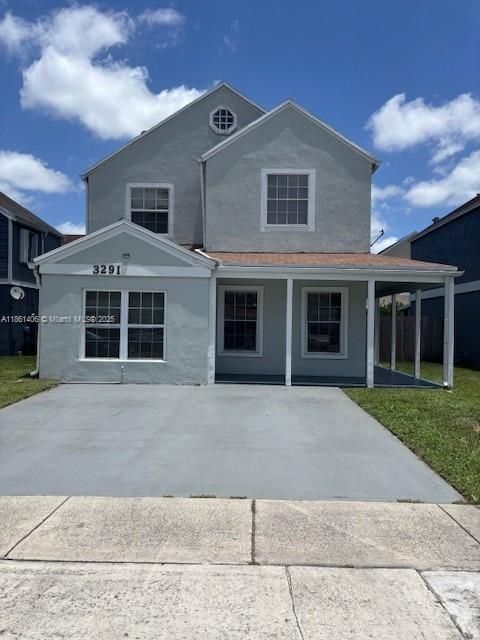
Active
$575,000
4
bds
|
3
ba
|
1,809
sqft
|
built
1987
3291 Kapot Ter, Miramar, FL 33025
$-1,333
Cash flow
-12.1%
Cash-on-Cash Return
3.4%
Cap rate
0.6%
Rent to Value Ratio
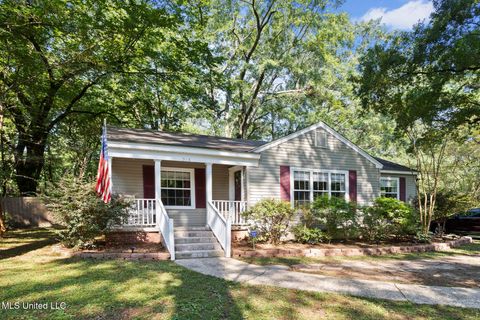
Active
$165,000
3
bds
|
1
ba
|
0
sqft
|
built
1951
316 Colonial Cir, Jackson, MS 39211
$209
Cash flow
6.6%
Cash-on-Cash Return
7.2%
Cap rate
1.0%
Rent to Value Ratio

Active
$675,000
3
bds
|
3
ba
|
2,573
sqft
|
built
1985
26092 Withrow Rd, Brooksville, FL 34601
$-1,467
Cash flow
-11.3%
Cash-on-Cash Return
3.5%
Cap rate
0.5%
Rent to Value Ratio
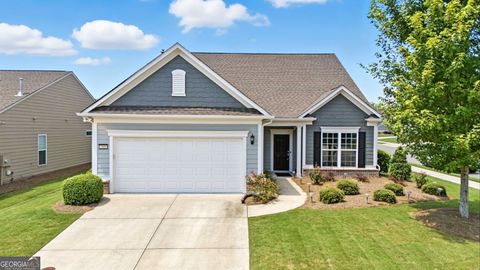
Active
$625,000
4
bds
|
3
ba
|
3,028
sqft
|
built
2018
316 Westfield Bnd, Woodstock, GA 30188
$-1,675
Cash flow
-14.0%
Cash-on-Cash Return
2.9%
Cap rate
0.5%
Rent to Value Ratio
Active
$188,000
3
bds
|
2
ba
|
0
sqft
|
built
1961
1358 Old Hickory Rd, Memphis, TN 38116
$-59
Cash flow
-1.6%
Cash-on-Cash Return
5.3%
Cap rate
0.7%
Rent to Value Ratio
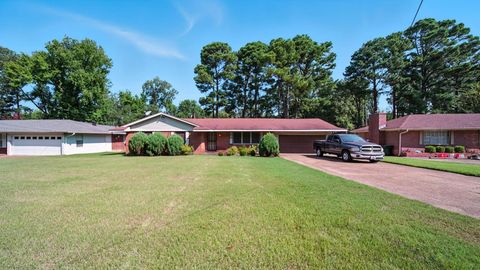
Active
$399,000
4
bds
|
3
ba
|
0
sqft
|
built
1987
3885 Lakemont Dr, Memphis, TN 38128
$-457
Cash flow
-6.0%
Cash-on-Cash Return
4.3%
Cap rate
0.6%
Rent to Value Ratio