United States Investment Properties for Sale
Browse homes for sale and investment properties in United States. Refine your search by price, property type, or more.
Best cash flowing properties in United States
Active
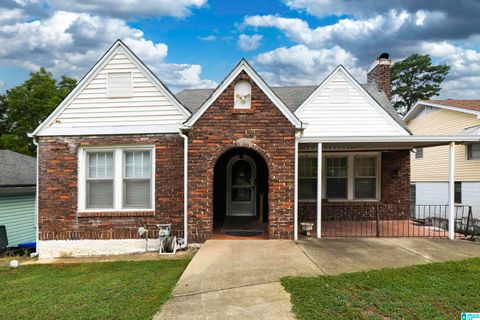
$95,000
3
bds
|
1
ba
|
1,913
sqft
|
built
1924
1532 Graymont Ave W, Birmingham, AL 35208
$654
Cash flow
35.9%
Cash-on-Cash Return
13.9%
Cap rate
1.7%
Rent to Value Ratio
Active
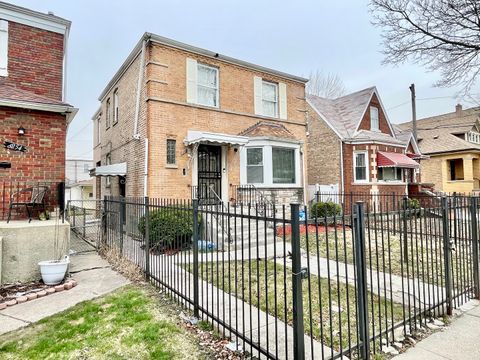
$125,000
4
bds
|
2
ba
|
1,749
sqft
|
built
1947
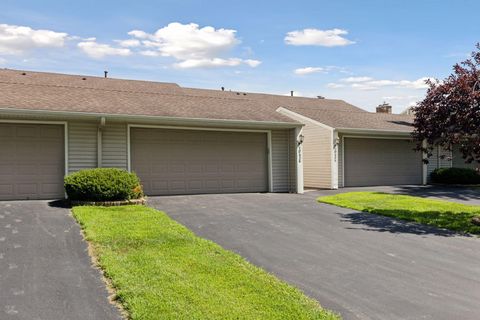
8252 S Marshfield Ave, Chicago, IL 60620
$647
Cash flow
27.0%
Cash-on-Cash Return
11.9%
Cap rate
1.6%
Rent to Value Ratio
10,000 out of 322,835 properties for sale in United States
Limited Results Shown
Create a free account, or log in to reveal all property listings and enjoy the complete experience.
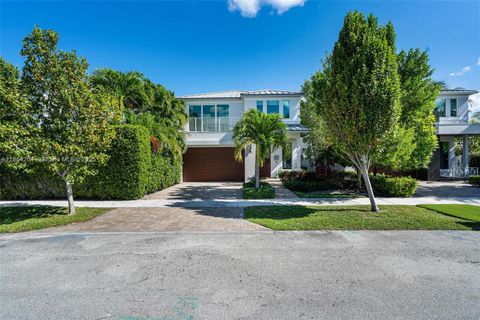
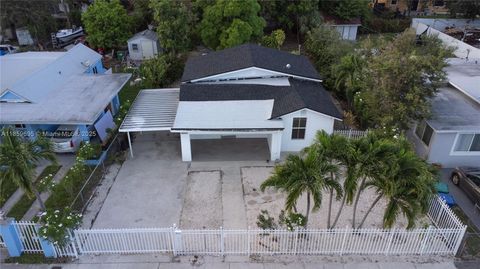
Active
$2,450,000
4
bds
|
4
ba
|
3,056
sqft
|
built
2018
2516 NE 32nd Ave, Fort Lauderdale, FL 33305
$-8,161
Cash flow
-17.4%
Cash-on-Cash Return
2.1%
Cap rate
0.4%
Rent to Value Ratio
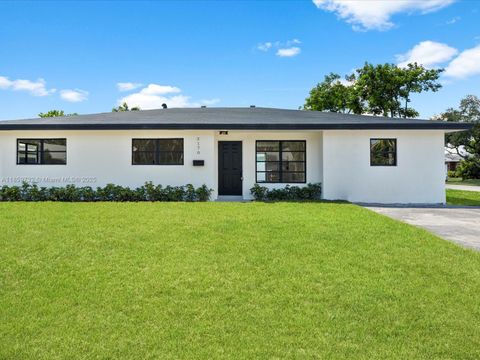
Active
$619,000
4
bds
|
2
ba
|
1,952
sqft
|
built
1972
3170 NW 69th St, Fort Lauderdale, FL 33309
$-1,704
Cash flow
-14.4%
Cash-on-Cash Return
2.8%
Cap rate
0.5%
Rent to Value Ratio
Active
$1,700,000
6
bds
|
4
ba
|
4,800
sqft
|
built
1968
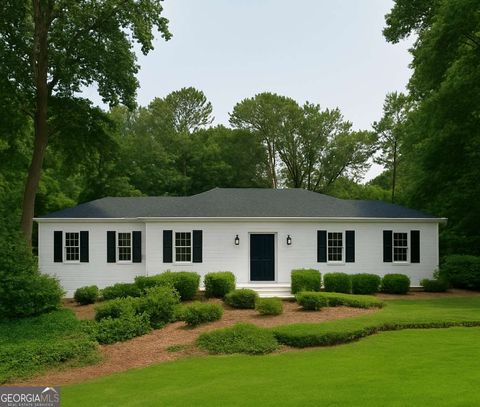
1080 Huntcliff, Sandy Springs, GA 30350
$-6,538
Cash flow
-20.1%
Cash-on-Cash Return
1.5%
Cap rate
0.2%
Rent to Value Ratio
Active
$425,000
6
bds
|
2
ba
|
2,250
sqft
|
built
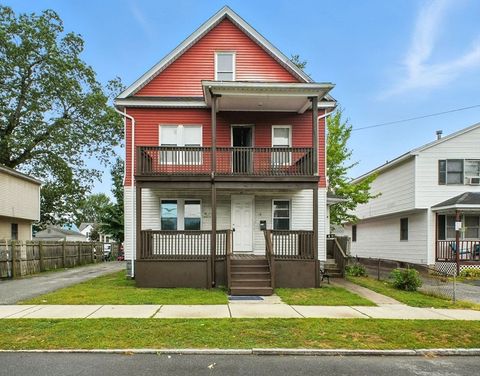
1923
16-18 Haumont Ter, Springfield, MA 01104
$-674
Cash flow
-8.3%
Cash-on-Cash Return
3.8%
Cap rate
0.6%
Rent to Value Ratio
Active
$2,375,000
4
bds
|
4
ba
|
3,634
sqft
|
built
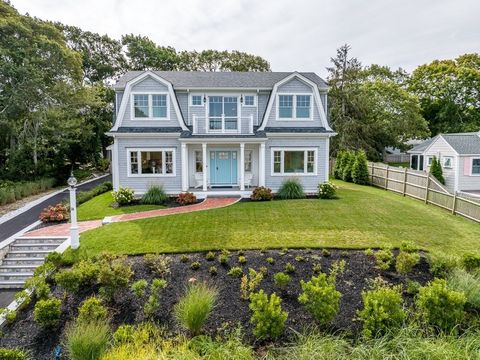
2024
24 Valley Rd, West Yarmouth, MA 02673
$-5,334
Cash flow
-11.7%
Cash-on-Cash Return
3.0%
Cap rate
0.4%
Rent to Value Ratio
Active
$280,000
3
bds
|
2
ba
|
1,849
sqft
|
built
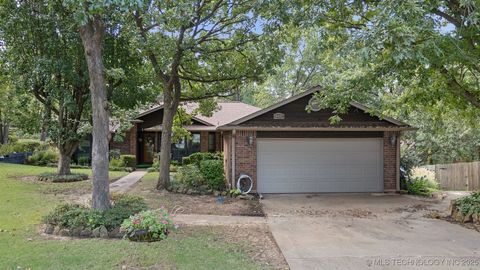
1986
3421 S 73rd West Ave, Tulsa, OK 74107
$-272
Cash flow
-5.1%
Cash-on-Cash Return
4.5%
Cap rate
0.6%
Rent to Value Ratio
Active
$310,000
3
bds
|
2
ba
|
1,024
sqft
|
built
1933
715 S Quanah Ave, Tulsa, OK 74127
$-633
Cash flow
-10.7%
Cash-on-Cash Return
3.2%
Cap rate
0.4%
Rent to Value Ratio
Active
$425,000
3
bds
|
2
ba
|
1,381
sqft
|
built
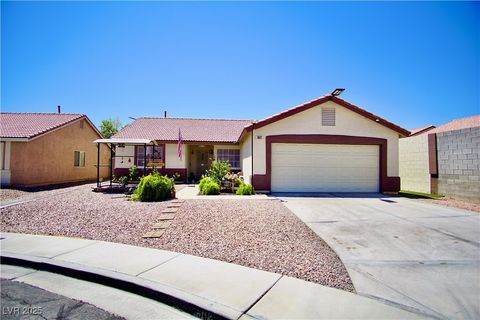
2001
3021 Robincrest Ct, North Las Vegas, NV 89031
$-894
Cash flow
-11.0%
Cash-on-Cash Return
3.2%
Cap rate
0.4%
Rent to Value Ratio
Active
$515,000
3
bds
|
2
ba
|
1,056
sqft
|
built
1984
4872 126th Dr N, West Palm Beach, FL 33411
$-859
Cash flow
-8.7%
Cash-on-Cash Return
4.1%
Cap rate
0.6%
Rent to Value Ratio

Active
$420,000
4
bds
|
3
ba
|
2,264
sqft
|
built
2023
851 Folklore Ln, Haines City, FL 33844
$-557
Cash flow
-6.9%
Cash-on-Cash Return
4.6%
Cap rate
0.6%
Rent to Value Ratio

Active
$324,900
3
bds
|
3
ba
|
0
sqft
|
built
2005
4927 Knob Creek Trl, Arlington, TN 38002
$-236
Cash flow
-3.8%
Cash-on-Cash Return
4.8%
Cap rate
0.7%
Rent to Value Ratio
Active
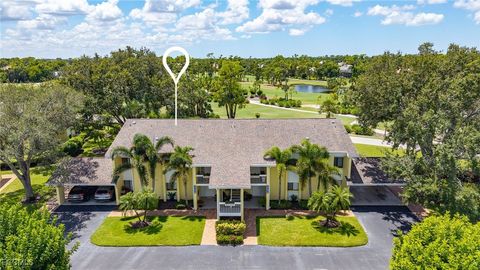
$394,900
3
bds
|
2
ba
|
2,040
sqft
|
built
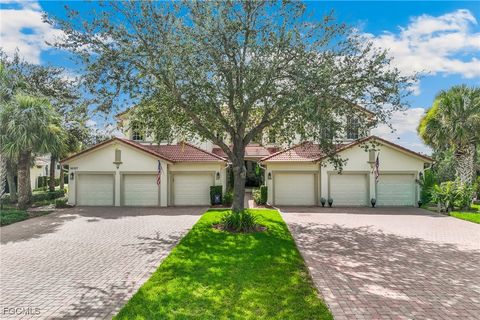
2002
16107 Mount Abbey Way, Fort Myers, FL 33908
$-691
Cash flow
-9.1%
Cash-on-Cash Return
4.0%
Cap rate
0.6%
Rent to Value Ratio
Active
$259,000
3
bds
|
2
ba
|
1,490
sqft
|
built
1985
15628 Carriedale Ln, Fort Myers, FL 33912
$-1,864
Cash flow
-37.5%
Cash-on-Cash Return
-2.5%
Cap rate
0.8%
Rent to Value Ratio
Active
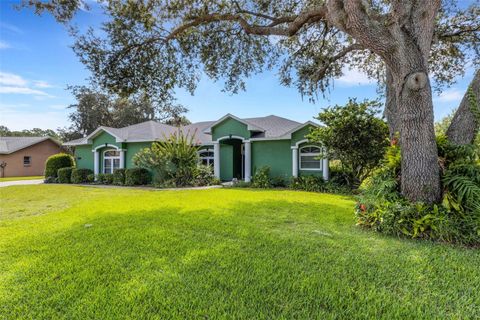
$469,900
3
bds
|
2
ba
|
2,129
sqft
|
built
2000
1669 Kinsman Way, Lakeland, FL 33809
$-705
Cash flow
-7.8%
Cash-on-Cash Return
4.3%
Cap rate
0.6%
Rent to Value Ratio
Active
$519,000
3
bds
|
2
ba
|
1,665
sqft
|
built
1959
620 N 64th Ave, Hollywood, FL 33024
$-849
Cash flow
-8.5%
Cash-on-Cash Return
4.2%
Cap rate
0.5%
Rent to Value Ratio

Active
$1,415,000
4
bds
|
4
ba
|
3,921
sqft
|
built
2017
2851 Pine Forest Dr, Southport, NC 28461
$-3,572
Cash flow
-13.2%
Cash-on-Cash Return
2.6%
Cap rate
0.4%
Rent to Value Ratio
Active
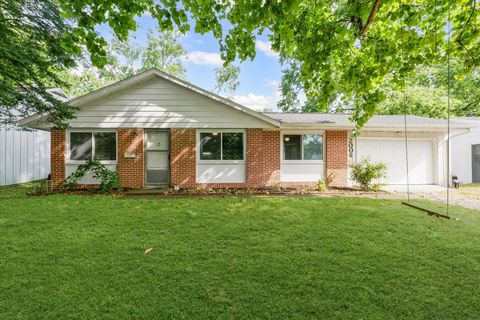
$177,000
4
bds
|
2
ba
|
1,193
sqft
|
built
1972
2006 E Michigan Ave, Urbana, IL 61802
$163
Cash flow
4.8%
Cash-on-Cash Return
6.8%
Cap rate
1.0%
Rent to Value Ratio
Active
$299,000
3
bds
|
2
ba
|
1,832
sqft
|
built
1976
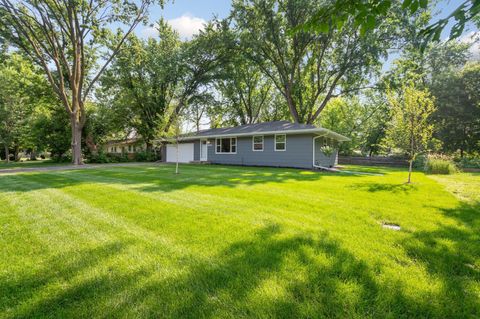
10436 Yorktown Ln N, Maple Grove, MN 55369
$-568
Cash flow
-9.9%
Cash-on-Cash Return
3.4%
Cap rate
0.7%
Rent to Value Ratio
Active
$174,900
2
bds
|
1
ba
|
968
sqft
|
built
1951
326 Nassau St, Park Forest, IL 60466
$-257
Cash flow
-7.7%
Cash-on-Cash Return
3.9%
Cap rate
1.0%
Rent to Value Ratio
Active
$350,000
3
bds
|
2
ba
|
0
sqft
|
built
1986
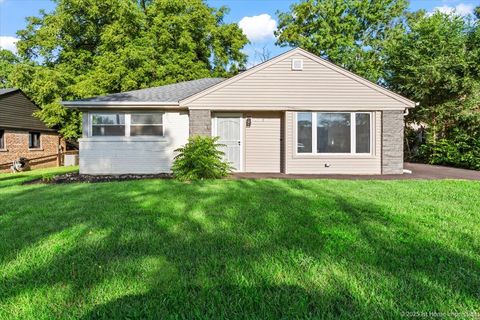
111 Libby Ln, Stockbridge, GA 30281
$-784
Cash flow
-11.7%
Cash-on-Cash Return
3.5%
Cap rate
0.6%
Rent to Value Ratio

Active
$540,000
3
bds
|
3
ba
|
1,916
sqft
|
built
2018
1555 S Loren Ln, Gilbert, AZ 85296
$-1,121
Cash flow
-10.8%
Cash-on-Cash Return
3.2%
Cap rate
0.5%
Rent to Value Ratio
Active
$319,900
3
bds
|
2
ba
|
1,388
sqft
|
built
1976
4561 Alps Ct, Columbus, OH 43230
$-131
Cash flow
-2.1%
Cash-on-Cash Return
5.2%
Cap rate
0.8%
Rent to Value Ratio

Active
$6,500,000
4
bds
|
6
ba
|
5,730
sqft
|
built
1997
1643 Brickell Ave, Miami, FL 33129
$-41,001
Cash flow
-32.9%
Cash-on-Cash Return
-1.4%
Cap rate
0.1%
Rent to Value Ratio
Active
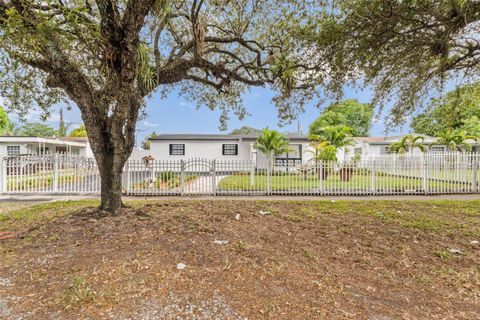
$450,000
2
bds
|
1
ba
|
882
sqft
|
built
1947
2429 NW 86th St, Miami, FL 33147
$-1,130
Cash flow
-13.1%
Cash-on-Cash Return
3.1%
Cap rate
0.5%
Rent to Value Ratio

Active
$850,000
3
bds
|
0
ba
|
1,531
sqft
|
built
1940
8044 NW 1st Pl, Miami, FL 33150
$-3,123
Cash flow
-19.2%
Cash-on-Cash Return
1.7%
Cap rate
0.3%
Rent to Value Ratio
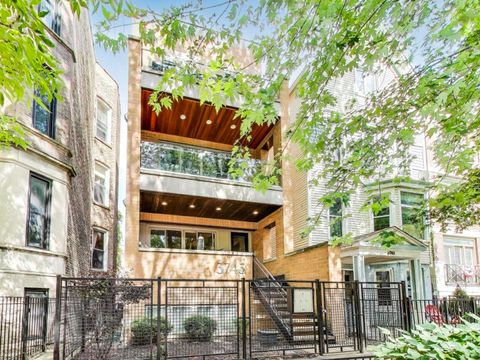
Active
$1,100,000
4
bds
|
3
ba
|
2,416
sqft
|
built
2014
3743 N Kenmore Ave, Chicago, IL 60613
$-2,728
Cash flow
-12.9%
Cash-on-Cash Return
2.7%
Cap rate
0.5%
Rent to Value Ratio
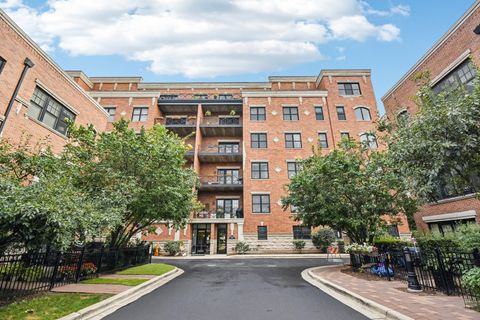
Active
$499,000
2
bds
|
2
ba
|
1,596
sqft
|
built
2010
2811 N Bell Ave, Chicago, IL 60618
$-1,196
Cash flow
-12.5%
Cash-on-Cash Return
2.8%
Cap rate
0.7%
Rent to Value Ratio
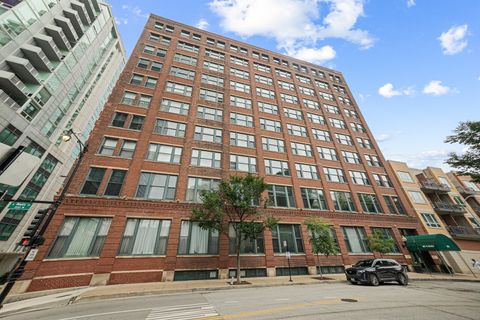
Active
$350,000
2
bds
|
1
ba
|
0
sqft
|
built
1906
801 S Wells St, Chicago, IL 60607
$-631
Cash flow
-9.4%
Cash-on-Cash Return
3.5%
Cap rate
0.8%
Rent to Value Ratio
Active
$232,500
3
bds
|
2
ba
|
1,450
sqft
|
built
2023
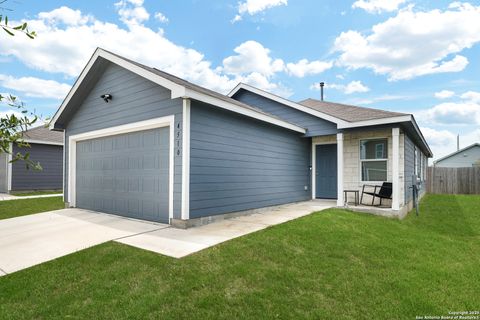
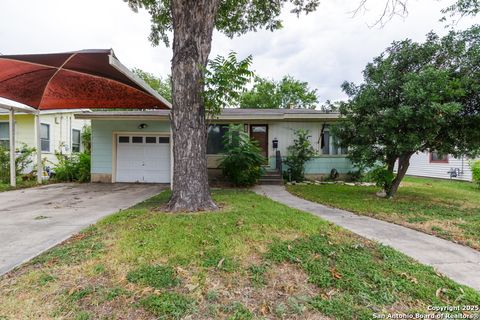
4510 Martin Way, San Antonio, TX 78222
$-259
Cash flow
-5.8%
Cash-on-Cash Return
4.3%
Cap rate
0.8%
Rent to Value Ratio
Active
$174,999
1
bds
|
2
ba
|
664
sqft
|
built
2023
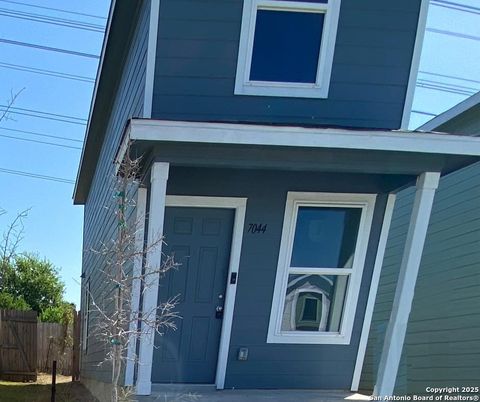
7044 Elm Cv, San Antonio, TX 78244
$130
Cash flow
3.9%
Cash-on-Cash Return
6.6%
Cap rate
0.9%
Rent to Value Ratio
Active
$140,000
3
bds
|
1
ba
|
728
sqft
|
built
1943
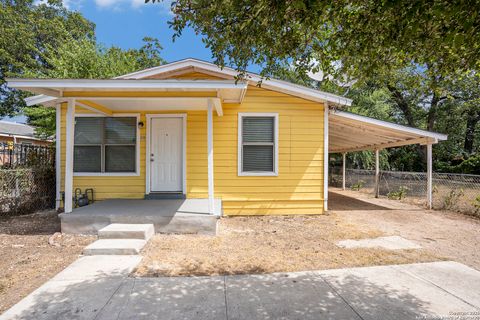
235 Noria St, San Antonio, TX 78207
$-257
Cash flow
-9.6%
Cash-on-Cash Return
3.5%
Cap rate
0.6%
Rent to Value Ratio
Active
$450,000
4
bds
|
3
ba
|
2,474
sqft
|
built
1992
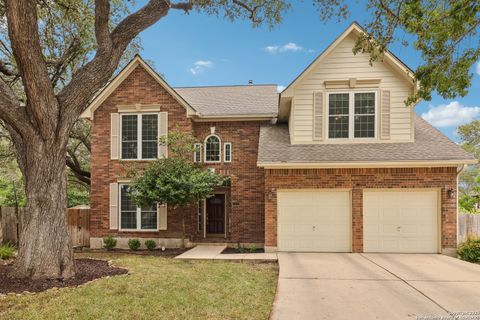
1302 Adobe Run, San Antonio, TX 78232
$-1,343
Cash flow
-15.6%
Cash-on-Cash Return
2.1%
Cap rate
0.6%
Rent to Value Ratio
Active
$175,000
2
bds
|
1
ba
|
1,018
sqft
|
built
1952
206 Laddie Pl, San Antonio, TX 78201
$24
Cash flow
0.7%
Cash-on-Cash Return
5.8%
Cap rate
0.9%
Rent to Value Ratio
Active
$399,900
4
bds
|
2
ba
|
1,843
sqft
|
built
1968
11632 Utah Ave N, Champlin, MN 55316
$-653
Cash flow
-8.5%
Cash-on-Cash Return
3.7%
Cap rate
0.6%
Rent to Value Ratio

Active
$975,000
4
bds
|
5
ba
|
4,024
sqft
|
built
2008
10526 Campo Viejo, Boerne, TX 78006
$-2,055
Cash flow
-11.0%
Cash-on-Cash Return
3.1%
Cap rate
0.6%
Rent to Value Ratio
Active
$660,000
5
bds
|
3.5
ba
|
6,152
sqft
|
built
2005
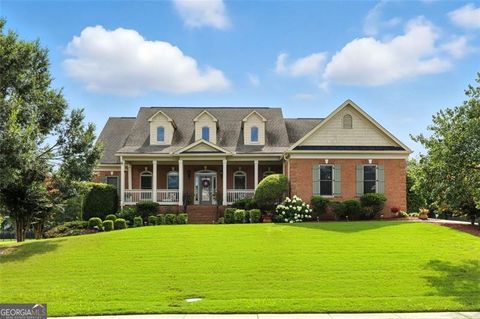
2111 Rosebury Park Dr, Dacula, GA 30019
$-1,396
Cash flow
-11.0%
Cash-on-Cash Return
3.6%
Cap rate
0.5%
Rent to Value Ratio
Active
$399,000
4
bds
|
3
ba
|
2,242
sqft
|
built
1974
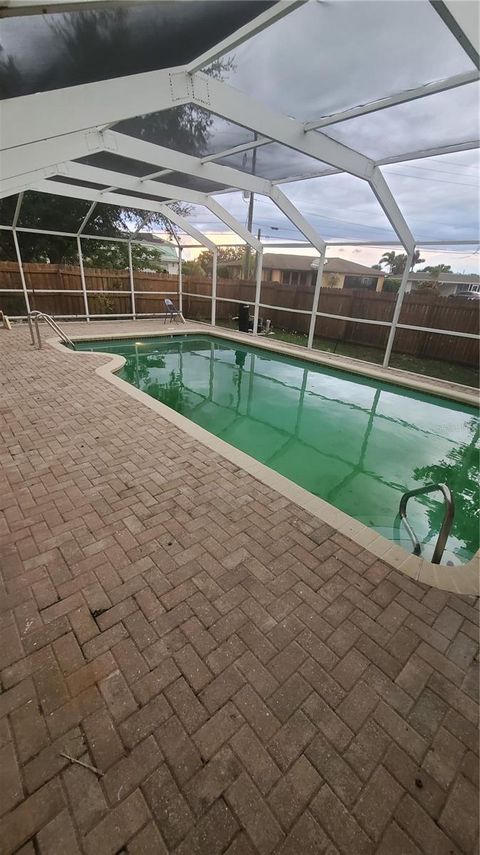
23102 Mac Lellan Ave, Port Charlotte, FL 33980
$-1,226
Cash flow
-16.0%
Cash-on-Cash Return
2.5%
Cap rate
0.5%
Rent to Value Ratio
Active
$290,000
3
bds
|
2
ba
|
1,056
sqft
|
built
1981
1464 W 32nd St, Riviera Beach, FL 33404
$9
Cash flow
0.2%
Cash-on-Cash Return
6.2%
Cap rate
0.9%
Rent to Value Ratio