United States Investment Properties for Sale
Browse homes for sale and investment properties in United States. Refine your search by price, property type, or more.
Best cash flowing properties in United States
Active
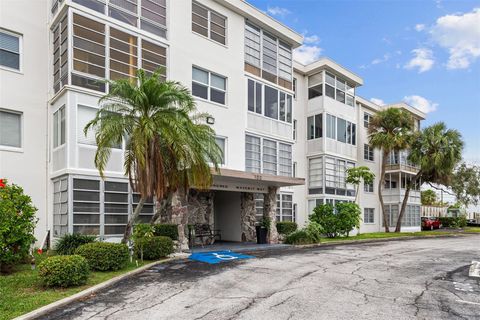
$179,000
2
bds
|
2
ba
|
830
sqft
|
built
1971
100 Waverly Way, Clearwater, FL 33756
$67
Cash flow
2.0%
Cash-on-Cash Return
6.6%
Cap rate
1.0%
Rent to Value Ratio
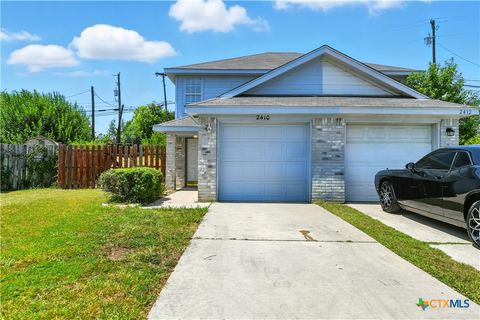
Active
$139,000
2
bds
|
2
ba
|
1,122
sqft
|
built
1995
2410 Royal Crest Cir, Killeen, TX 76549
$42
Cash flow
1.6%
Cash-on-Cash Return
6.0%
Cap rate
0.9%
Rent to Value Ratio
10,000 out of 309,014 properties for sale in United States
Limited Results Shown
Create a free account, or log in to reveal all property listings and enjoy the complete experience.
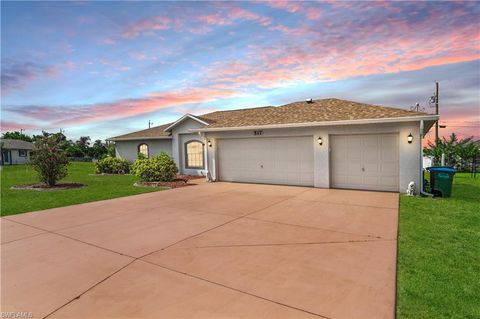
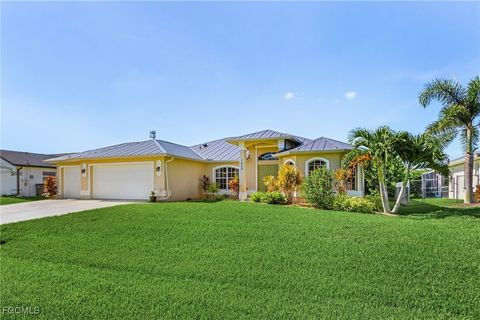
Active
$323,000
4
bds
|
2
ba
|
1,757
sqft
|
built
2007
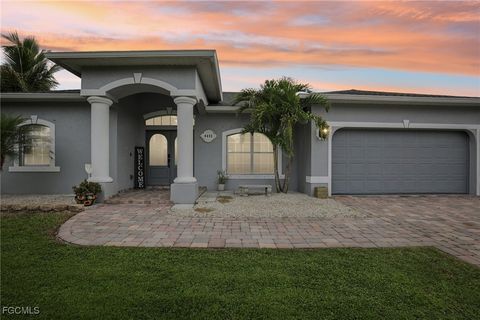
517 SE 27th St, Cape Coral, FL 33904
$-242
Cash flow
-3.9%
Cash-on-Cash Return
5.2%
Cap rate
0.7%
Rent to Value Ratio
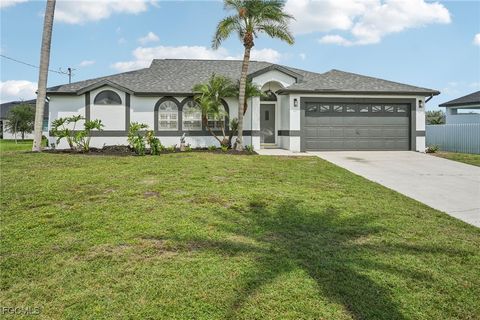
Active
$299,900
3
bds
|
2
ba
|
1,352
sqft
|
built
1991
479 NE 2nd Pl, Cape Coral, FL 33909
$-336
Cash flow
-5.8%
Cash-on-Cash Return
4.8%
Cap rate
0.7%
Rent to Value Ratio
Active
$599,000
3
bds
|
2
ba
|
1,878
sqft
|
built
2007
1628 SW 44th Ter, Cape Coral, FL 33914
$-1,277
Cash flow
-11.1%
Cash-on-Cash Return
3.6%
Cap rate
0.6%
Rent to Value Ratio
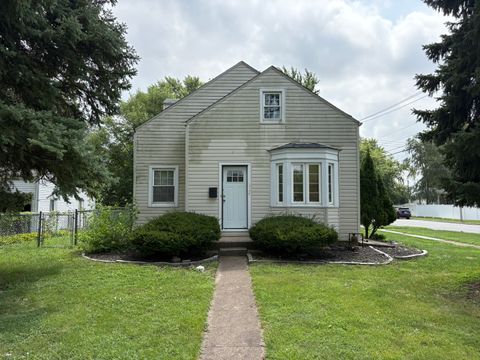
Active
$250,000
3
bds
|
2
ba
|
858
sqft
|
built
1942
3125 W 114th St, Merrionette Park, IL 60803
$-45
Cash flow
-0.9%
Cash-on-Cash Return
5.5%
Cap rate
0.8%
Rent to Value Ratio
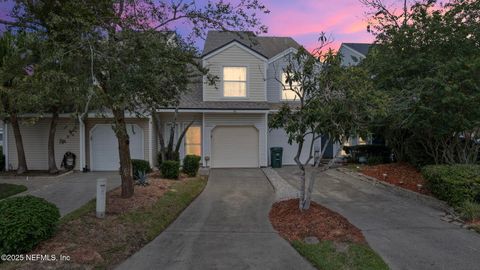
Active
$225,000
3
bds
|
2
ba
|
1,449
sqft
|
built
1987
3747 Moorings Ln, Jacksonville, FL 32257
$1
Cash flow
0.0%
Cash-on-Cash Return
6.2%
Cap rate
0.8%
Rent to Value Ratio
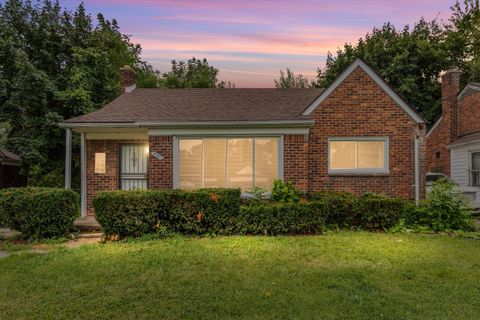
Active
$139,000
3
bds
|
1
ba
|
971
sqft
|
built
1950
9221 Grandville Ave, Detroit, MI 48228
$-66
Cash flow
-2.5%
Cash-on-Cash Return
5.6%
Cap rate
0.9%
Rent to Value Ratio
Active
$927,000
3
bds
|
3
ba
|
2,267
sqft
|
built
2000
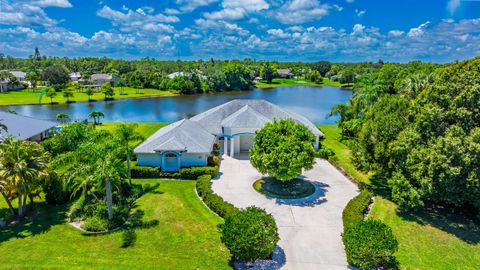
800 SE Waterside Way, Stuart, FL 34997
$-2,447
Cash flow
-13.8%
Cash-on-Cash Return
3.0%
Cap rate
0.4%
Rent to Value Ratio
Active
$680,000
4
bds
|
3
ba
|
2,618
sqft
|
built
1973
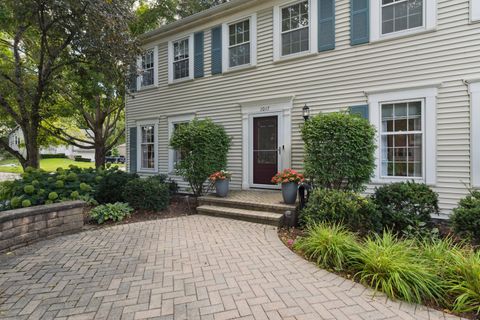
1017 Dawes St, Libertyville, IL 60048
$-1,595
Cash flow
-12.2%
Cash-on-Cash Return
2.9%
Cap rate
0.6%
Rent to Value Ratio

Active
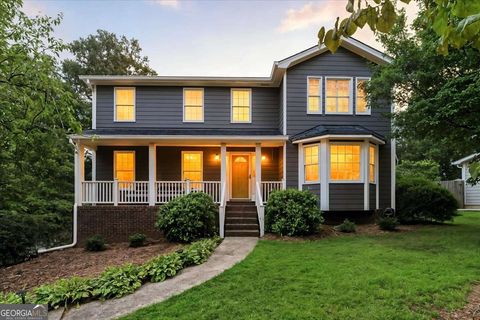
$330,000
4
bds
|
2
ba
|
1,694
sqft
|
built
1985
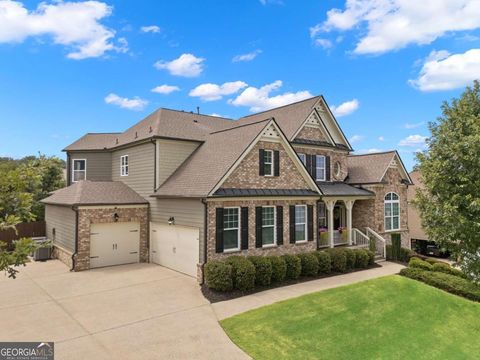
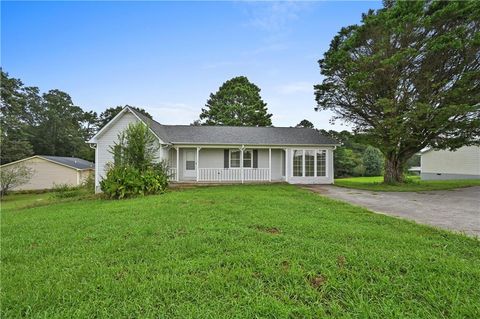
2379 Moseley Pl SW, Marietta, GA 30008
$-416
Cash flow
-6.6%
Cash-on-Cash Return
4.6%
Cap rate
0.7%
Rent to Value Ratio
Active
$1,195,000
6
bds
|
5.5
ba
|
5,910
sqft
|
built
2014
5225 Southern Hills Ln, Cumming, GA 30040
$-4,192
Cash flow
-18.3%
Cash-on-Cash Return
1.9%
Cap rate
0.3%
Rent to Value Ratio
Active
$365,000
4
bds
|
3
ba
|
2,355
sqft
|
built
2008
4455 W Price Blvd, North Port, FL 34286
$-353
Cash flow
-5.0%
Cash-on-Cash Return
5.0%
Cap rate
0.7%
Rent to Value Ratio
Active
$260,000
3
bds
|
2
ba
|
1,213
sqft
|
built
1998
4364 Hansard Ave, North Port, FL 34286
$-239
Cash flow
-4.8%
Cash-on-Cash Return
5.0%
Cap rate
0.8%
Rent to Value Ratio
Active
$250,000
1
bds
|
1
ba
|
786
sqft
|
built
1985
7412 Canterbury Pl, Downers Grove, IL 60516
$-486
Cash flow
-10.1%
Cash-on-Cash Return
3.3%
Cap rate
0.6%
Rent to Value Ratio
Active
$430,000
3
bds
|
2
ba
|
1,638
sqft
|
built
2007
826 Lantern Way, Clearwater, FL 33765
$-896
Cash flow
-10.9%
Cash-on-Cash Return
3.6%
Cap rate
0.5%
Rent to Value Ratio
Active
$680,000
5
bds
|
5
ba
|
3,785
sqft
|
built
2013
5035 Carriage Bridge Ln, Cumming, GA 30040
$-1,470
Cash flow
-11.3%
Cash-on-Cash Return
3.6%
Cap rate
0.5%
Rent to Value Ratio

Active
$135,000
3
bds
|
1
ba
|
1,198
sqft
|
built
1930
2259 N Interstate 35, San Antonio, TX 78208
$-3
Cash flow
-0.1%
Cash-on-Cash Return
5.7%
Cap rate
1.1%
Rent to Value Ratio
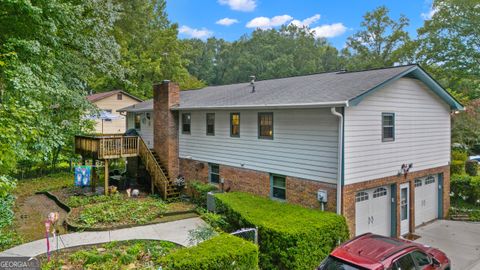
Active
$645,000
5
bds
|
4
ba
|
2,774
sqft
|
built
1979
2728 Saddle Ridge Lake Dr, Marietta, GA 30062
$-1,416
Cash flow
-11.5%
Cash-on-Cash Return
3.5%
Cap rate
0.4%
Rent to Value Ratio
Active
$399,000
4
bds
|
3
ba
|
3,224
sqft
|
built
1979
2420 Bob Bettis Rd, Marietta, GA 30066
$-586
Cash flow
-7.7%
Cash-on-Cash Return
4.4%
Cap rate
0.6%
Rent to Value Ratio
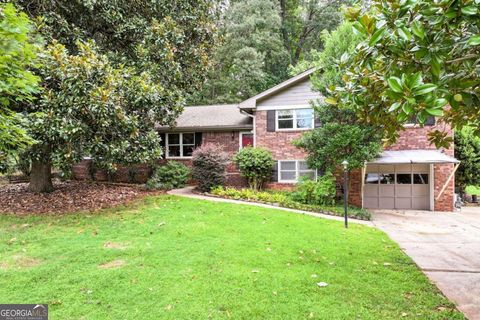
Active
$439,900
4
bds
|
2
ba
|
2,165
sqft
|
built
1968
3980 Philmont Dr, Marietta, GA 30066
$-717
Cash flow
-8.5%
Cash-on-Cash Return
4.2%
Cap rate
0.5%
Rent to Value Ratio
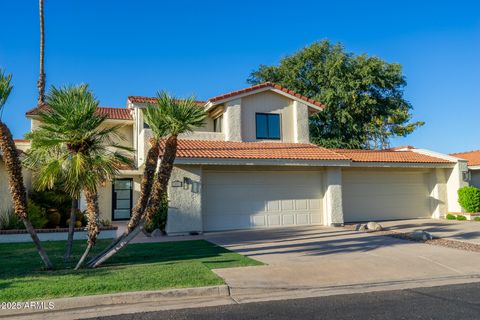
Active
$979,000
3
bds
|
3
ba
|
1,892
sqft
|
built
1980
7855 N Pinesview Dr, Scottsdale, AZ 85258
$-2,695
Cash flow
-14.4%
Cash-on-Cash Return
2.4%
Cap rate
0.4%
Rent to Value Ratio
Active
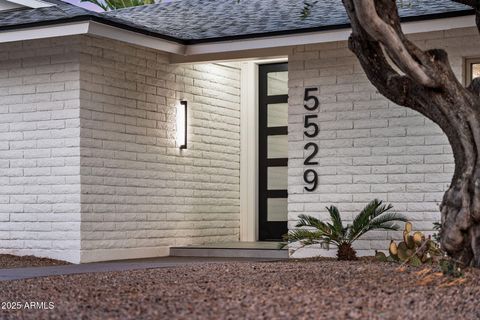
$1,749,999
5
bds
|
4
ba
|
3,025
sqft
|
built
1977
5529 E Windrose Dr, Scottsdale, AZ 85254
$-5,171
Cash flow
-15.4%
Cash-on-Cash Return
2.1%
Cap rate
0.3%
Rent to Value Ratio
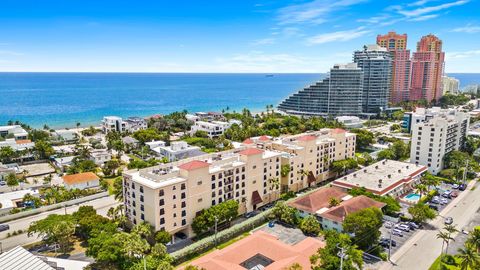
Active
$1,129,900
3
bds
|
4
ba
|
2,150
sqft
|
built
2009
2509 N Ocean Blvd, Fort Lauderdale, FL 33305
$-3,577
Cash flow
-16.5%
Cash-on-Cash Return
2.3%
Cap rate
0.7%
Rent to Value Ratio
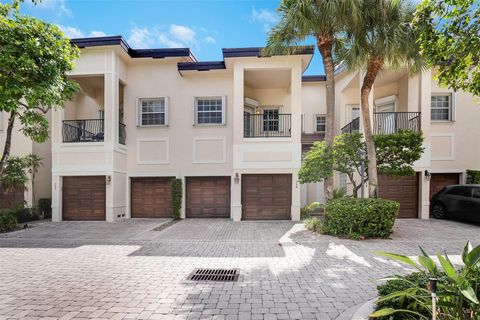
Active
$899,000
3
bds
|
3
ba
|
2,230
sqft
|
built
1999
320 NE 7th Ave, Fort Lauderdale, FL 33301
$-2,503
Cash flow
-14.5%
Cash-on-Cash Return
2.8%
Cap rate
0.6%
Rent to Value Ratio
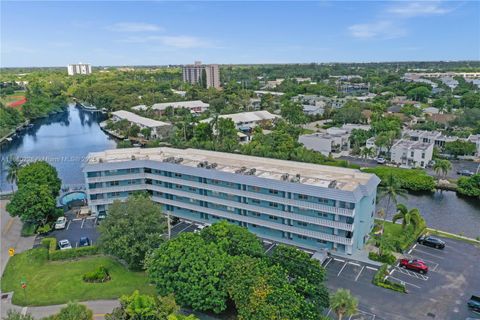
Active
$234,000
1
bds
|
1
ba
|
722
sqft
|
built
1973
801 NE 18th Ct, Fort Lauderdale, FL 33305
$-865
Cash flow
-19.3%
Cash-on-Cash Return
1.7%
Cap rate
0.8%
Rent to Value Ratio

Active
$10,900,000
3
bds
|
4
ba
|
2,023
sqft
|
built
1935
4640 N Bay Rd, Miami Beach, FL 33140
$-59,463
Cash flow
-28.5%
Cash-on-Cash Return
-0.4%
Cap rate
0.1%
Rent to Value Ratio

Active
$639,777
4
bds
|
2
ba
|
1,596
sqft
|
built
1958
1002 E Butler Dr, Phoenix, AZ 85020
$-1,565
Cash flow
-12.8%
Cash-on-Cash Return
2.7%
Cap rate
0.4%
Rent to Value Ratio

Active
$675,000
4
bds
|
2
ba
|
1,932
sqft
|
built
1976
15244 N 7th Pl, Phoenix, AZ 85022
$-1,517
Cash flow
-11.7%
Cash-on-Cash Return
3.0%
Cap rate
0.4%
Rent to Value Ratio
Active
$445,000
3
bds
|
2
ba
|
1,752
sqft
|
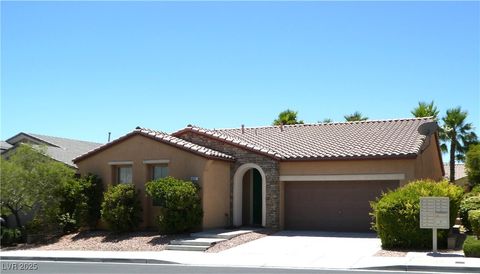
built
2006
9327 Oxbow Lake Ave, Las Vegas, NV 89149
$-869
Cash flow
-10.2%
Cash-on-Cash Return
3.3%
Cap rate
0.5%
Rent to Value Ratio
Active
$305,000
3
bds
|
2
ba
|
1,796
sqft
|
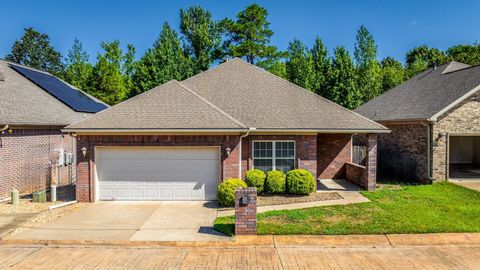
built
2007
8 Pennsylvania Ct, Little Rock, AR 72223
$-375
Cash flow
-6.4%
Cash-on-Cash Return
4.2%
Cap rate
0.7%
Rent to Value Ratio
Active
$489,987
10
bds
|
4
ba
|
3,076
sqft
|
built
1905
44-46 Calhoun St, Springfield, MA 01107
$-1,146
Cash flow
-12.2%
Cash-on-Cash Return
2.9%
Cap rate
0.5%
Rent to Value Ratio
Active
$4,495,000
6
bds
|
7
ba
|
7,867
sqft
|
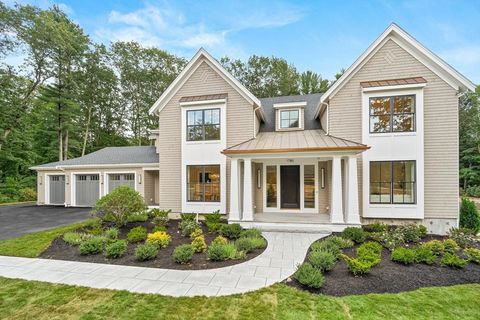
built
2025
1780 Central Ave, Needham, MA 02492
$-101,086
Cash flow
-117.3%
Cash-on-Cash Return
-21.3%
Cap rate
0.1%
Rent to Value Ratio
Active
$419,000
3
bds
|
4
ba
|
2,360
sqft
|
built
2002
3006 Countrybend Ln, Champaign, IL 61822
$-688
Cash flow
-8.6%
Cash-on-Cash Return
3.7%
Cap rate
0.7%
Rent to Value Ratio
Active
$825,000
4
bds
|
4
ba
|
3,297
sqft
|
built
2006
1621 English Oak Dr, Champaign, IL 61822
$-2,029
Cash flow
-12.8%
Cash-on-Cash Return
2.7%
Cap rate
0.5%
Rent to Value Ratio
Active
$800,000
4
bds
|
5
ba
|
4,307
sqft
|
built
2006
488 Chelsea Ave, Davenport, FL 33837
$-2,447
Cash flow
-16.0%
Cash-on-Cash Return
2.5%
Cap rate
0.4%
Rent to Value Ratio
Active
$255,000
4
bds
|
2
ba
|
1,380
sqft
|
built
1972
4555 Vinsetta Ave, North Fort Myers, FL 33903
$-99
Cash flow
-2.0%
Cash-on-Cash Return
5.7%
Cap rate
0.9%
Rent to Value Ratio
Active
$270,000
4
bds
|
2
ba
|
0
sqft
|
built
1990
254 Gravely Rd SE, Calhoun, GA 30701
$-335
Cash flow
-6.5%
Cash-on-Cash Return
4.7%
Cap rate
0.6%
Rent to Value Ratio
Active
$255,000
2
bds
|
2
ba
|
0
sqft
|
built
1992
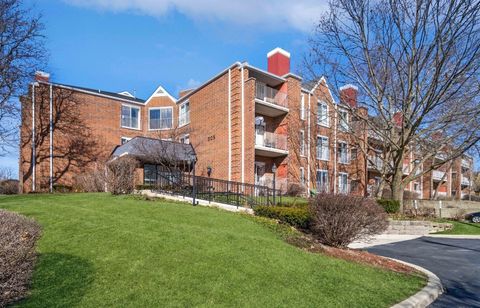
805 Leicester Rd, Elk Grove Village, IL 60007
$-581
Cash flow
-11.9%
Cash-on-Cash Return
2.9%
Cap rate
0.8%
Rent to Value Ratio
Active
$925,000
4
bds
|
3
ba
|
2,607
sqft
|
built
1989
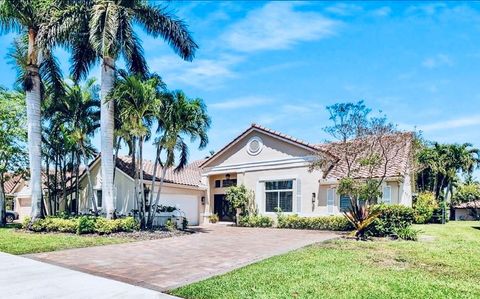
3140 Maple Ln, Davie, FL 33328
$-2,021
Cash flow
-11.4%
Cash-on-Cash Return
3.5%
Cap rate
0.6%
Rent to Value Ratio