Indiana Investment Properties for Sale
Browse homes for sale and investment properties in Indiana. Refine your search by price, property type, or more.
Best cash flowing properties in Indiana
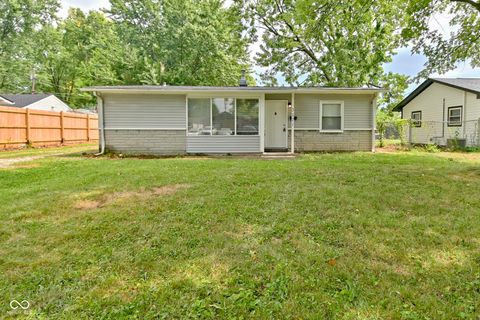
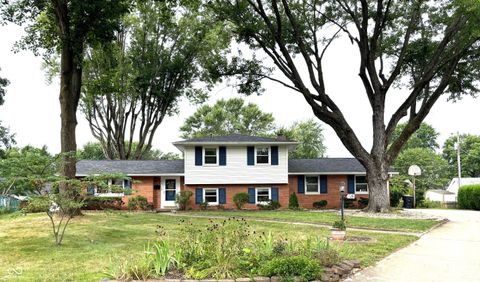
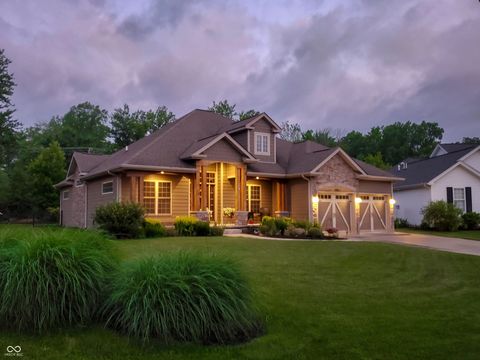
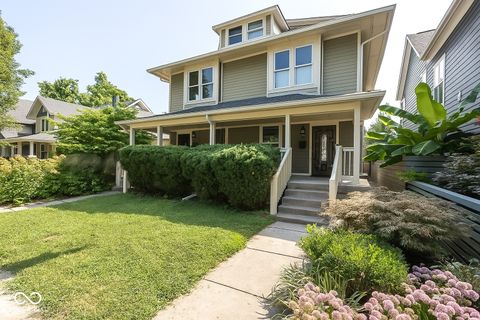
Active
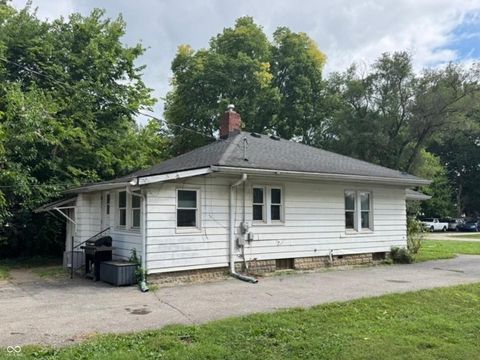
$127,000
2
bds
|
1
ba
|
886
sqft
|
built
1930
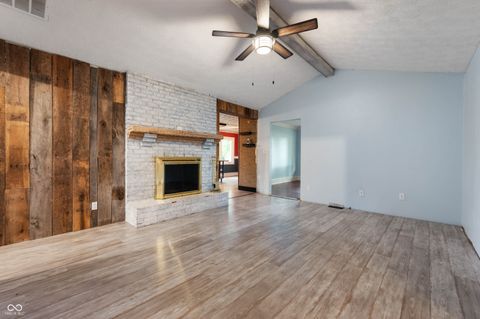
1024 N Alton Ave, Indianapolis, IN 46222
$315
Cash flow
12.9%
Cash-on-Cash Return
9.1%
Cap rate
1.1%
Rent to Value Ratio
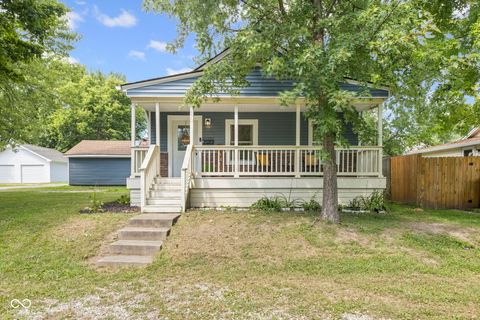
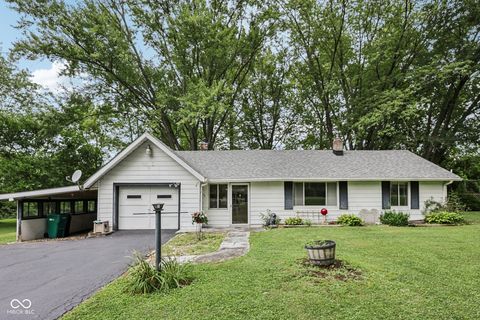
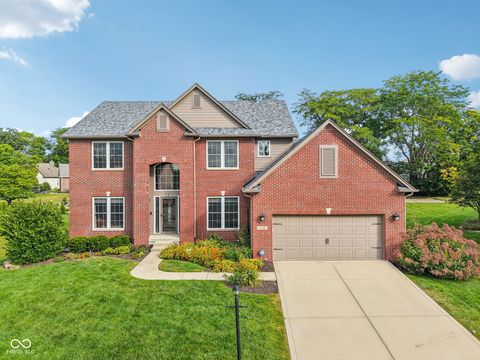
Active
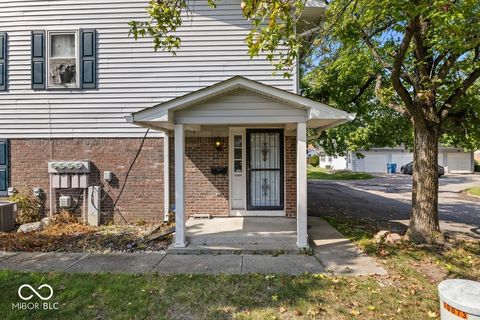
$100,000
2
bds
|
2
ba
|
1,012
sqft
|
built
1973
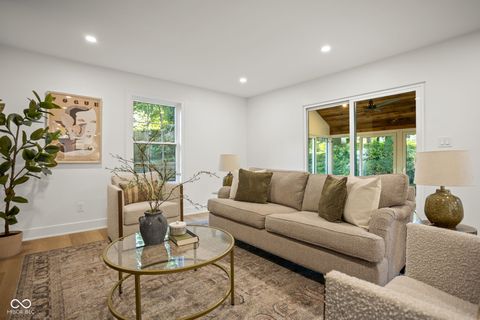
10064 Penrith Dr, Indianapolis, IN 46229
$136
Cash flow
7.1%
Cash-on-Cash Return
7.8%
Cap rate
1.2%
Rent to Value Ratio
3,610 out of 4,456 properties for sale in Indiana
Limited Results Shown
Create a free account, or log in to reveal all property listings and enjoy the complete experience.
Active
$385,000
3
bds
|
2
ba
|
1,389
sqft
|
built
1990
10700 Pimlico Cir, Carmel, IN 46280
$-532
Cash flow
-7.2%
Cash-on-Cash Return
4.5%
Cap rate
0.6%
Rent to Value Ratio
Active
$1,479,900
4
bds
|
4
ba
|
4,228
sqft
|
built
1984
8613 Seaward Ln, Indianapolis, IN 46256
$-4,451
Cash flow
-15.7%
Cash-on-Cash Return
2.5%
Cap rate
0.3%
Rent to Value Ratio
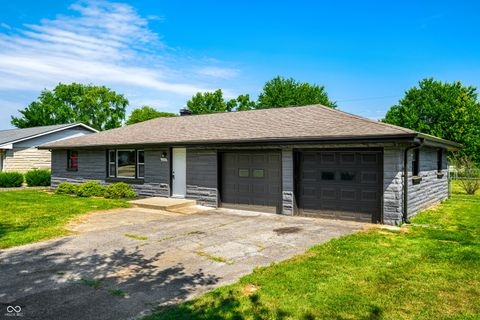
Active
$169,900
3
bds
|
1
ba
|
980
sqft
|
built
1955
3221 Lowry Rd, Indianapolis, IN 46222
$27
Cash flow
0.8%
Cash-on-Cash Return
6.3%
Cap rate
0.8%
Rent to Value Ratio
Active
$229,000
3
bds
|
1
ba
|
1,325
sqft
|
built
1935
870 Yandes St, Franklin, IN 46131
$69
Cash flow
1.6%
Cash-on-Cash Return
6.5%
Cap rate
0.8%
Rent to Value Ratio
Active
$300,000
3
bds
|
3
ba
|
2,238
sqft
|
built
1999
11835 Buck Creek Cir, Noblesville, IN 46060
$-178
Cash flow
-3.1%
Cash-on-Cash Return
5.4%
Cap rate
0.7%
Rent to Value Ratio
Active
$850,000
3
bds
|
3
ba
|
2,552
sqft
|
built
1988
20678 Hinkle Rd, Noblesville, IN 46062
$-2,146
Cash flow
-13.2%
Cash-on-Cash Return
3.1%
Cap rate
0.4%
Rent to Value Ratio
Active
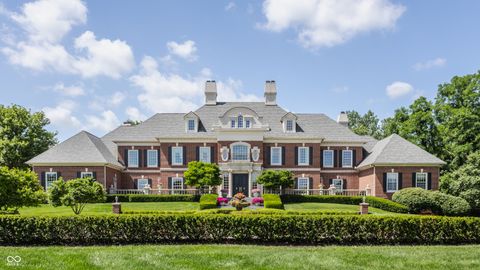
$11,900,000
5
bds
|
8
ba
|
13,904
sqft
|
built
2003
4141 W 116th St, Zionsville, IN 46077
$-57,163
Cash flow
-25.1%
Cash-on-Cash Return
0.4%
Cap rate
0.0%
Rent to Value Ratio
Active
$254,900
4
bds
|
3
ba
|
2,080
sqft
|
built
2004
10824 Orchard Valley Way, Indianapolis, IN 46235
$49
Cash flow
1.0%
Cash-on-Cash Return
6.4%
Cap rate
0.8%
Rent to Value Ratio
Active
$305,000
3
bds
|
3
ba
|
1,668
sqft
|
built
2000
3445 W 53rd St, Indianapolis, IN 46228
$-200
Cash flow
-3.4%
Cash-on-Cash Return
5.4%
Cap rate
0.7%
Rent to Value Ratio
Active
$594,900
6
bds
|
5
ba
|
4,290
sqft
|
built
2005
11581 Ludlow Dr, Fishers, IN 46037
$-674
Cash flow
-5.9%
Cash-on-Cash Return
4.8%
Cap rate
0.6%
Rent to Value Ratio

Active
$449,900
5
bds
|
3
ba
|
2,736
sqft
|
built
1995
8400 Harrison Pkwy, Fishers, IN 46038
$-596
Cash flow
-6.9%
Cash-on-Cash Return
4.6%
Cap rate
0.6%
Rent to Value Ratio
Active
$299,900
4
bds
|
3
ba
|
2,047
sqft
|
built
1966
4153 Kennedy Cir, Columbus, IN 47203
$-156
Cash flow
-2.7%
Cash-on-Cash Return
5.5%
Cap rate
0.7%
Rent to Value Ratio
Active
$194,900
3
bds
|
1
ba
|
1,107
sqft
|
built
1955
286 W Milhon North Dr, Mooresville, IN 46158
$106
Cash flow
2.8%
Cash-on-Cash Return
6.8%
Cap rate
0.8%
Rent to Value Ratio
Active
$515,000
4
bds
|
4
ba
|
3,655
sqft
|
built
1997
8363 Bighorn Ct, Fishers, IN 46038
$-658
Cash flow
-6.7%
Cash-on-Cash Return
4.6%
Cap rate
0.6%
Rent to Value Ratio
Active
$429,900
4
bds
|
5
ba
|
5,484
sqft
|
built
2002
5813 Grandvista Dr, Indianapolis, IN 46234
$37
Cash flow
0.4%
Cash-on-Cash Return
6.2%
Cap rate
0.8%
Rent to Value Ratio
Active
$539,900
3
bds
|
3
ba
|
3,310
sqft
|
built
2008
1750 Brookfield Dr, Columbus, IN 47201
$-648
Cash flow
-6.3%
Cash-on-Cash Return
4.7%
Cap rate
0.6%
Rent to Value Ratio
Active
$610,000
4
bds
|
3
ba
|
3,510
sqft
|
built
2002
4100 Field Master Cir, Zionsville, IN 46077
$-1,278
Cash flow
-10.9%
Cash-on-Cash Return
3.6%
Cap rate
0.5%
Rent to Value Ratio
Active
$620,000
2
bds
|
2
ba
|
1,827
sqft
|
built
1922
630 N College Ave, Indianapolis, IN 46204
$-1,946
Cash flow
-16.4%
Cash-on-Cash Return
2.4%
Cap rate
0.5%
Rent to Value Ratio
Active
$1,189,000
6
bds
|
6
ba
|
5,522
sqft
|
built
2012
15896 N Gray Rd, Noblesville, IN 46062
$-3,055
Cash flow
-13.4%
Cash-on-Cash Return
3.1%
Cap rate
0.4%
Rent to Value Ratio
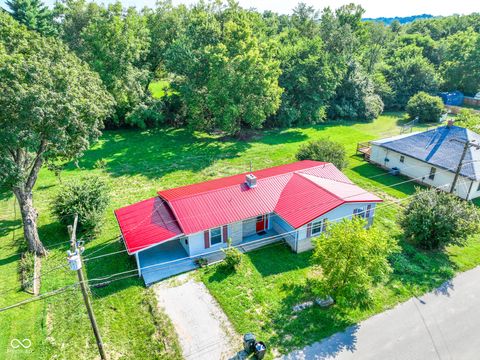
Active
$270,000
3
bds
|
2
ba
|
1,932
sqft
|
built
1977
972 N 200 W, Greenfield, IN 46140
$135
Cash flow
2.6%
Cash-on-Cash Return
6.7%
Cap rate
0.8%
Rent to Value Ratio

Active
$349,000
2
bds
|
2
ba
|
1,968
sqft
|
built
1969
600 W 10th St, Hobart, IN 46342
$-635
Cash flow
-9.5%
Cash-on-Cash Return
4.0%
Cap rate
0.6%
Rent to Value Ratio
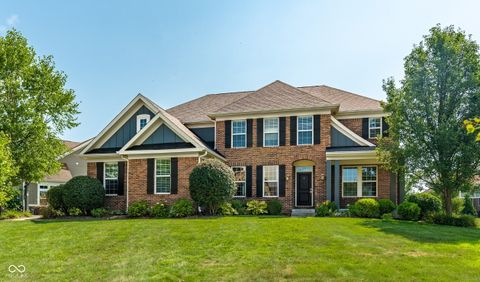
Active
$818,010
4
bds
|
3
ba
|
3,385
sqft
|
built
1969
12 Maplecrest Dr, Carmel, IN 46033
$-2,189
Cash flow
-14.0%
Cash-on-Cash Return
2.9%
Cap rate
0.4%
Rent to Value Ratio
Active
$289,000
3
bds
|
1
ba
|
2,320
sqft
|
built
1957
2230 Sims Dr, Columbus, IN 47203
$38
Cash flow
0.7%
Cash-on-Cash Return
6.3%
Cap rate
0.8%
Rent to Value Ratio

Active
$599,000
3
bds
|
2
ba
|
2,950
sqft
|
built
1991
2735 Little Hurricane Rd, Martinsville, IN 46151
$-1,136
Cash flow
-9.9%
Cash-on-Cash Return
3.9%
Cap rate
0.5%
Rent to Value Ratio
Active
$215,000
3
bds
|
2
ba
|
1,656
sqft
|
built
1960
1106 W Walnut St, Salem, IN 47167
$72
Cash flow
1.7%
Cash-on-Cash Return
6.5%
Cap rate
0.8%
Rent to Value Ratio
Active
$659,900
3
bds
|
2
ba
|
1,559
sqft
|
built
1958
650 Mulberry St, Zionsville, IN 46077
$-1,862
Cash flow
-14.7%
Cash-on-Cash Return
2.8%
Cap rate
0.3%
Rent to Value Ratio
Active
$899,900
4
bds
|
4
ba
|
3,154
sqft
|
built
2000
4700 W 1100 N, Wheatfield, IN 46392
$-2,341
Cash flow
-13.6%
Cash-on-Cash Return
3.0%
Cap rate
0.4%
Rent to Value Ratio
Active
$585,000
4
bds
|
2
ba
|
3,642
sqft
|
built
1960
9797 Ditch Rd, Carmel, IN 46032
$-1,065
Cash flow
-9.5%
Cash-on-Cash Return
4.0%
Cap rate
0.5%
Rent to Value Ratio
Active
$300,000
2
bds
|
2
ba
|
1,830
sqft
|
built
2016
10327 Gateway Dr, Indianapolis, IN 46234
$-369
Cash flow
-6.4%
Cash-on-Cash Return
4.7%
Cap rate
0.7%
Rent to Value Ratio
Active
$575,900
3
bds
|
3
ba
|
3,742
sqft
|
built
2003
3325 Nottinghill Dr E, Plainfield, IN 46168
$-1,493
Cash flow
-13.5%
Cash-on-Cash Return
3.0%
Cap rate
0.4%
Rent to Value Ratio
Active
$519,900
5
bds
|
3
ba
|
3,354
sqft
|
built
1995
6224 N County Road 1125 E, Shirley, IN 47384
$-800
Cash flow
-8.0%
Cash-on-Cash Return
4.3%
Cap rate
0.5%
Rent to Value Ratio
Active
$269,900
3
bds
|
2
ba
|
1,376
sqft
|
built
1976
4934 Cottonwood Ct N, Columbus, IN 47203
$-3
Cash flow
-0.1%
Cash-on-Cash Return
6.1%
Cap rate
0.7%
Rent to Value Ratio
Active
$340,000
4
bds
|
3
ba
|
2,350
sqft
|
built
2004
10123 Morning Light Dr, Avon, IN 46123
$-179
Cash flow
-2.7%
Cash-on-Cash Return
5.5%
Cap rate
0.7%
Rent to Value Ratio
Active
$439,000
3
bds
|
3
ba
|
3,026
sqft
|
built
1980
2233 N Talbott St, Indianapolis, IN 46205
$-317
Cash flow
-3.8%
Cash-on-Cash Return
5.3%
Cap rate
0.6%
Rent to Value Ratio
Active
$915,000
4
bds
|
5
ba
|
4,818
sqft
|
built
2013
3832 Pelham Rd, Carmel, IN 46074
$-1,709
Cash flow
-9.7%
Cash-on-Cash Return
3.9%
Cap rate
0.5%
Rent to Value Ratio
Active
$325,000
4
bds
|
2
ba
|
2,148
sqft
|
built
2000
219 Creekview Cir, Mooresville, IN 46158
$-172
Cash flow
-2.8%
Cash-on-Cash Return
5.5%
Cap rate
0.7%
Rent to Value Ratio
Active
$440,000
4
bds
|
3
ba
|
2,336
sqft
|
built
2000
3740 Smith Rd, Nashville, IN 47448
$-667
Cash flow
-7.9%
Cash-on-Cash Return
4.3%
Cap rate
0.5%
Rent to Value Ratio
Active
$300,000
3
bds
|
3
ba
|
2,060
sqft
|
built
1994
567 Lakewood Ct, Greentown, IN 46936
$-157
Cash flow
-2.7%
Cash-on-Cash Return
5.5%
Cap rate
0.7%
Rent to Value Ratio